At POLYTECH↗ET, 98.1% of the class of 2023 walked across the stage with a diploma. At Christina↗ET, 25 miles north and serving the same state, just 73.2% did. The gap between those two numbers, nearly 25 percentage points, is larger than the difference between the highest-performing state in the country and the lowest.
But POLYTECH is not a typical school district. It is one of Delaware's three vocational-technical districts, and its graduation rate is not an outlier within that sector. NCC Vo-Tech↗ET graduates 97.5%. Sussex Technical↗ET graduates 95.7%. The vo-tech average, 97.1%, sits 10.4 percentage points above the traditional district average of 86.6%.
The question this gap raises is not whether it exists. It has persisted for nine consecutive years. The question is what it means.
Three districts, one pattern
Delaware's vo-tech districts occupy a distinct structural position. Each serves one of the state's three counties, drawing students by application and lottery from the traditional districts that surround them. NCC Vo-Tech operates four high schools in New Castle County. POLYTECH runs a single campus in Kent County. Sussex Technical serves one high school in Sussex County.
Since 2015, their collective graduation rate has never dipped below 95%. The traditional district average, meanwhile, has fluctuated between 82.5% and 86.6%.
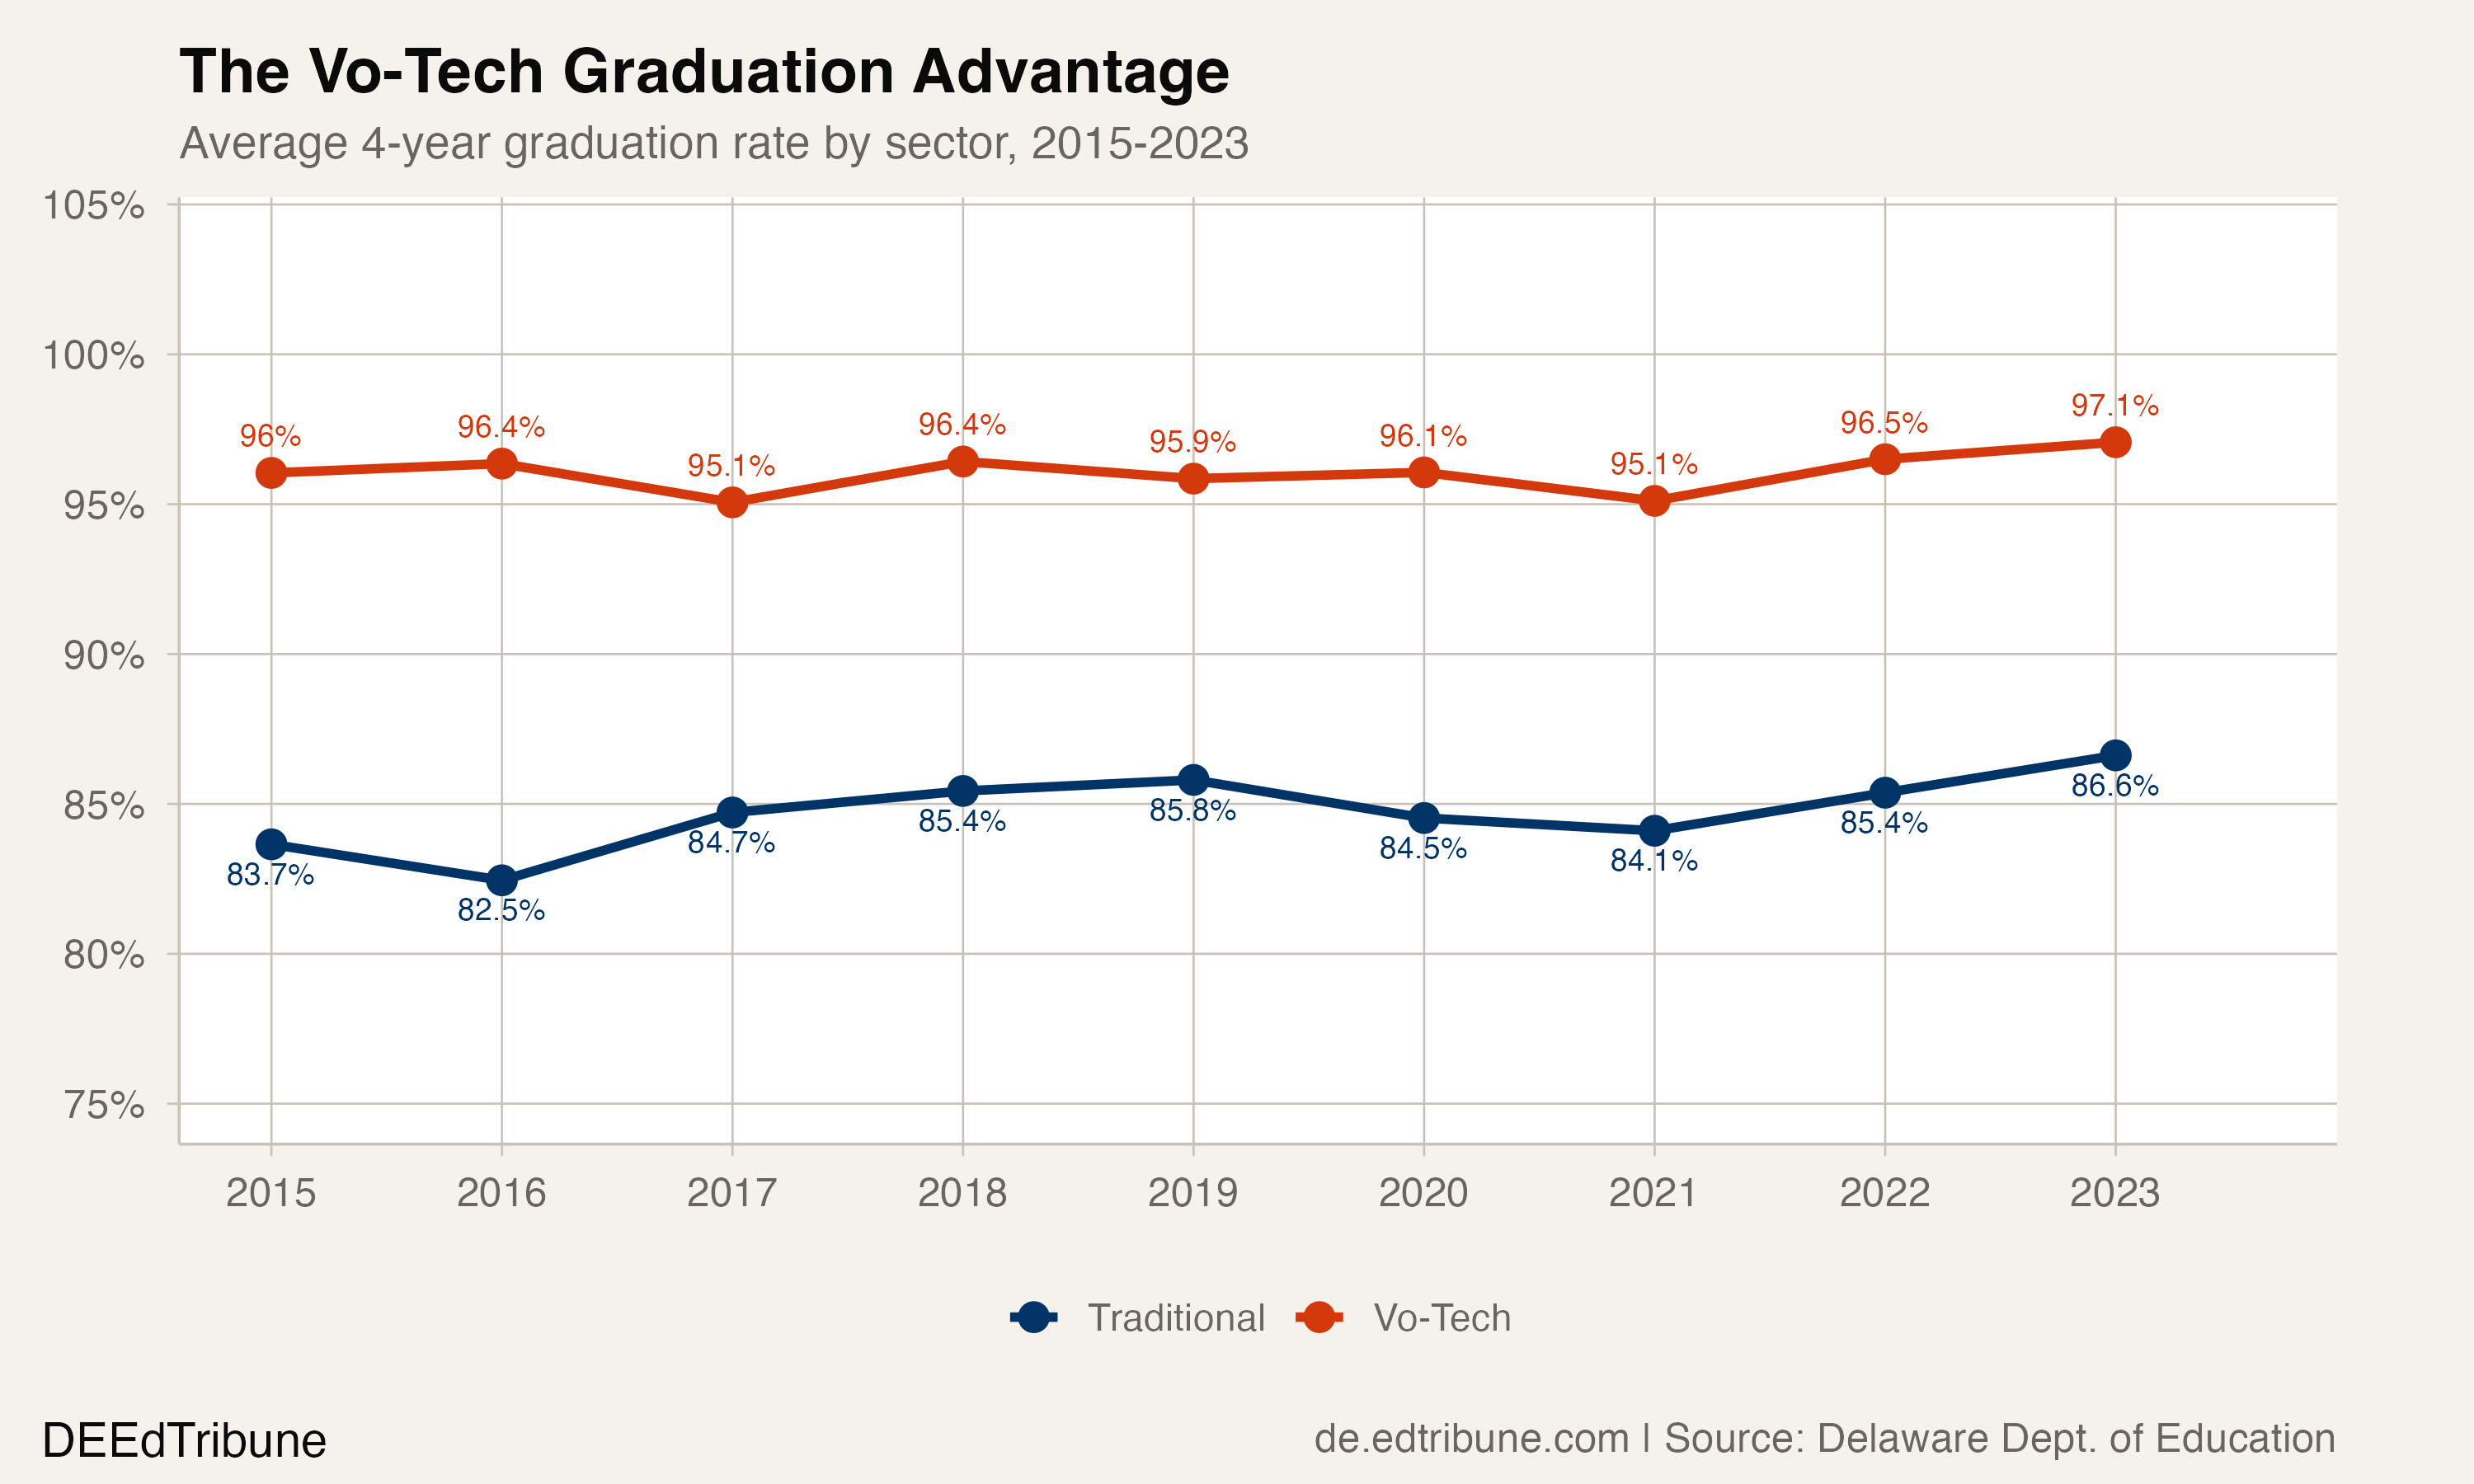
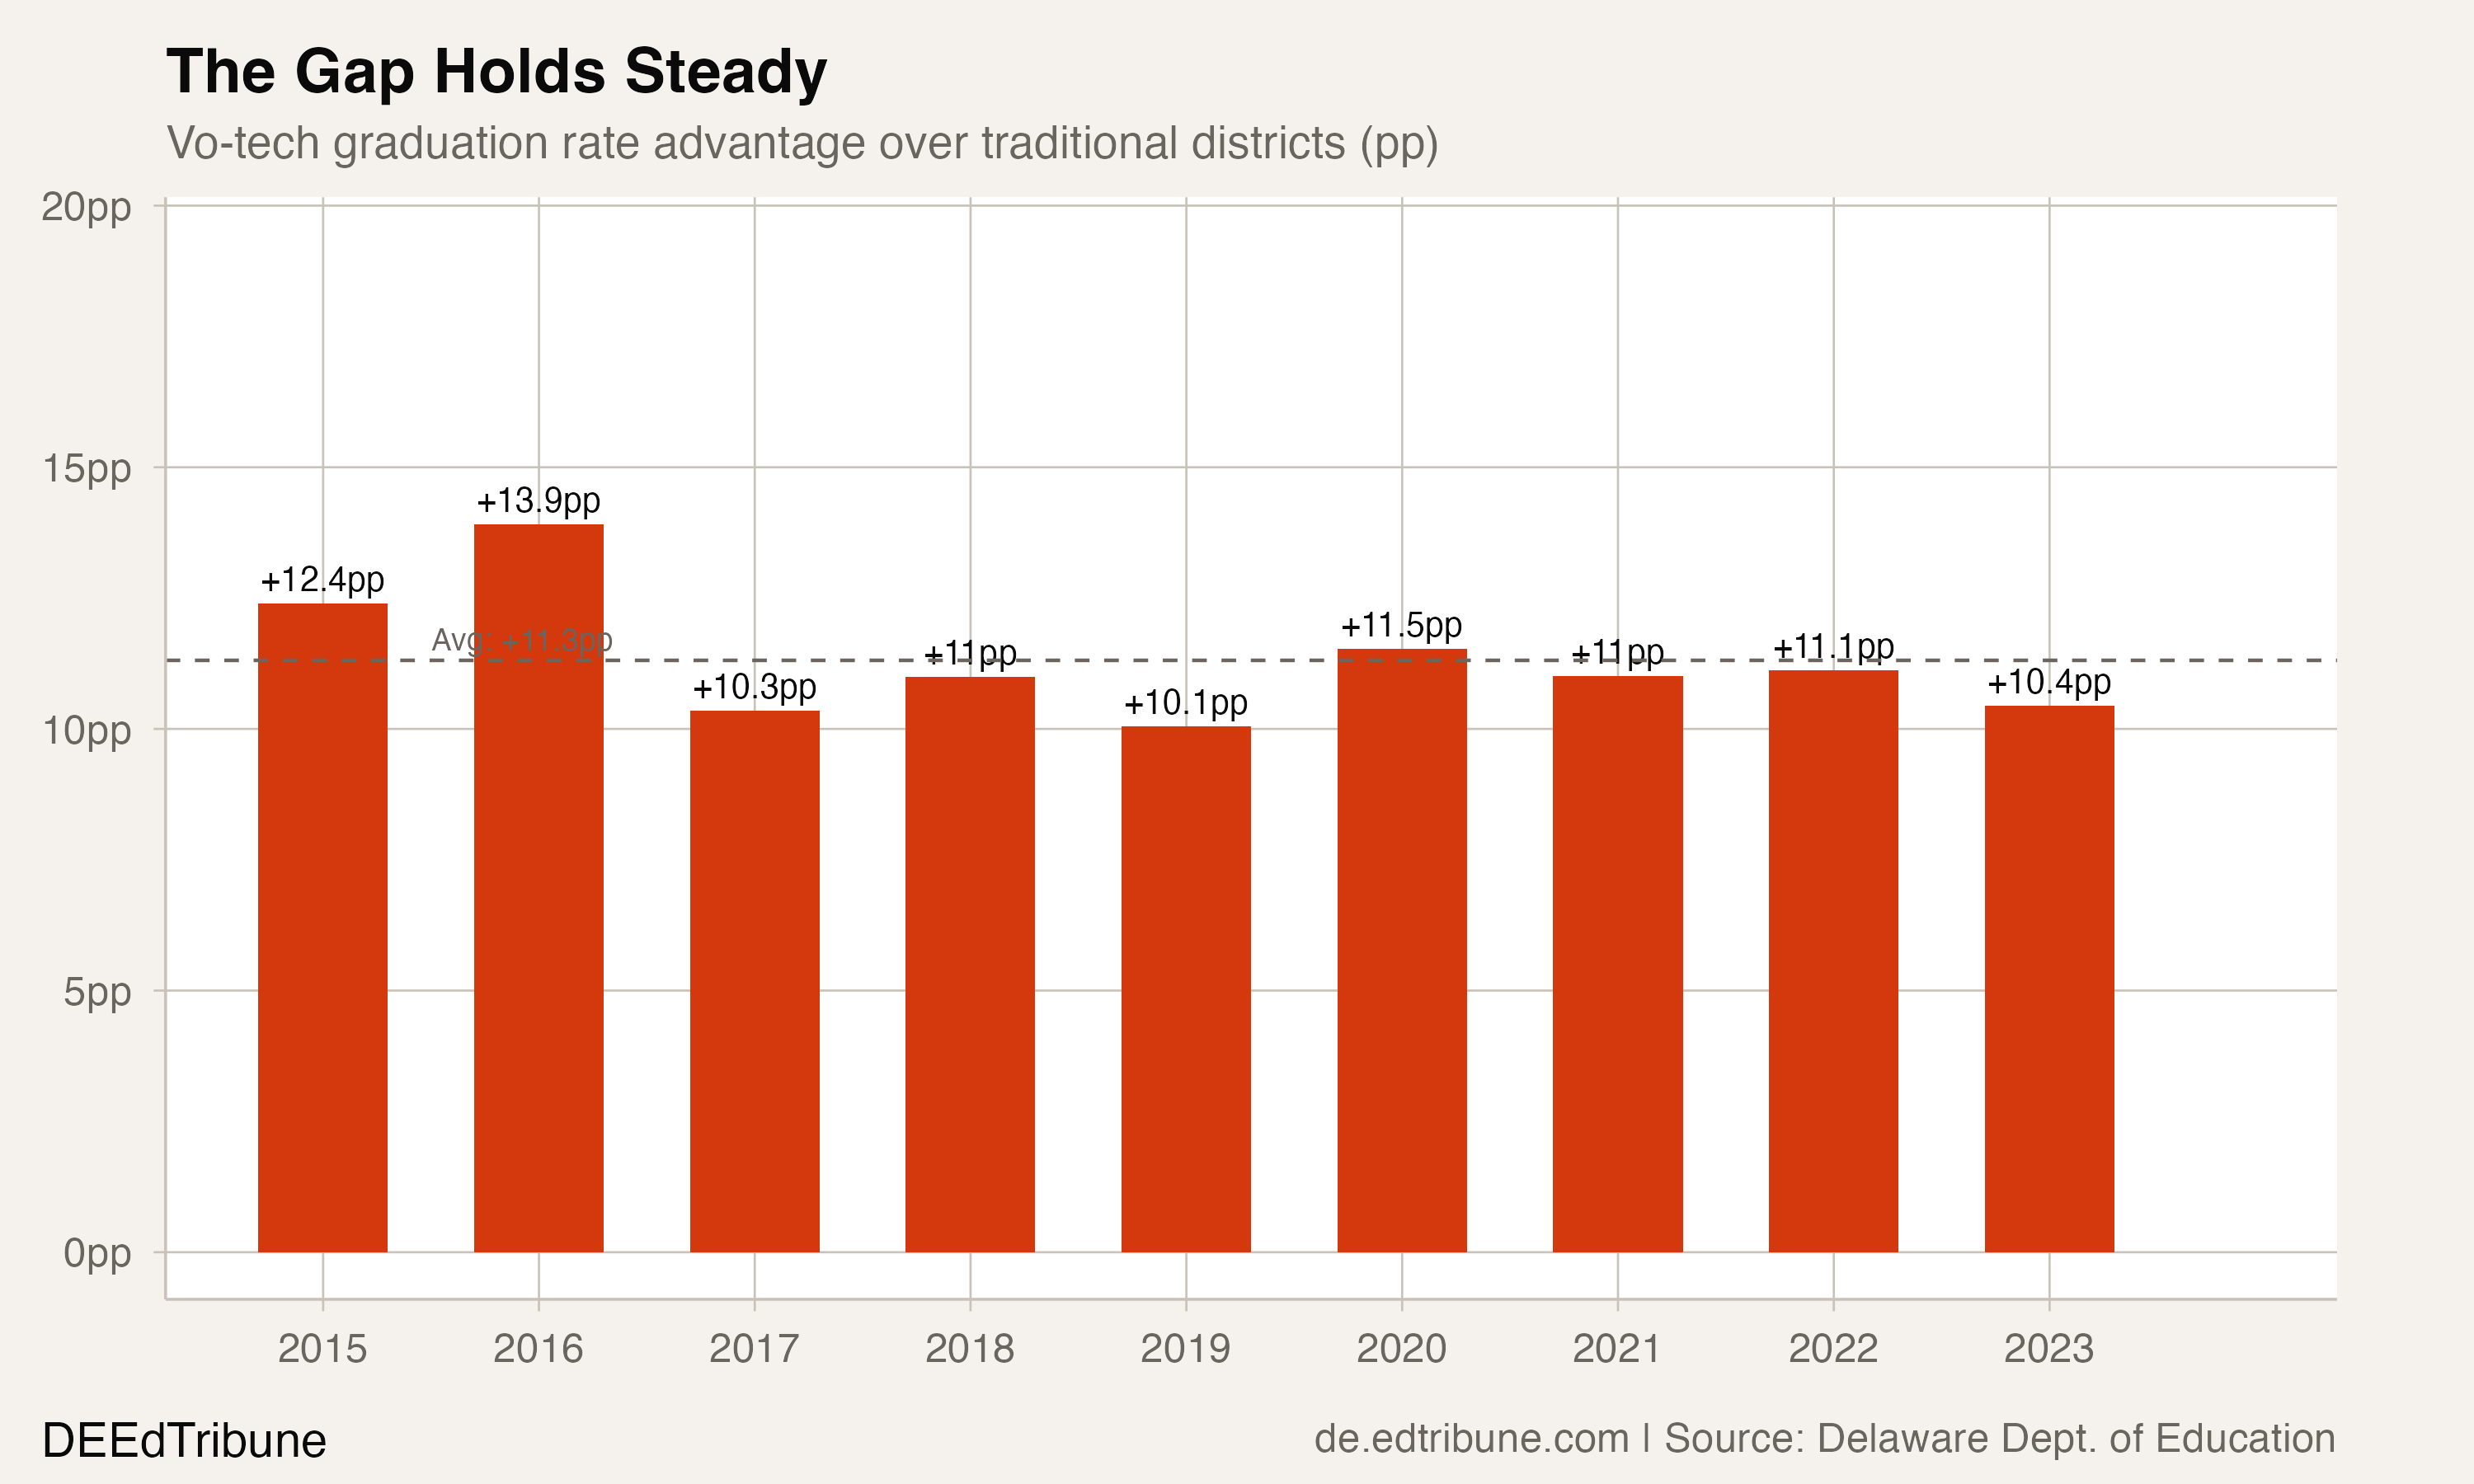
The gap itself has been remarkably stable, averaging 11.3 percentage points over the nine-year period. It narrowed slightly from a peak of 13.9 points in 2016 to 10.4 points in 2023, but even at its tightest, the vo-tech sector has never graduated fewer than 10 points above the traditional average.
Inside the numbers at NCC Vo-Tech
The most detailed subgroup data comes from NCC Vo-Tech, the largest of the three districts. Its numbers complicate a simple selection-effect explanation.
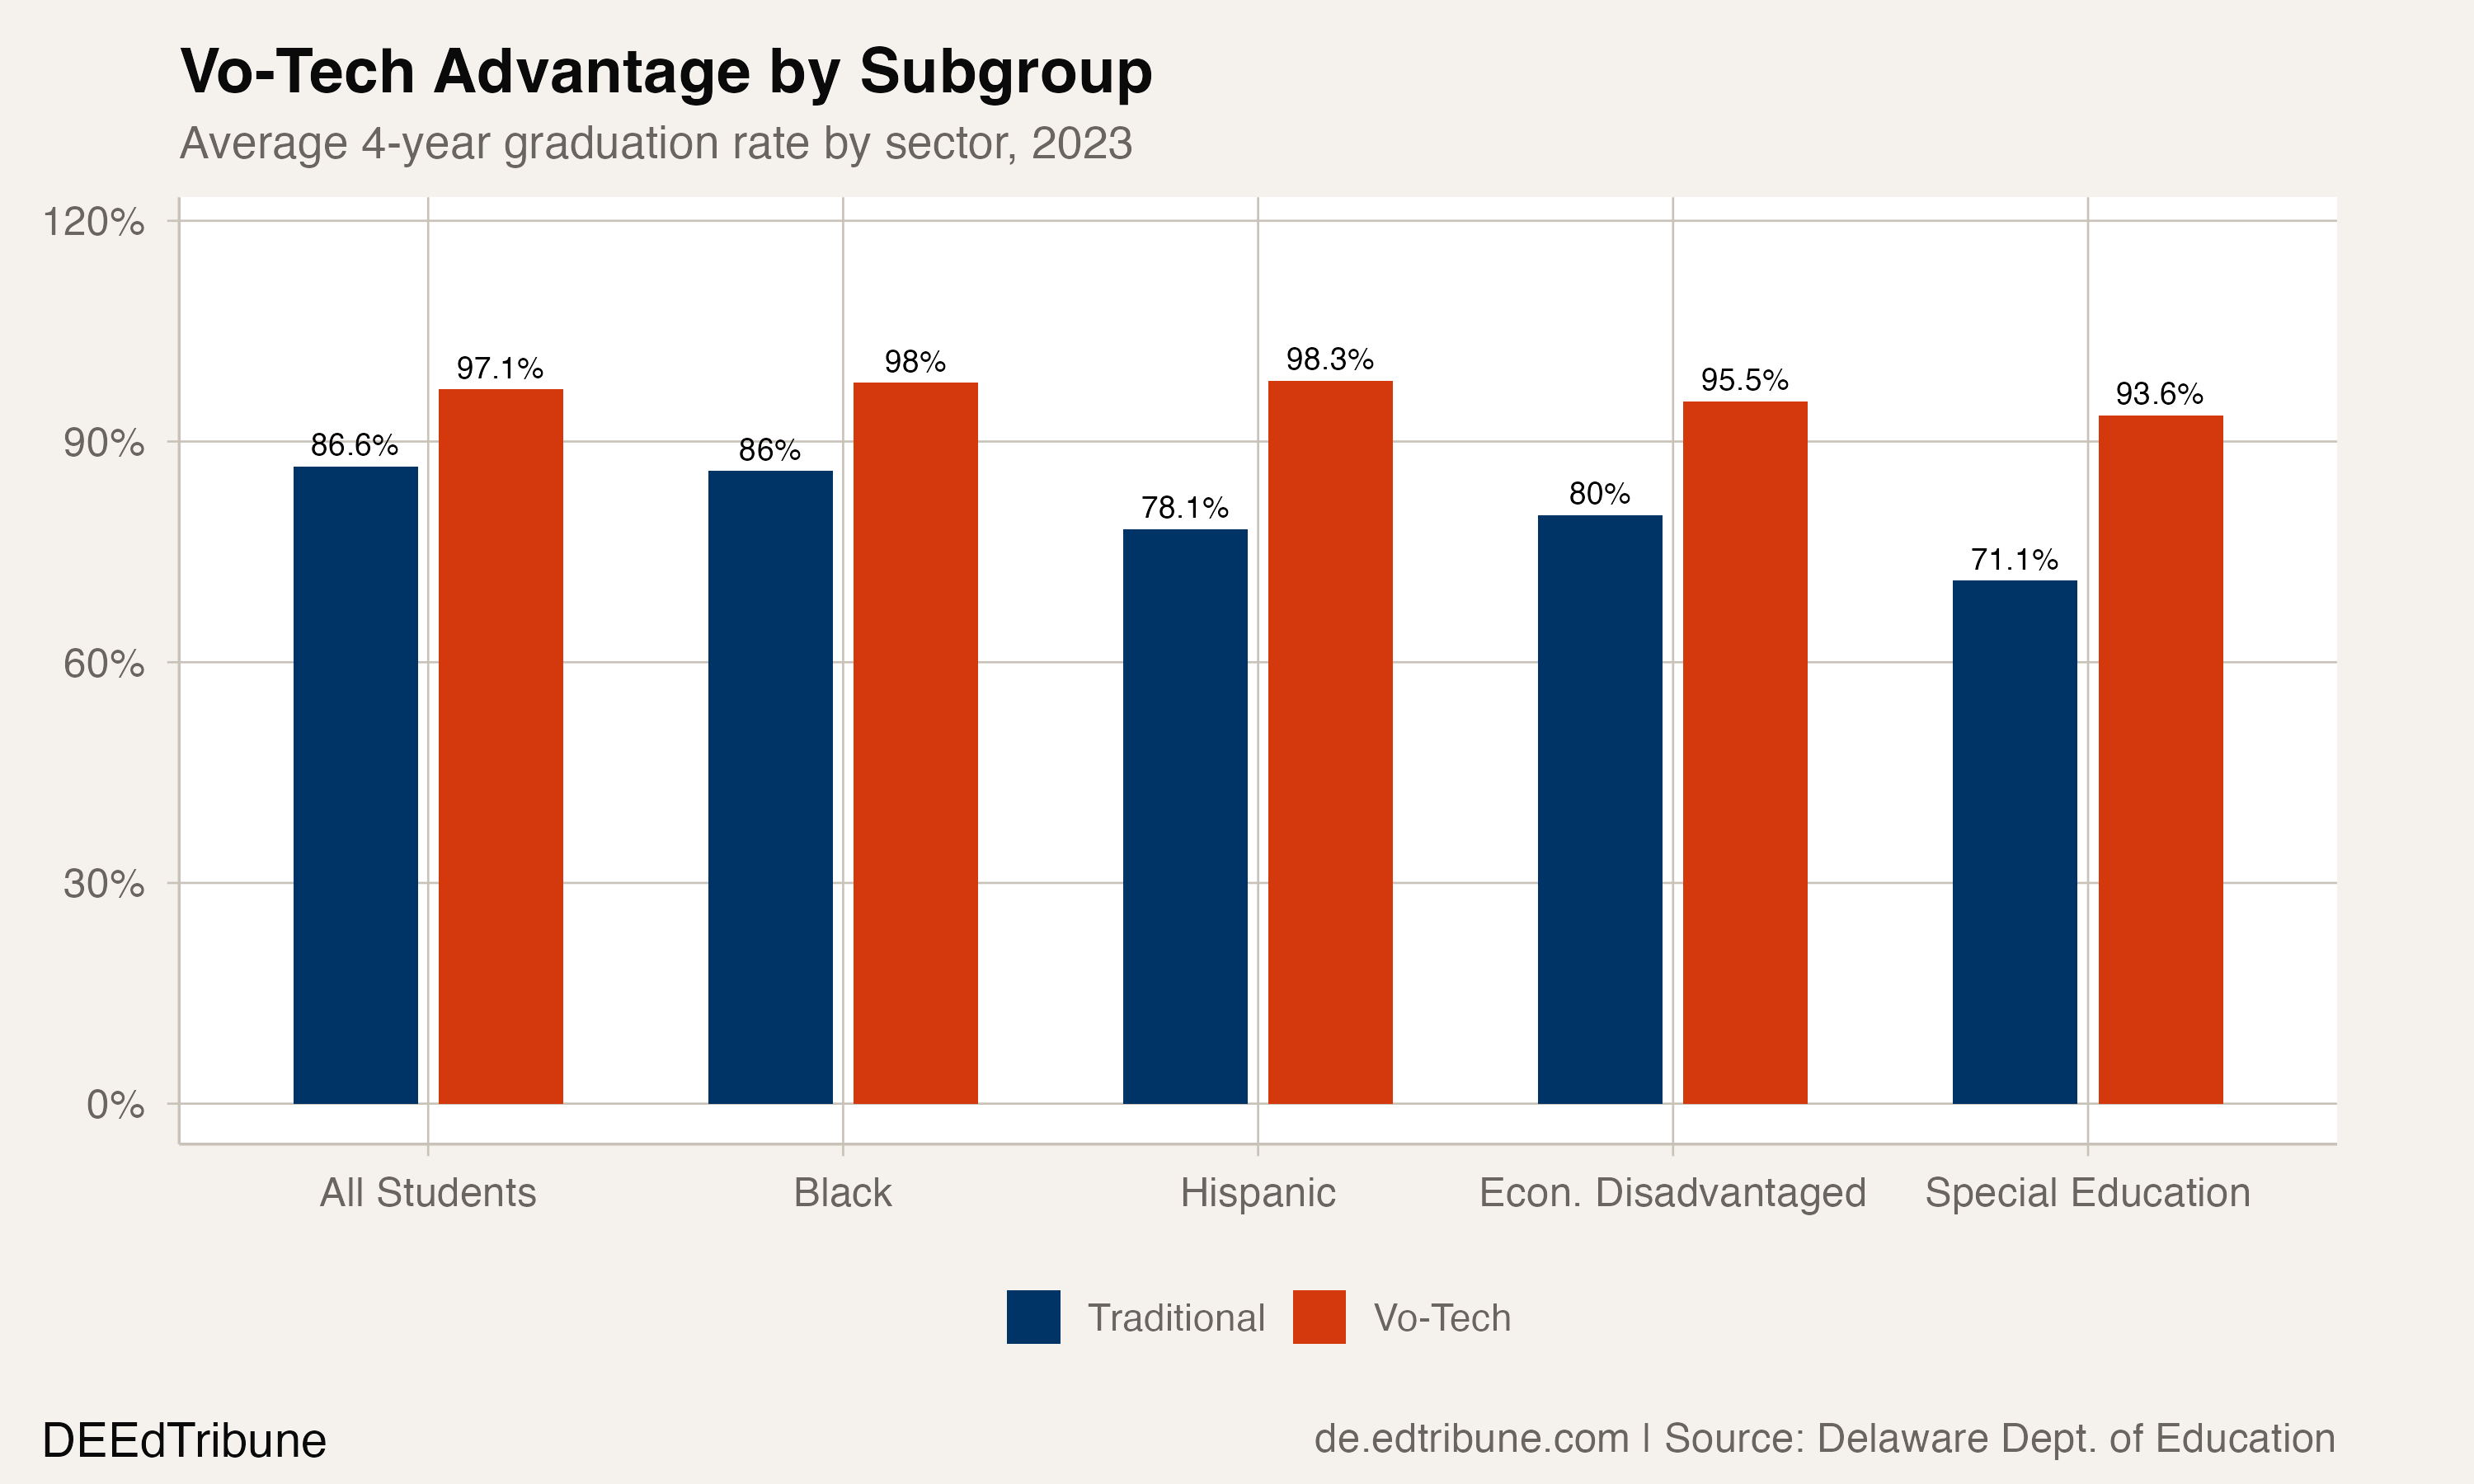
NCC Vo-Tech's Hispanic students graduated at 98.3% in 2023, compared to a 78.1% average across traditional districts. Its Black students graduated at 98.0%, versus 86.0% in traditional districts. And its economically disadvantaged students graduated at 95.5%, compared to a statewide rate of 81.6% for that subgroup.
The widest gap appears among students receiving special education services: 93.6% at NCC Vo-Tech versus a 71.1% average at traditional districts, a 22.5 percentage-point difference. The statewide special education graduation rate is 73.3%.
These are not small populations at NCC Vo-Tech. The district enrolls a majority-minority student body across its four high schools, including campuses like Hodgson Vo-Tech where 44% of students are Black and 19% are Hispanic. Statewide, 24.3% of CTE concentrators come from economically disadvantaged families, a lower share than the traditional district average but not negligible.
The selection question
The obvious explanation for a 10-point gap is that vo-tech districts enroll different students. This is partly true, and Delaware's own admissions structure makes the dynamic transparent.
Sussex Technical admits students through a random lottery managed by the state's Data Service Center. Each year, approximately 375 students are admitted from roughly double that number of applicants. NCC Vo-Tech uses an application process requiring report cards, attendance records, and discipline reports, with placement based on school and career program preferences.
The act of applying is itself a filter. A student who submits an application, gathers report cards, and ranks career programs has a family environment that supports that effort. Researchers call this "selection on motivation," and it can explain a portion of the gap without any program effect at all.
But research on CTE schools nationally suggests selection is not the whole story. A Brookings Institution review of the evidence found that a Massachusetts study using admissions cutoffs to isolate program effects showed large graduation impacts, particularly for low-income students: economically disadvantaged students were 32 percentage points more likely to graduate if they attended a regional vocational-technical school.
"Poor students are 32 percentage points more likely to graduate if they attend a RVTS," representing a 60% relative increase from a 50% baseline graduation rate. -- Brookings Institution, "What we know about Career and Technical Education in high school"
That study, by economist Shaun Dougherty, compared students just above and below the admissions threshold, a design that controls for the motivation to apply. The effect was largest for the students who would otherwise be least likely to graduate.
An IES-funded study examining 10 cohorts of Delaware students in CTE programs is underway at the University of Delaware, specifically analyzing whether technical high schools produce better outcomes than comprehensive schools after accounting for student characteristics. Its findings, covering school years 2010-11 through 2019-20, have not yet been published.
The landscape below the vo-tech line
The vo-tech numbers are striking partly because of what sits beneath them. Among Delaware's 16 traditional districts, the range spans from Appoquinimink↗ET at 95.4% to Christina at 73.2%.
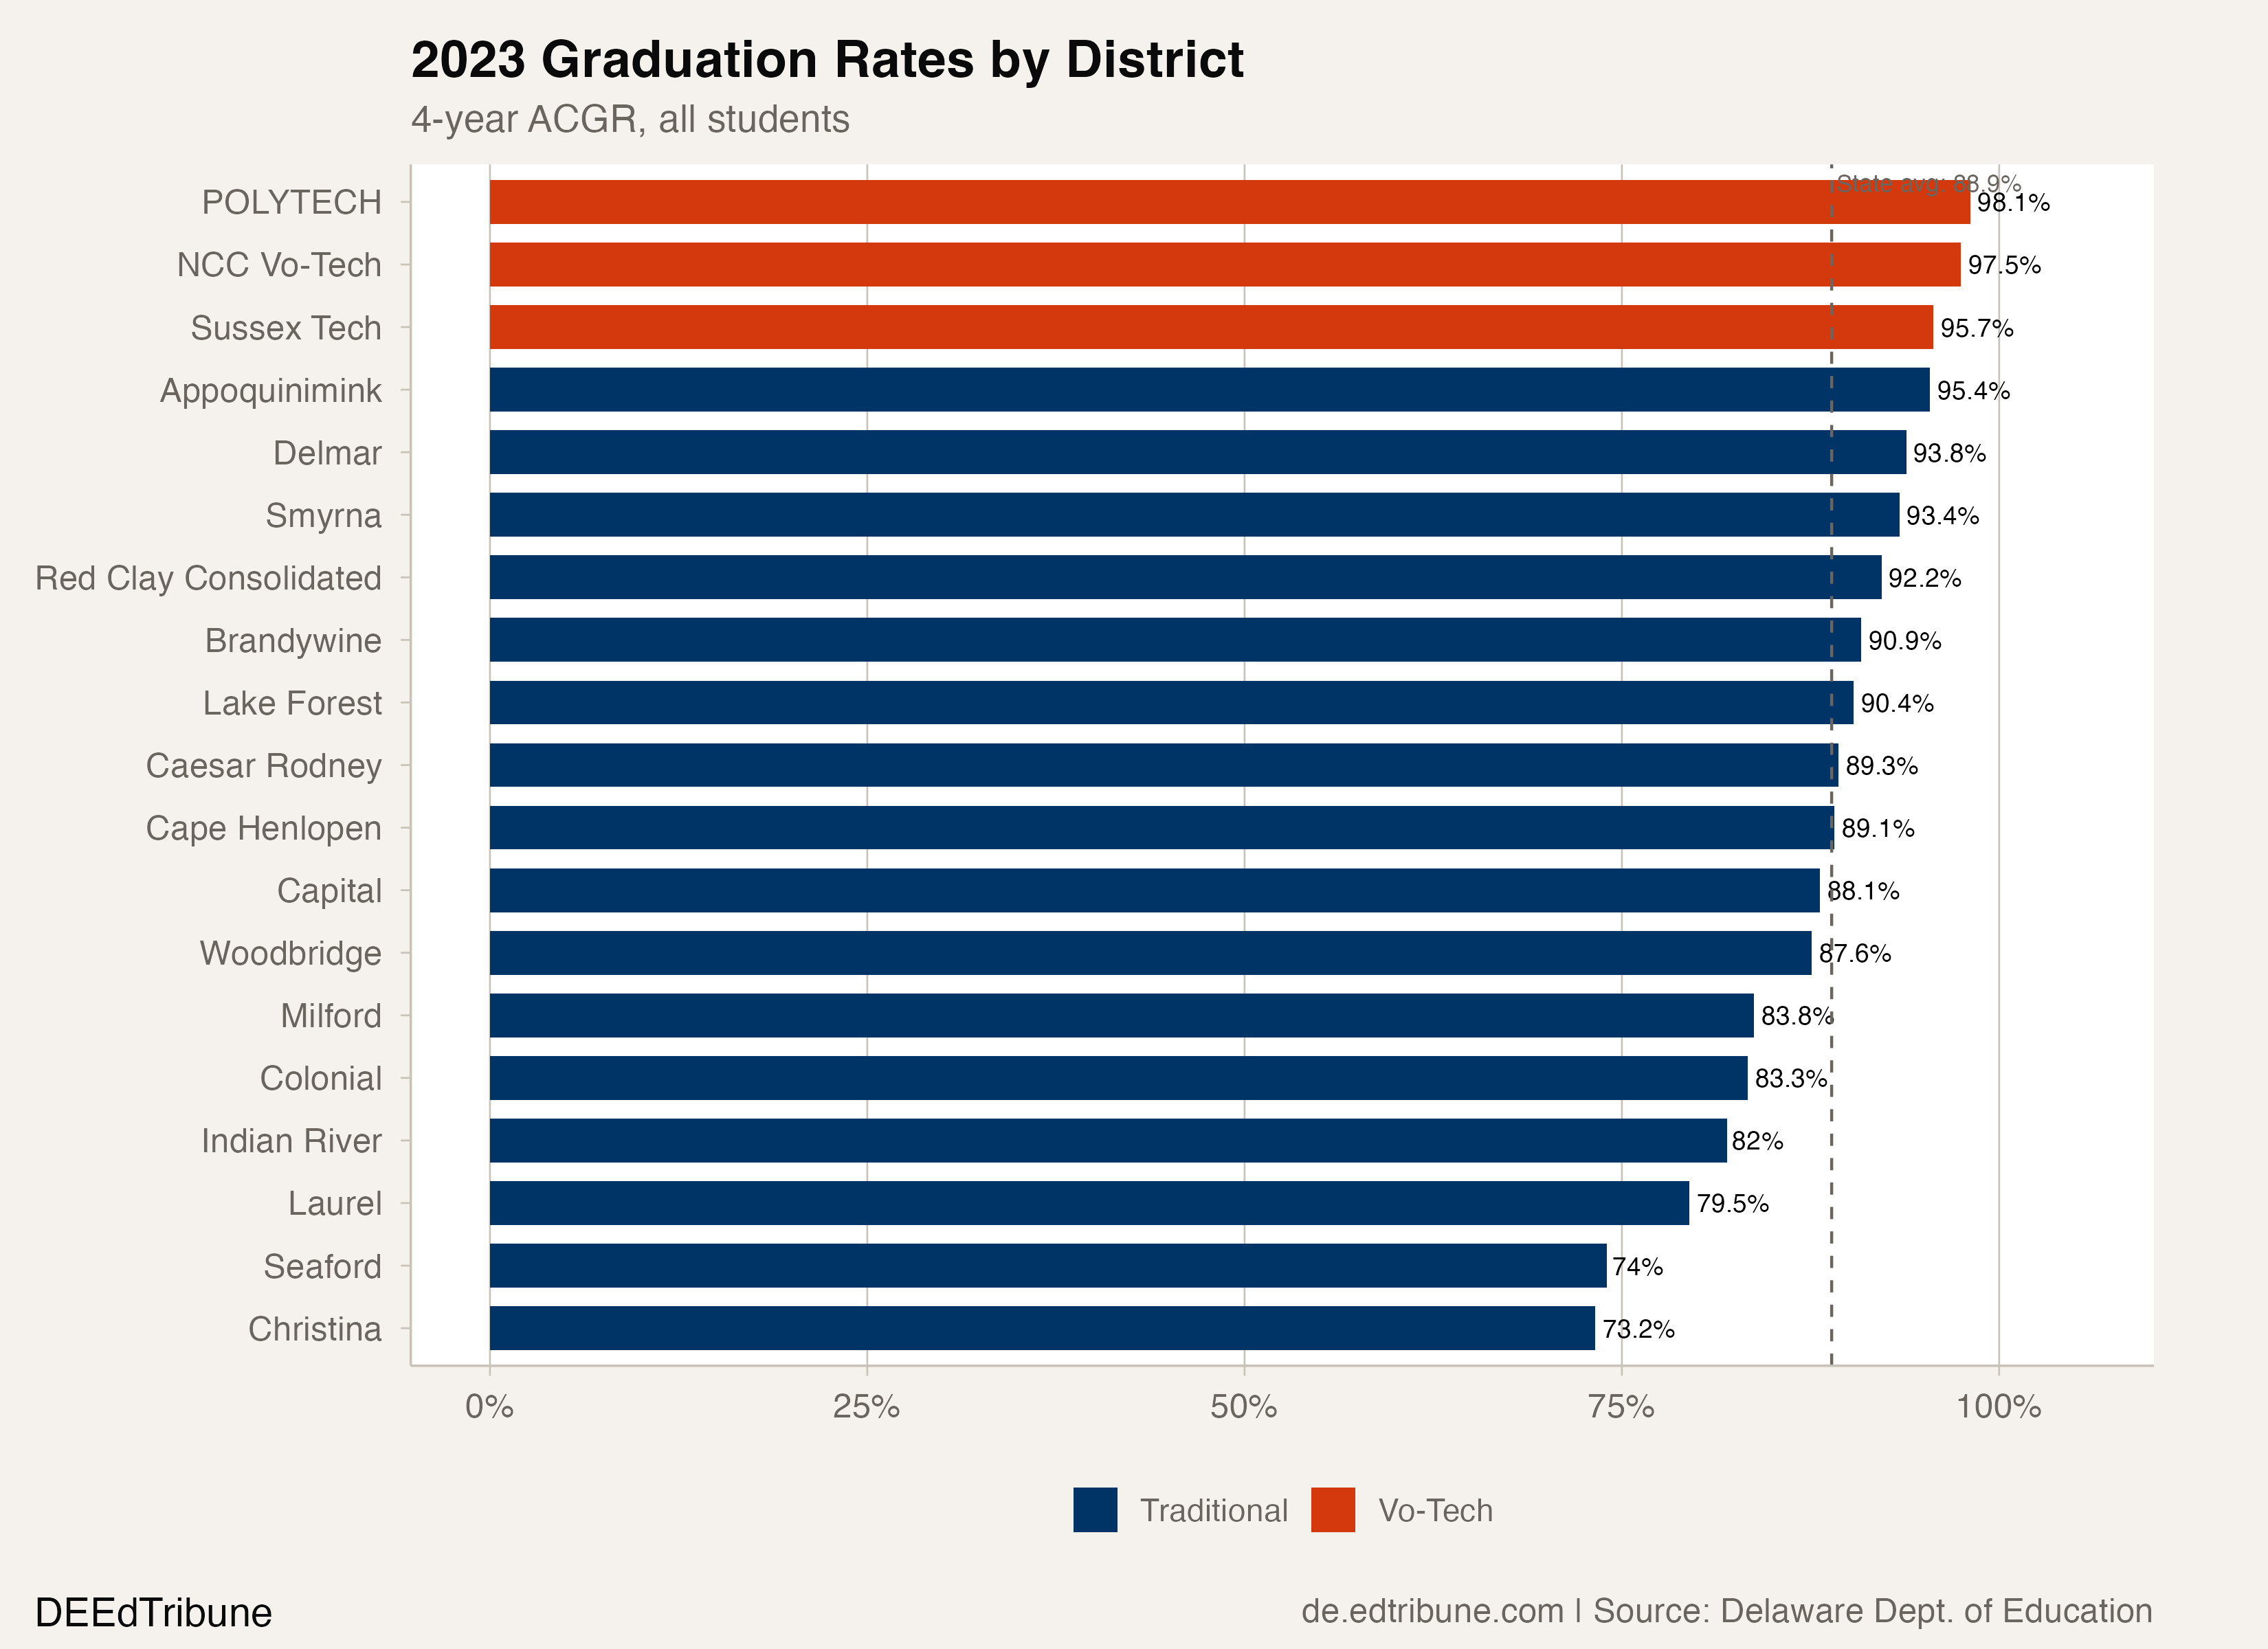
Christina has not exceeded 77% in any of the last nine years. Its 2022 rate of 67.2% was the lowest on record. Four of the five districts that serve Wilmington students, Brandywine, Christina, Colonial, and Red Clay, fall within the middle or lower half of the traditional distribution.
This geography is the context for the Redding Consortium's December 2025 vote recommending that those four districts merge into a single consolidated district serving over 45,000 students. The 19-2 vote cited "lingering issues around unequal allocation of resources, particularly between wealthier and poorer parts of the county." The consolidation plan's timeline has since slipped to 2027 at the earliest.
The vo-tech districts are not part of this consolidation conversation. They draw from across county lines, operate under separate governance, and are not subject to the Redding Consortium's jurisdiction. Their existence creates a structural dynamic: the highest-performing districts in each county are the ones that select their students, while the districts left holding the students who did not apply or were not placed absorb the consequences.
What the data cannot settle
The 10-point gap has been stable for nine years. That stability itself is informative: it has not widened as traditional districts improved from 83.7% to 86.6%, and it did not collapse during COVID's disruption. Whatever drives the difference appears to be structural, not cyclical.
The NCC Vo-Tech subgroup data, particularly the 95.5% economically disadvantaged rate and 93.6% special education rate, suggests that the program model contributes something beyond sorting. If selection alone explained the gap, one would expect it to shrink or vanish within subgroups that face the steepest graduation barriers. Instead, the gap widens: 10.4 points for all students, 15.5 points for students who are economically disadvantaged, 22.5 points for students with disabilities.
But the subgroup data is only available for NCC Vo-Tech. POLYTECH and Sussex Technical report NA for most subgroups, likely due to small cohort sizes triggering privacy suppression. Whether their economically disadvantaged or special education students graduate at similar rates is unknown.
The Delaware DOE's graduation data also cannot distinguish between students who entered a vo-tech district as ninth graders and those who transferred out before the cohort matured. If vo-tech districts shed struggling students back to their home districts before senior year, the graduation rate reflects the stayers, not the original cohort. The four-year adjusted cohort rate (ACGR) is designed to account for transfers, but the accuracy of that adjustment depends on how well districts track student movement.
A model or a mirror?
Delaware's General Assembly is weighing a consolidation plan for the state's most fragmented county while three vo-tech districts quietly post the highest completion rates in the state. The juxtaposition raises an uncomfortable policy question: whether Delaware's CTE model, which the state has invested $6.3 million in Perkins funding to support, succeeds because of its instructional approach or because its admissions structure lets it operate with a student body that traditional districts cannot replicate.
The IES study now underway at the University of Delaware may provide answers. Until it does, the 10-point gap will continue to function as a Rorschach test: evidence of a model worth replicating, or evidence of a system that sorts students before it teaches them.
Detailed code that reproduces the analysis and figures in this article is available exclusively to EdTribune subscribers.
Discussion
Sign in to join the discussion.
Loading comments...