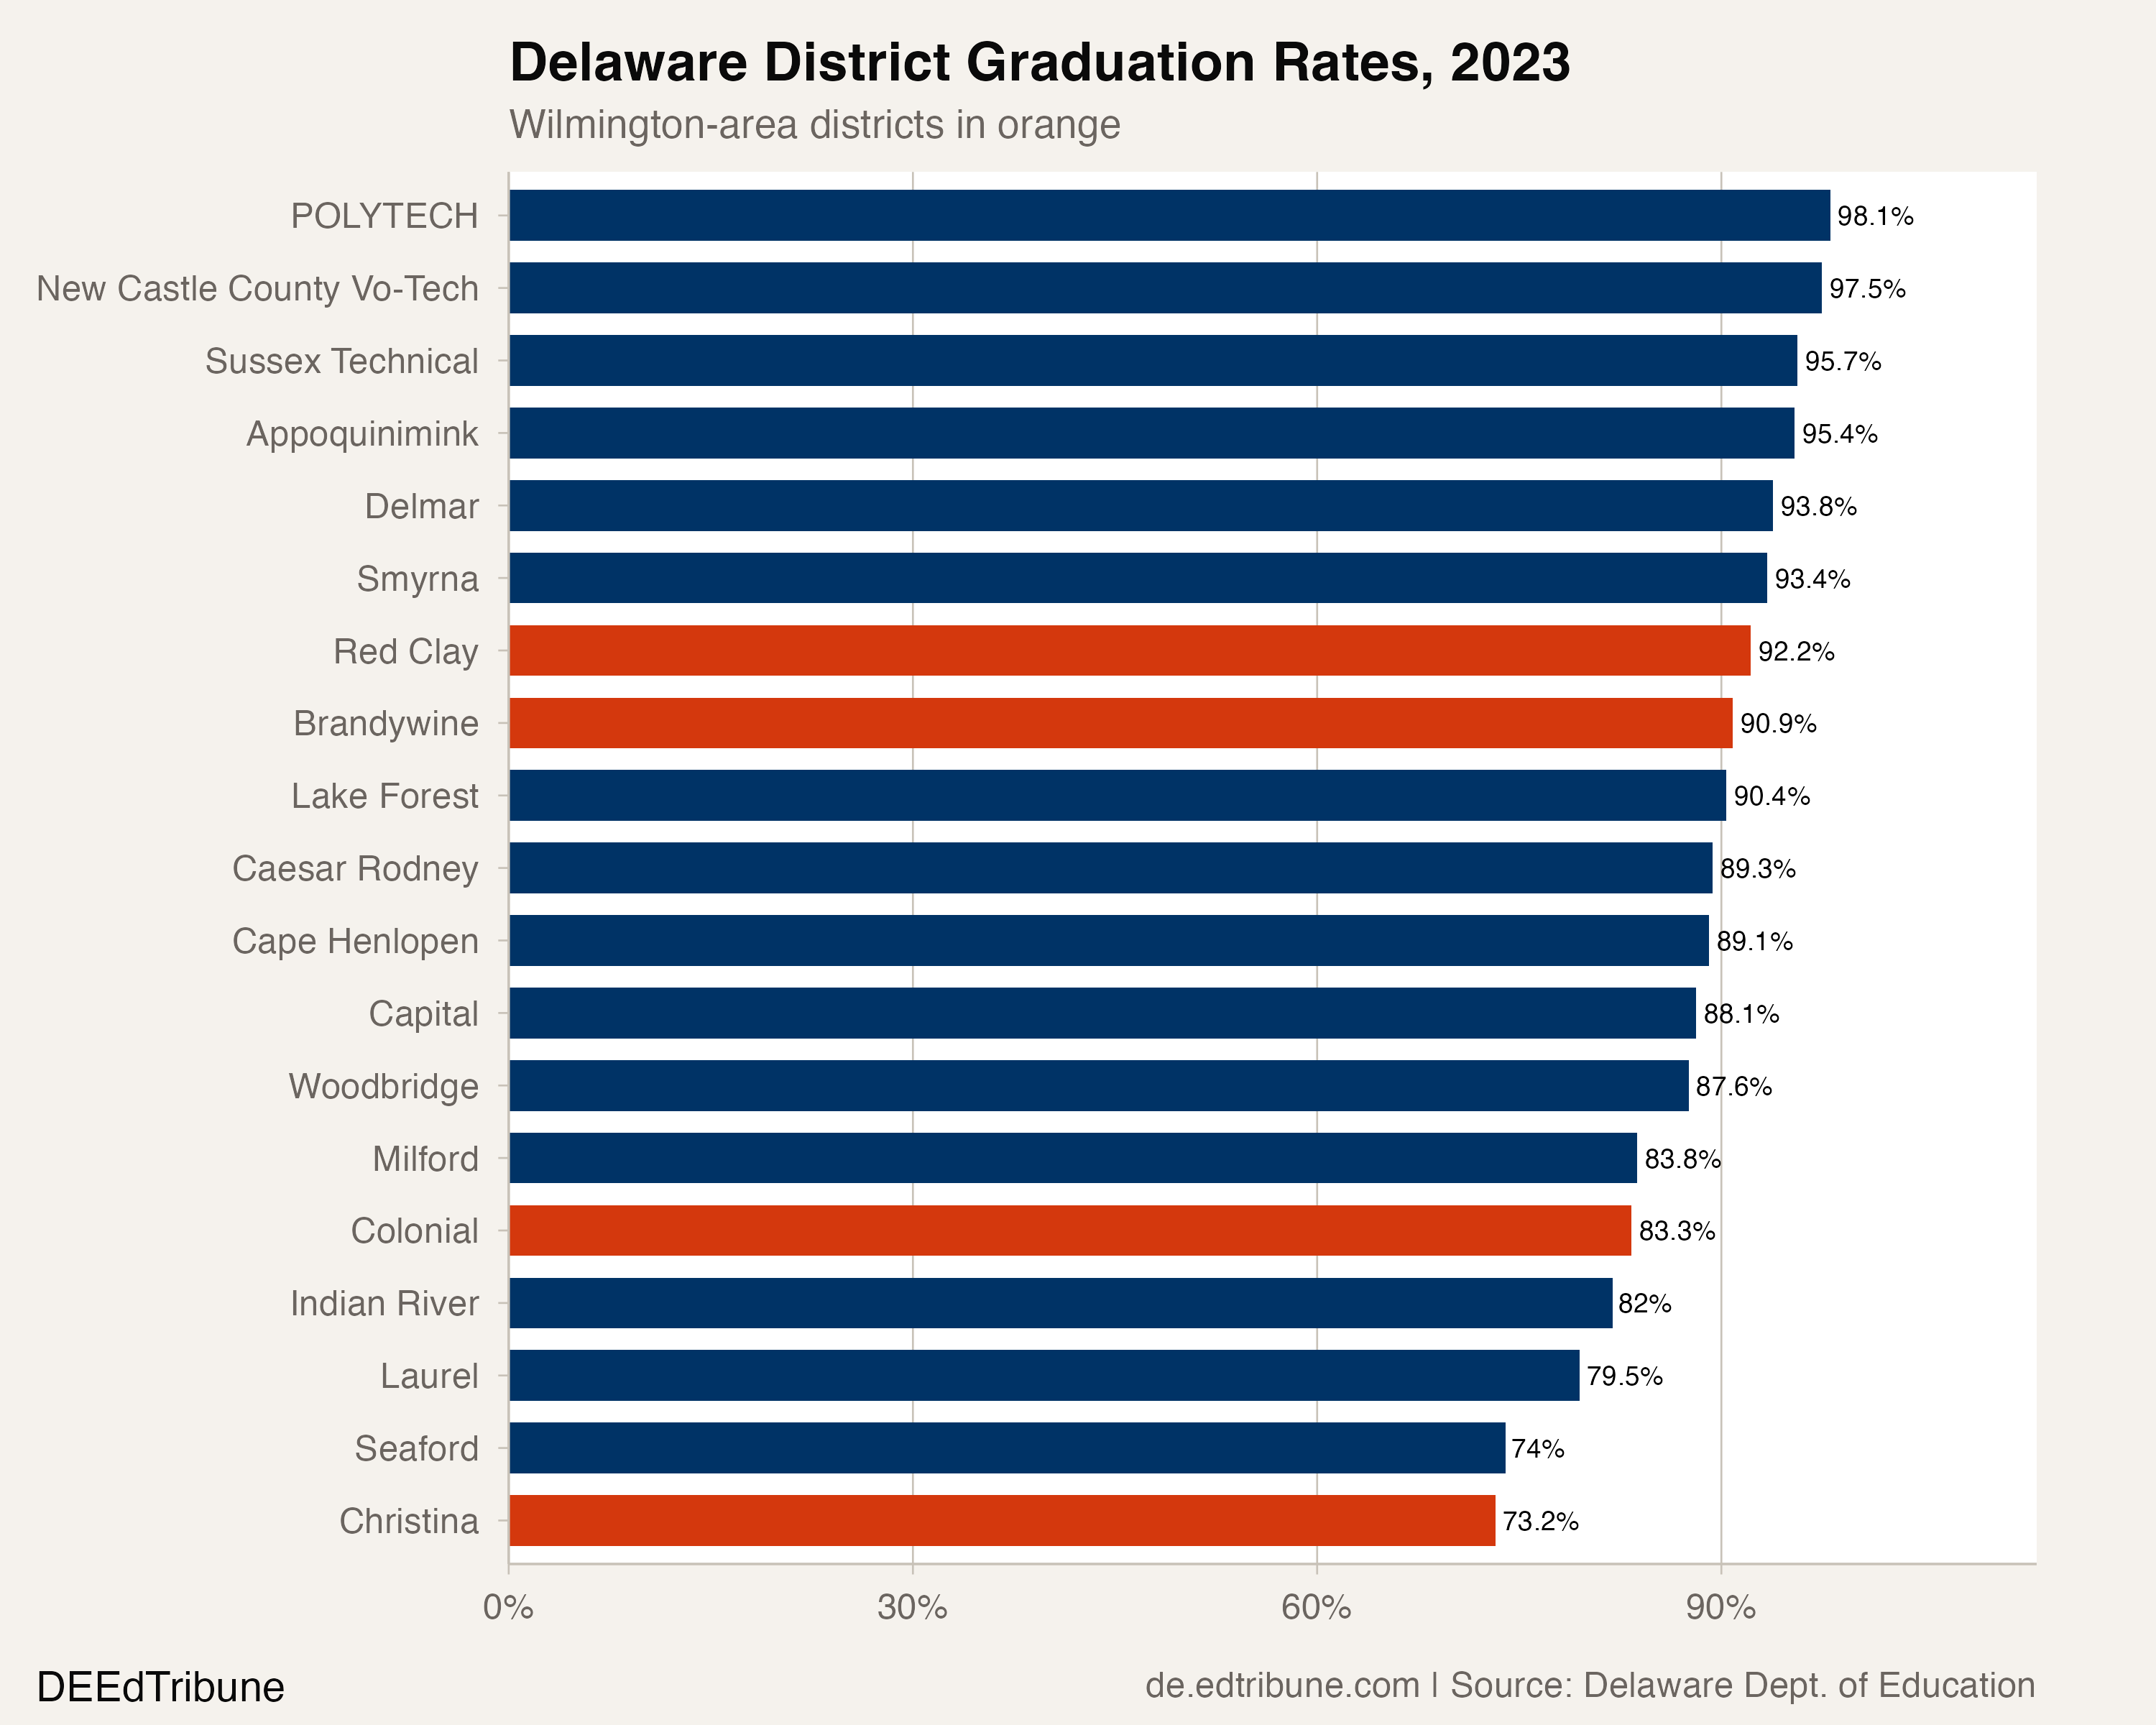
A student growing up in Wilmington will attend one of four school districts, depending on which side of a line drawn in 1981 their house falls on. In 2023, a senior in Red Clay↗ET had a 92.2% chance of graduating. A senior in Christina↗ET, potentially living blocks away, had a 73.2% chance. The gap between the best and worst outcomes within a single city: 19.0 percentage points.
Christina's 73.2% graduation rate is the lowest of any traditional district in Delaware. It sits dead last among all 19 districts, including the three vocational-technical systems that graduate above 95%. Red Clay, which shares Wilmington's western neighborhoods, ranks seventh statewide. Brandywine↗ET (90.9%) and Colonial↗ET (83.3%) fall in between. Four districts, one city, four different probabilities of finishing high school.
The architecture of a 40-year-old line
The four-district structure dates to 1981, when Delaware lawmakers carved New Castle County into separate systems after a federal desegregation order. Each district was assigned a slice of Wilmington plus a stretch of suburban and rural territory reaching from the Pennsylvania border to the C&D Canal. The court-ordered busing that prompted the arrangement ended in 2000, but the district boundaries did not move.
The result is a governance arrangement where approximately 1,600 Wilmington students attend schools administered by districts whose high schools may sit 15 miles away in Glasgow. The boundary lines were drawn for desegregation logistics, not educational coherence. And the outcomes they produce have diverged steadily.
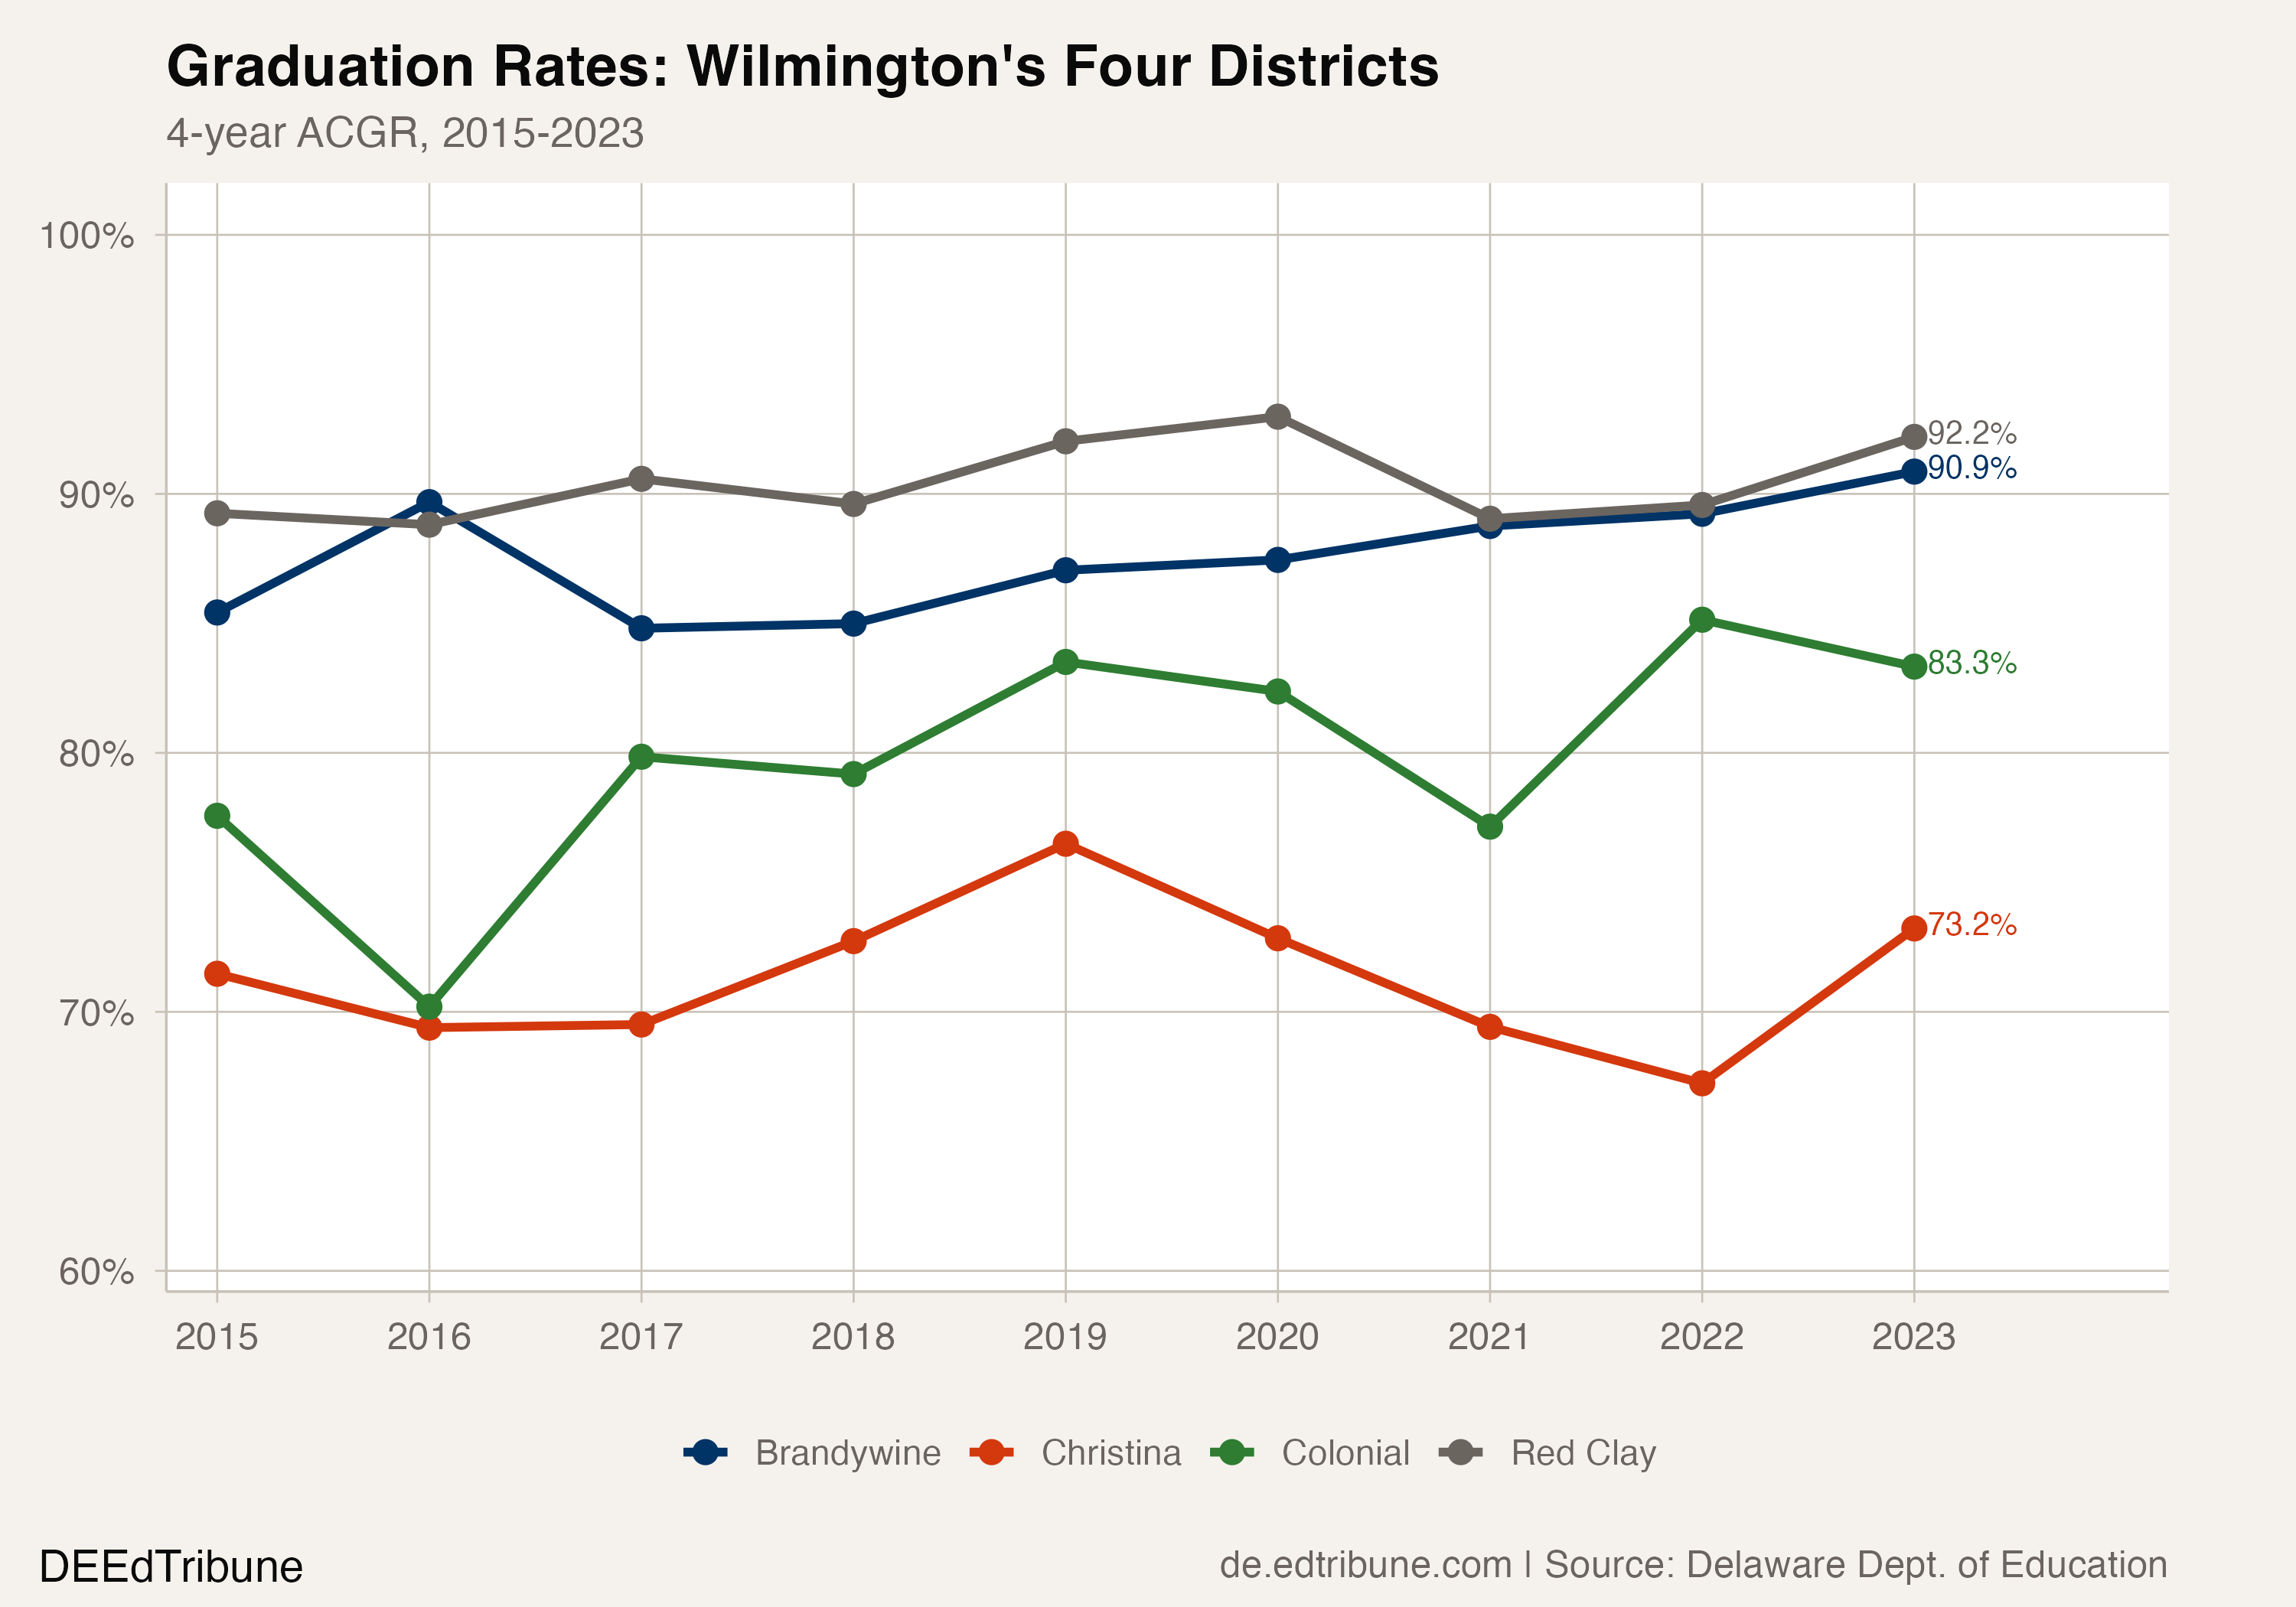
Between 2015 and 2023, the Red Clay-Christina gap never dropped below 15.5 points and peaked at 22.3 points in 2022, when Christina hit a low of 67.2%. Colonial swings the most year to year, ranging from 70.2% in 2016 to 85.1% in 2022. Brandywine has been the steadiest climber, rising 5.4 points from 85.4% to 90.9% across the nine-year window. Red Clay has hovered near 90% the entire period, touching 93.0% in 2020.
The statewide graduation rate reached 88.9% in 2023. Red Clay and Brandywine exceed it. Colonial trails it by 5.6 points. Christina trails it by 15.7 points.
Where the gap hits hardest
The racial dimension of the divide is difficult to separate from the structural one. Black students make up about 52% of Colonial's graduating cohort, 45% of Christina's, 41% of Brandywine's, and 23% of Red Clay's. But the disparities in outcomes are not explained by demography alone.
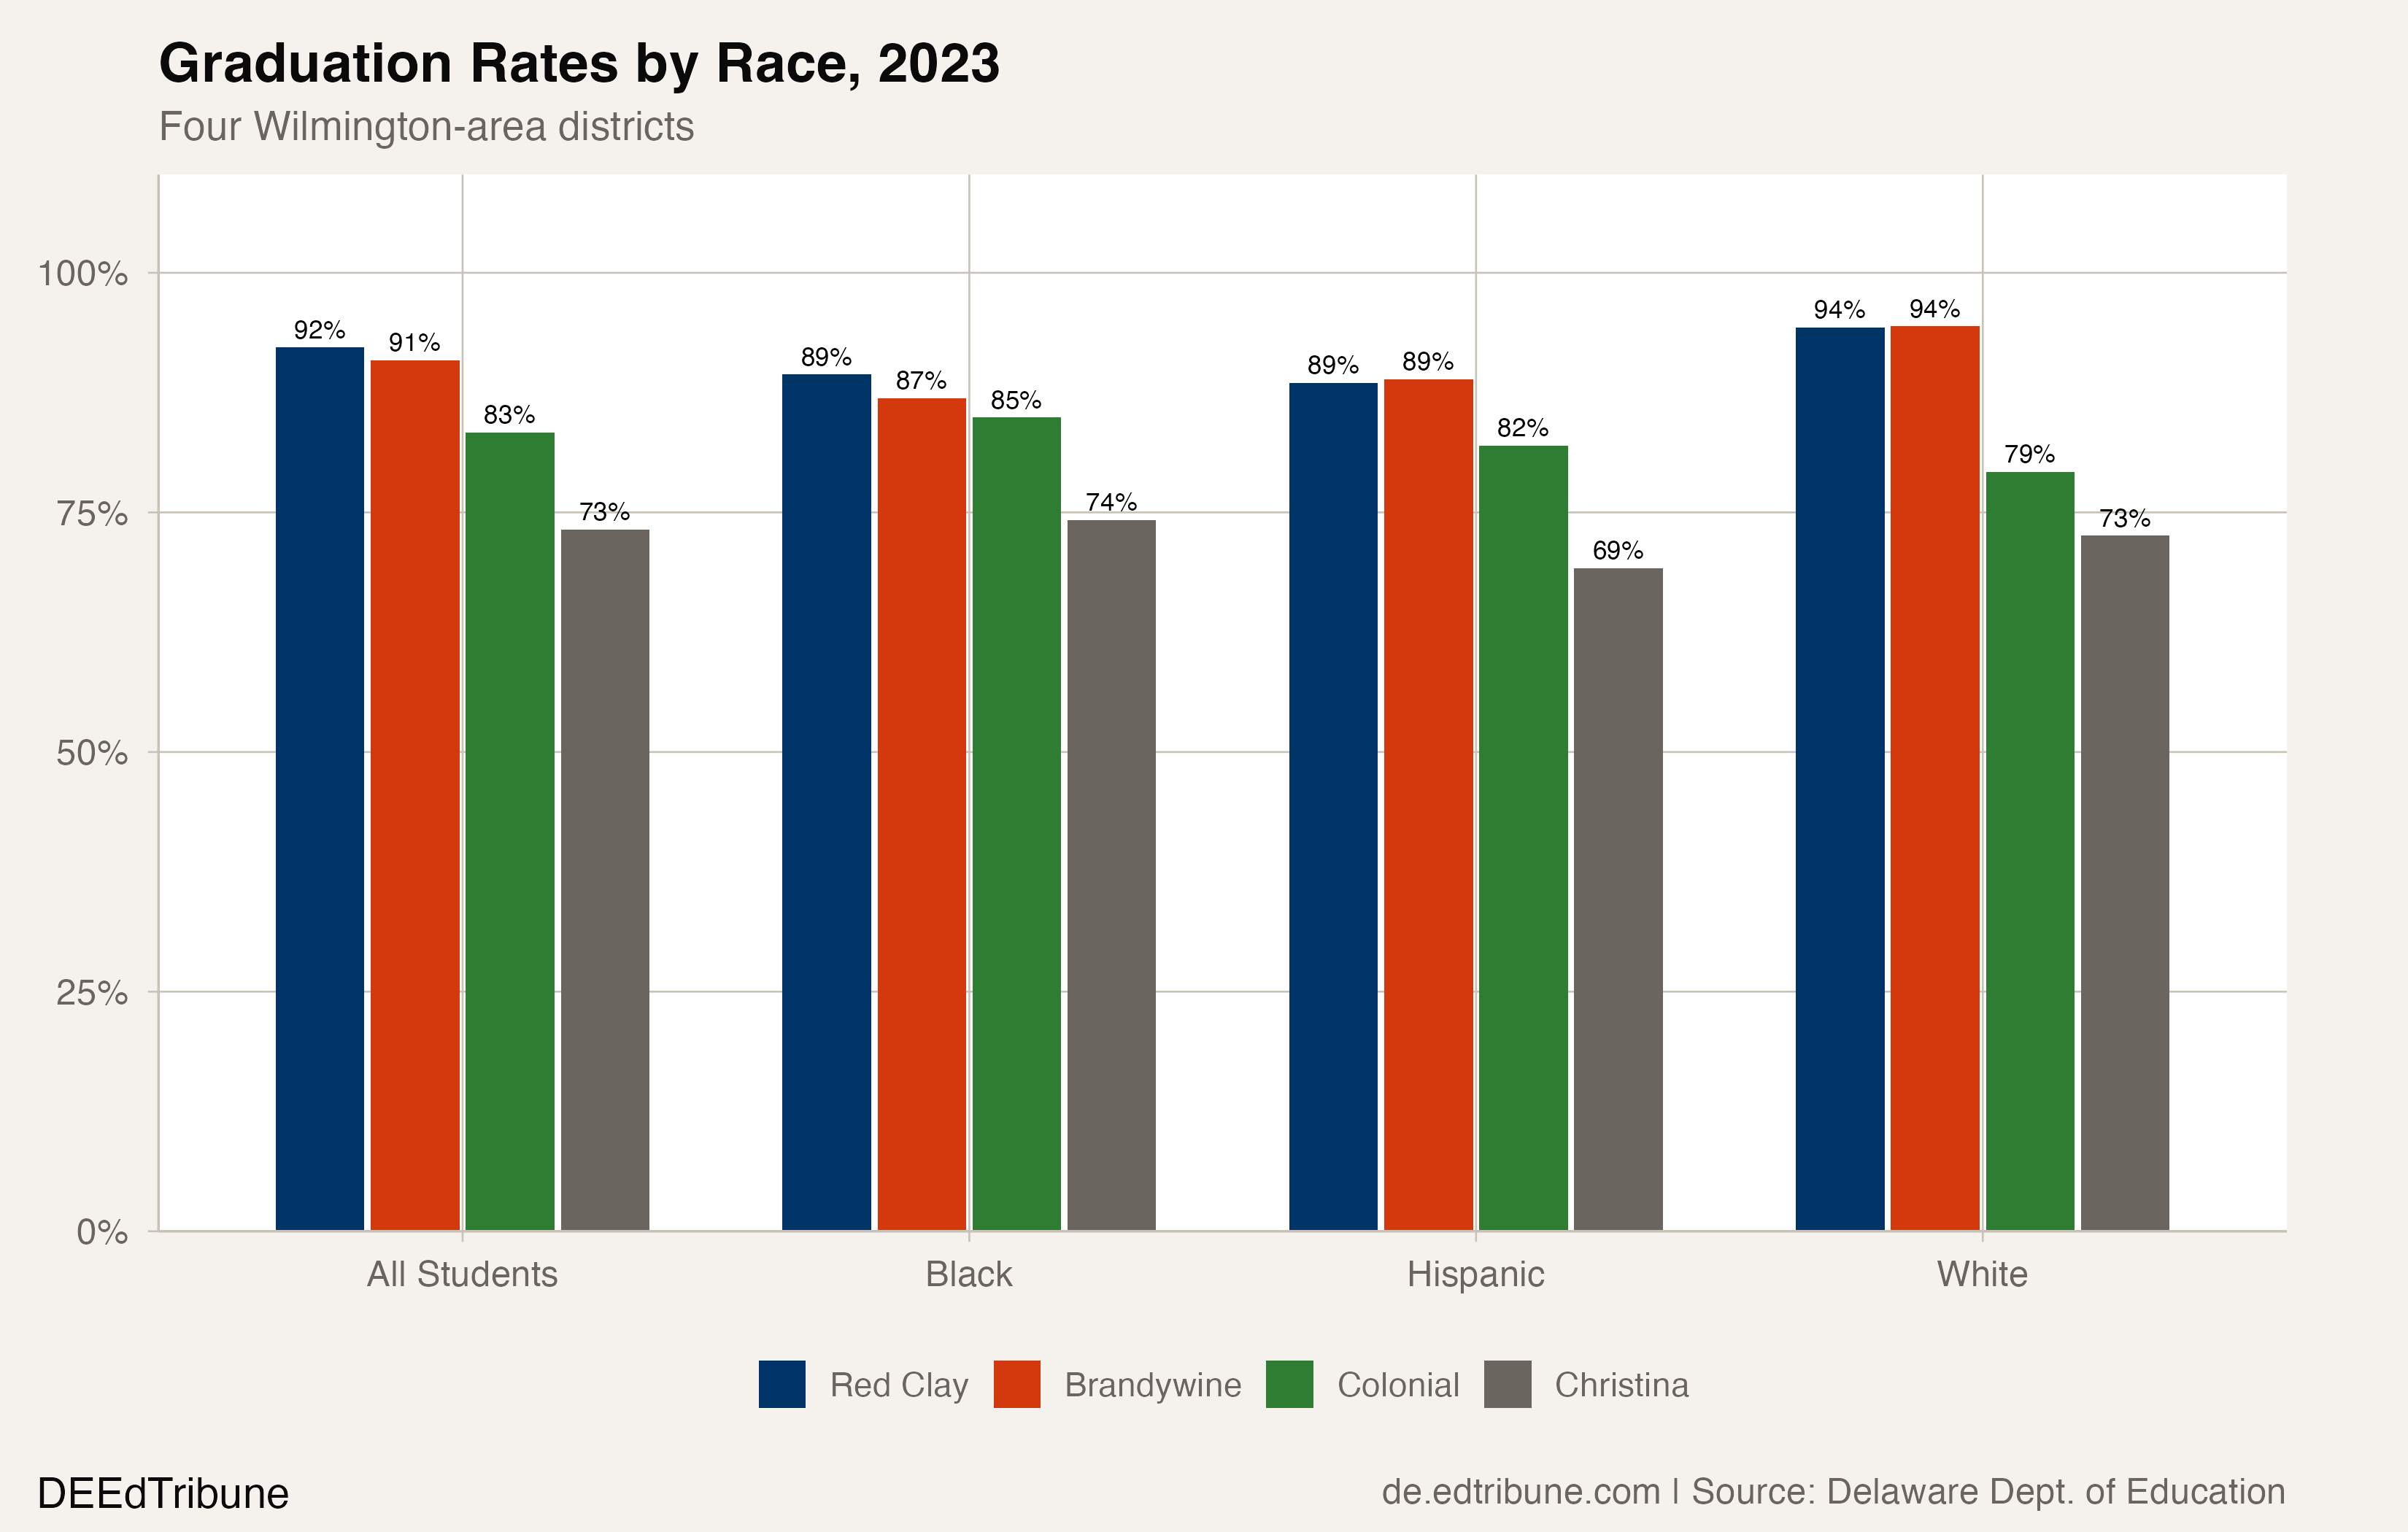
In 2023, Red Clay graduated 89.4% of its Black students. Brandywine graduated 86.9%. Colonial graduated 84.9%. Christina graduated 74.2%. The gap between Red Clay's and Christina's Black graduation rates is 15.2 percentage points, for students living in the same metropolitan area.
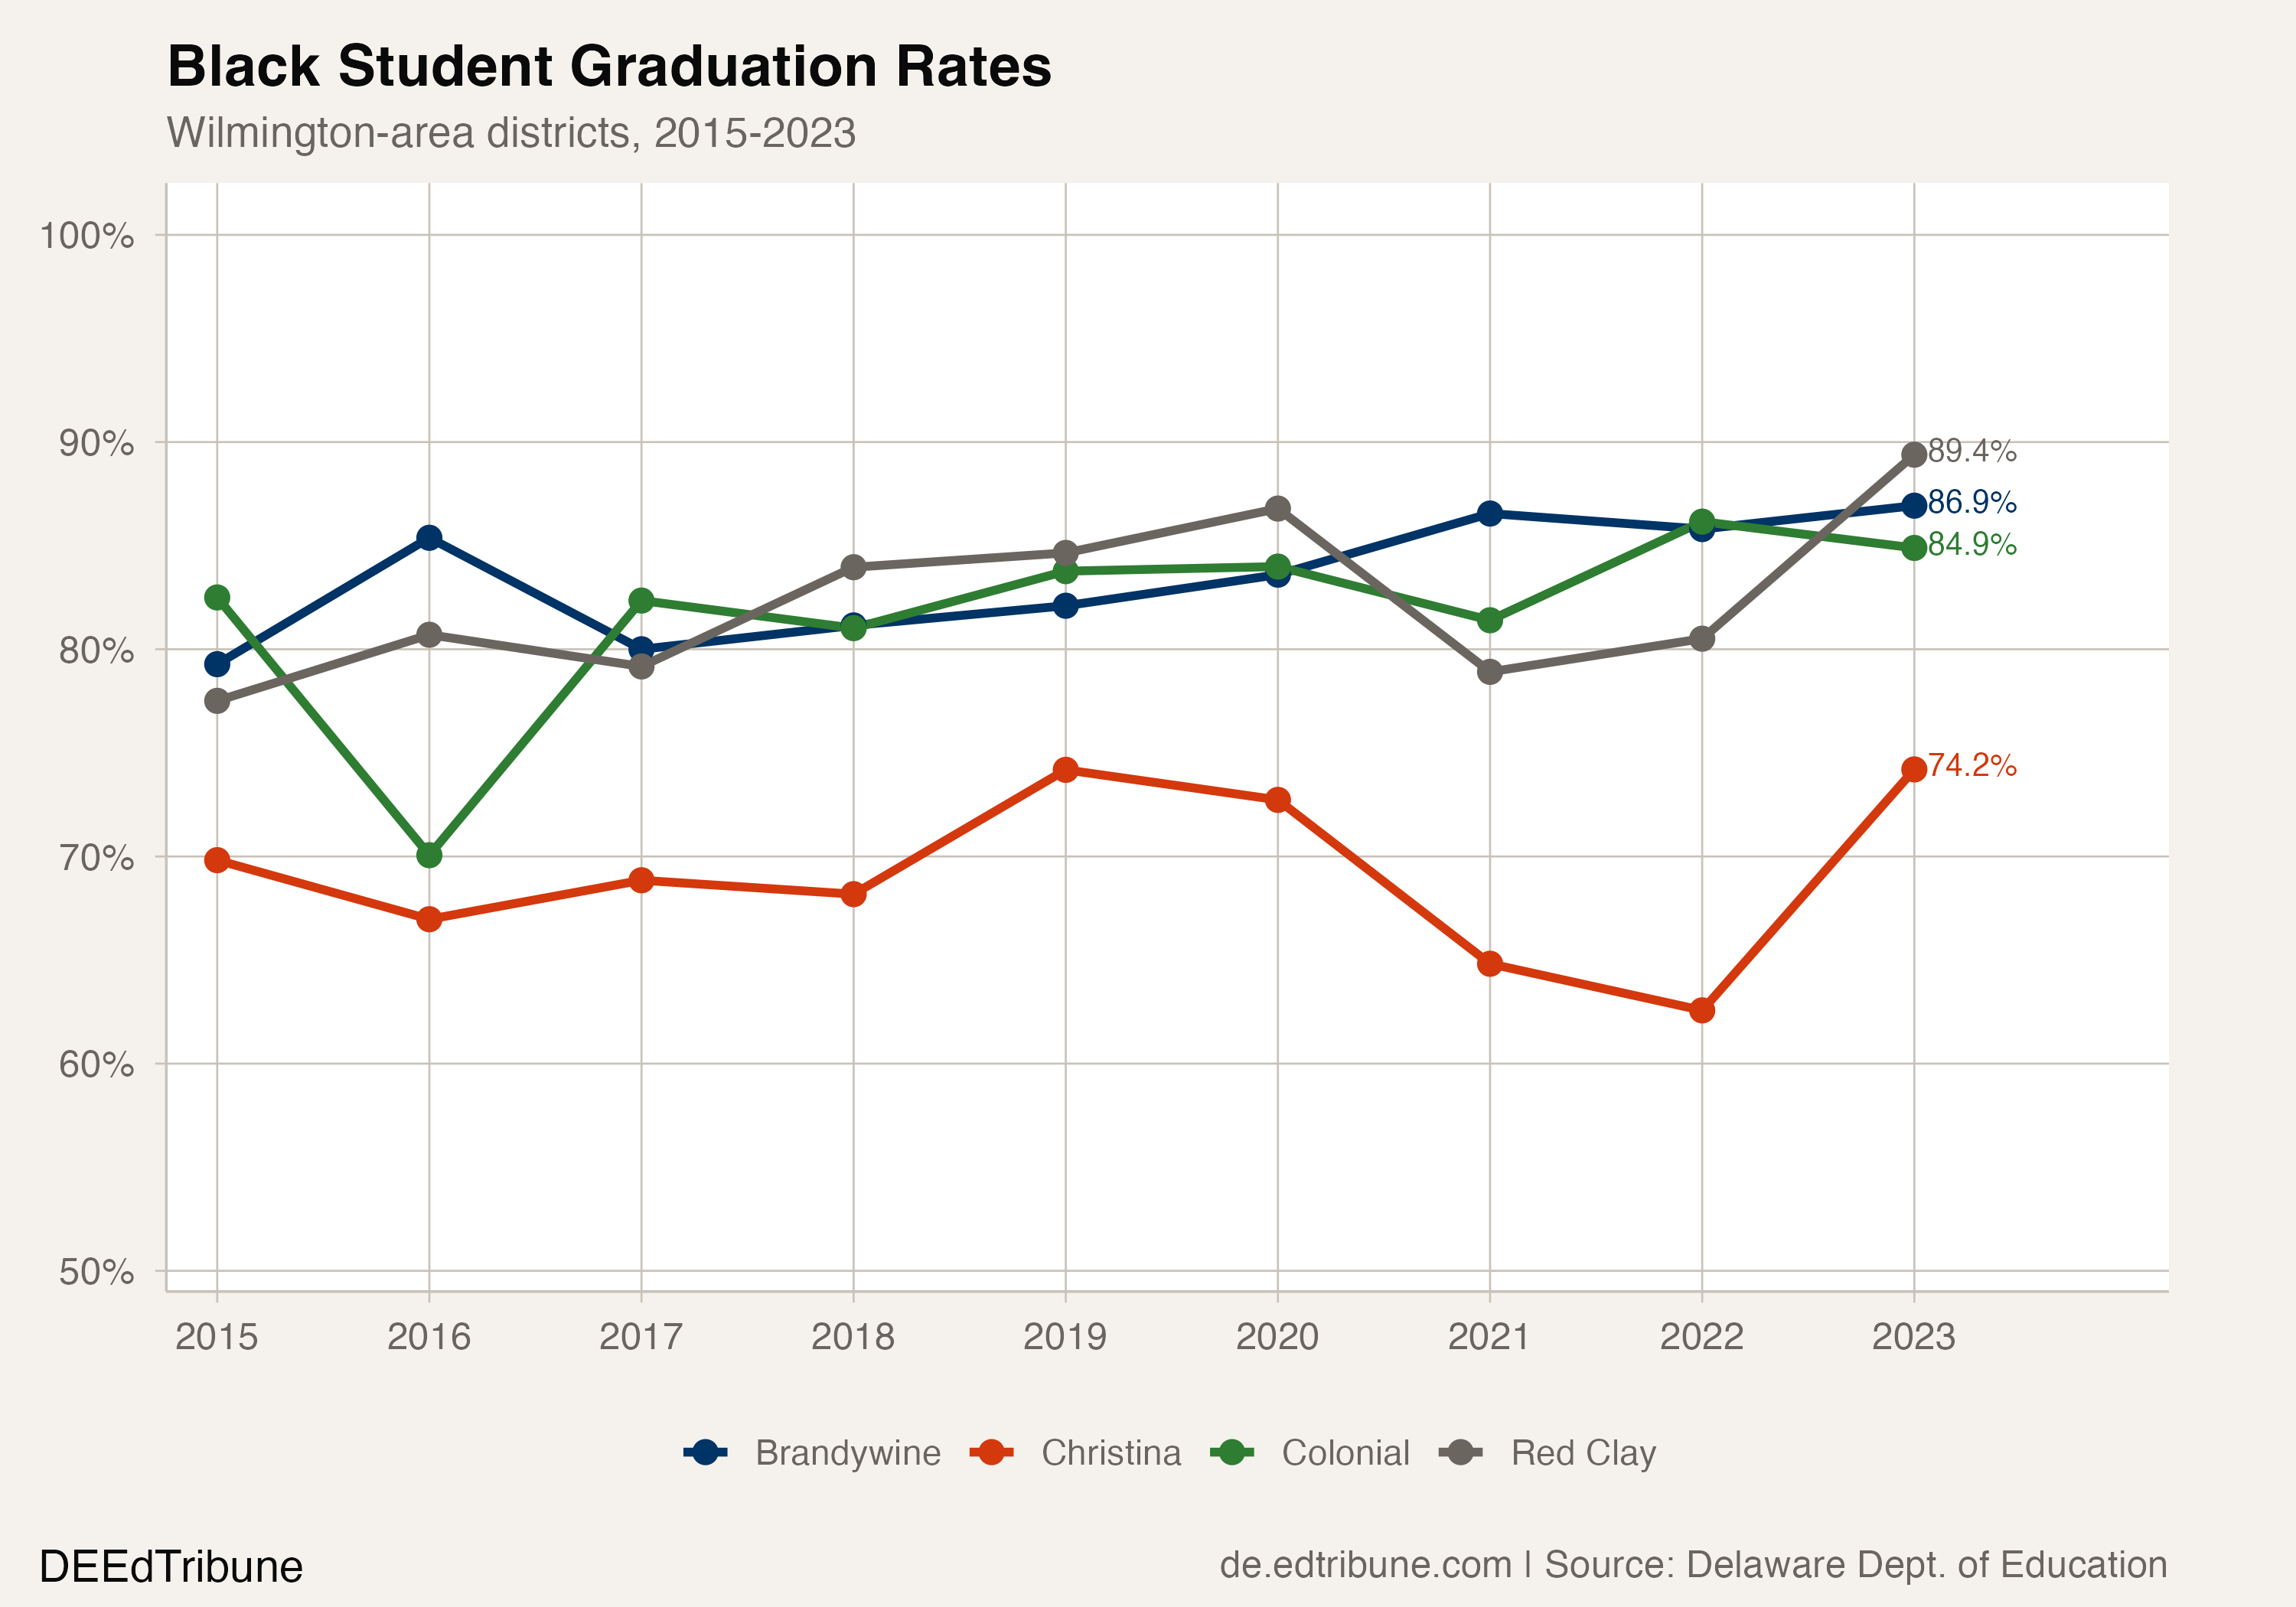
Christina's Black graduation rate hit 62.6% in 2022 before rebounding to 74.2% in 2023. Even after that rebound, it remains below what Red Clay and Brandywine achieved for Black students in every year since 2015. The statewide Black graduation rate is 87.8%. Christina's is 13.6 points below it.
Hispanic students face a similar pattern. Red Clay and Brandywine graduate about 89% of Hispanic students. Colonial graduates 82.0%. Christina graduates 69.2%, more than 17 points below the other three districts' average and 14 points below the statewide Hispanic rate of 83.2%.
Special education: a 26-point chasm
The sharpest disparity surfaces in special education outcomes. In 2023, Red Clay graduated 76.4% of students receiving special education services. Brandywine graduated 73.1%. Colonial graduated 68.7%. Christina graduated 50.9%.
That is a 25.5-point gap between Red Clay and Christina for students entitled to individualized education programs, in districts that draw from overlapping Wilmington neighborhoods. Christina's special education cohort is also the largest of the four at 220 students, compared to Red Clay's 225, making the comparison meaningful in both rate and scale.
For students who are economically disadvantaged, the pattern holds: Red Clay's rate of 86.7% is nearly 20 points above Christina's 67.0%.
What a merged district would look like
In December 2025, the Redding Consortium for Educational Equity, a task force the Delaware legislature created in 2019, voted 19-2 to recommend merging all four districts into a single Northern New Castle County Consolidated School District. The two dissenting votes came from the Brandywine and Christina superintendents.
"We all failed our children together, so we need to fix the problem together." -- Kendra Brown, parent, WHYY, Dec. 2025
The combined 2023 cohort would total 3,555 students, making it by far the largest graduating class in Delaware. Its weighted graduation rate would be 86.0%, pulled down by Christina's low rate applied to a cohort of 829. That blended rate would sit just below the statewide average of 88.9%, masking the internal 19-point spread between the highest and lowest performing components.
"It's the only option that meaningfully and fully addresses structural fragmentation and also addresses fiscal instability at the heart of the inequity that we've experienced regionally." -- State Sen. Tizzy Lockman, Delaware Public Media, Dec. 2025
Not everyone is convinced that consolidation solves the problem. Christina teacher Michelle Suchyj told WHYY, "I don't want my kids in the city of Wilmington to get lost in an even bigger pool." The fiscal reality adds friction: the single-district model carries an estimated $20 million implementation cost, roughly double the least expensive alternative considered by the consortium.
The timeline has already slipped. The Redding Consortium initially aimed to present a final plan to lawmakers by June 2026. In March, co-chair Sen. Lockman told the Joint Finance Committee the American Institutes for Research, the hired consultant, needs until the end of 2026 to develop the detailed merger plan. The earliest legislative vote would come in 2027.
The question consolidation cannot answer
Merging four districts into one would eliminate the boundary lines that sort Wilmington students into different systems. It would not, by itself, close a 19-point graduation gap. The gap is not an artifact of the lines; it reflects differences in school-level performance, resource allocation, staff retention, and student support that persist within each district's schools.
Christina's 2023 graduation rate is not just below its three neighbors. It is below every traditional district in Delaware. It graduated just 50.9% of students receiving special education services and 67.0% of students who are economically disadvantaged, rates that would be concerning in any governance structure.
The Redding Consortium's proposal puts the question before the Delaware General Assembly: whether a single district can do for Wilmington's students what four separate ones have not. The graduation data suggest the urgency. But the data also suggest that drawing new lines, on its own, is not the intervention. What happens inside the schools on both sides of the line is what determines whether a student in Wilmington finishes high school.
RELATED: Four Districts, One City, 6,476 Fewer StudentsET
Detailed code that reproduces the analysis and figures in this article is available exclusively to EdTribune subscribers.
Discussion
Sign in to join the discussion.
Loading comments...