Correction (July 20, 2026; audited July 21): An earlier version incorrectly said no subgroup improved more than special education, understated Smyrna's advantage over Christina, and described the Christina-NCC Vo-Tech trajectories as diverging. Multiracial students posted the largest statewide gain; Smyrna's 2023 rate was 34.8 points above Christina's; and the Christina-NCC gap remained roughly 43 points. The article also now derives cohort counts directly from the state package, removes an unsupported gap-elimination forecast, and no longer characterizes the district gap pattern as statistically nonrandom without a coded test.
At NCC Vo-Tech↗ET, 93.6% of special education students in the class of 2023 earned a diploma in four years. At Christina↗ET, the figure was 50.9%. That is a 43-point spread between the best and worst special education graduation rates reported by Delaware districts.
The statewide picture is more encouraging. Delaware's special education four-year graduation rate climbed from 63.7% in 2015 to 73.3% in 2023, a gain of 9.6 percentage points. That was the second-largest gain among reported subgroups, behind the multiracial group's 13.6-point increase. But that progress has not distributed evenly. The gap between special education students and their peers remains 15.6 percentage points, and in three districts, it exceeds 20 points.
513 more diplomas, same structural divide
The state-level trend line looks like a success story, and in raw terms, it is. In the class of 2015, 872 special education students graduated on time out of a cohort of 1,368. By 2023, the cohort had grown 38.1% to 1,889 students, and 1,385 earned diplomas. Delaware went from 872 to 1,385 special education graduates annually, an increase of 513, while simultaneously raising the graduation rate by nearly 10 points.
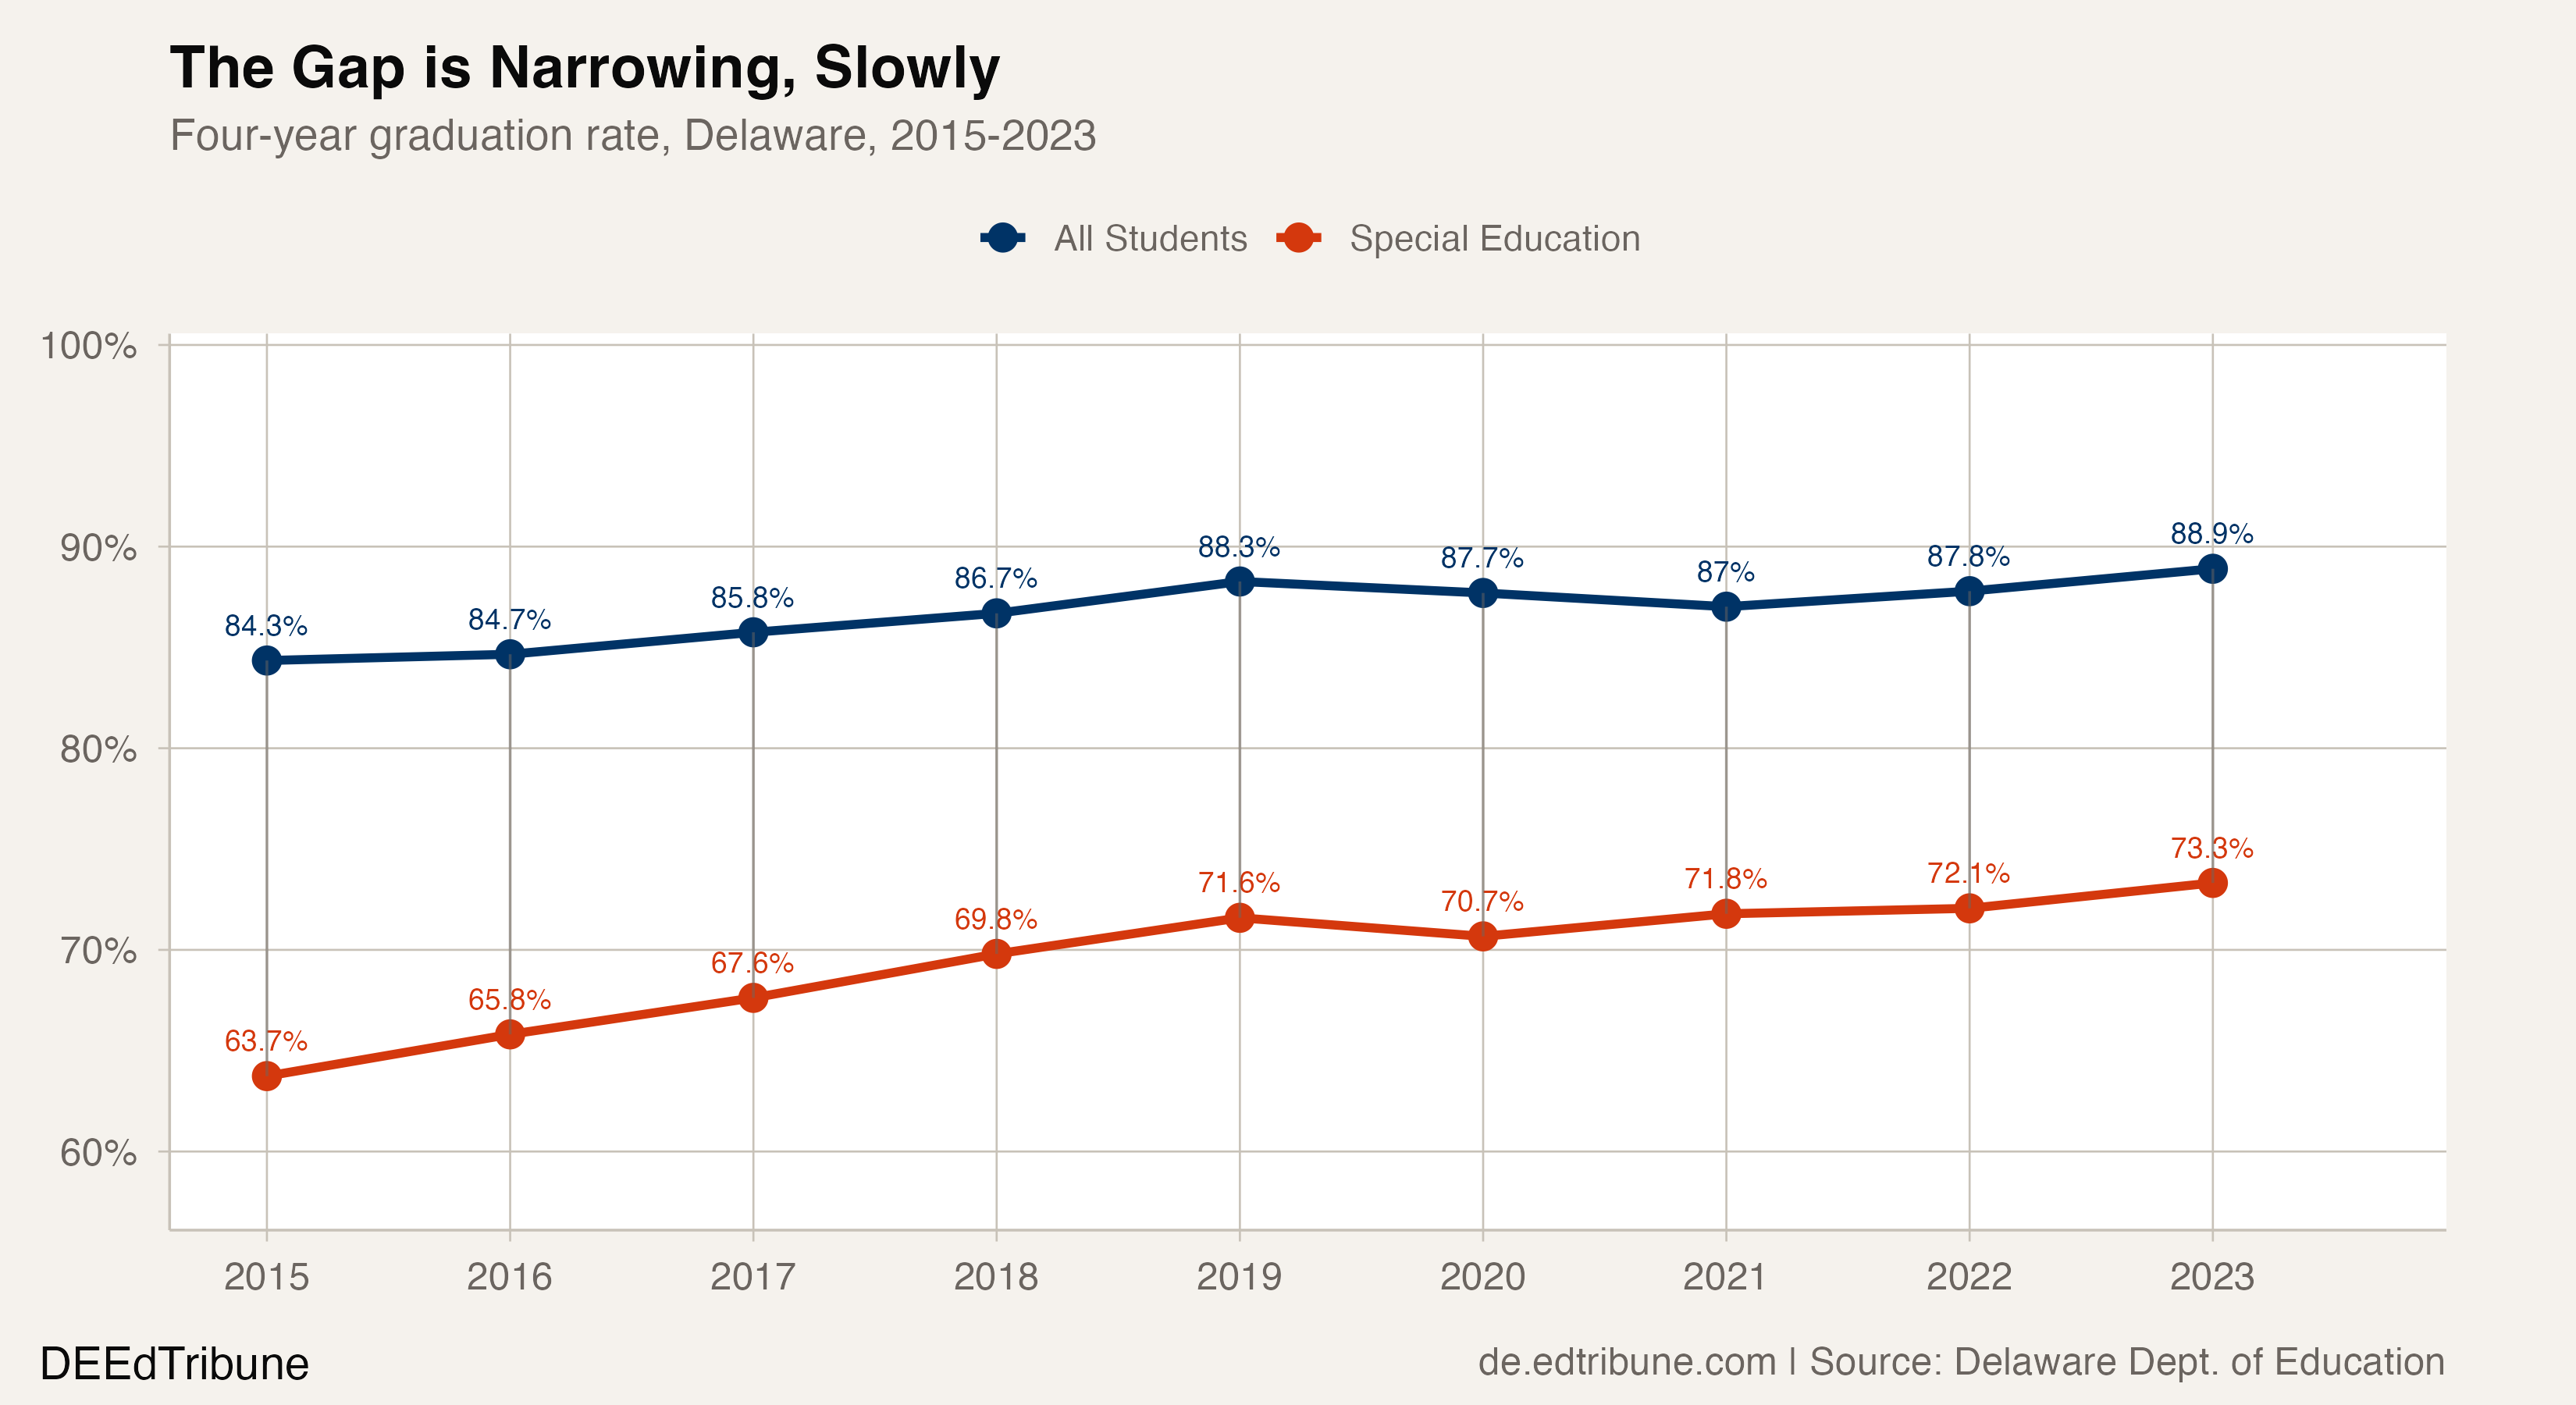
The improvement was not linear. The rate climbed steadily from 63.7% in 2015 to 71.6% in 2019, dipped slightly during COVID to 70.7%, and then resumed a slower climb. The pre-pandemic pace was roughly 2 percentage points per year. Since 2020, the annual gain has averaged less than 1 point.
Meanwhile, the overall student graduation rate rose from 84.4% to 88.9% over the same period, a gain of 4.6 points. Because special education students gained faster, the gap narrowed from 20.6 points in 2015 to 15.6 points in 2023.
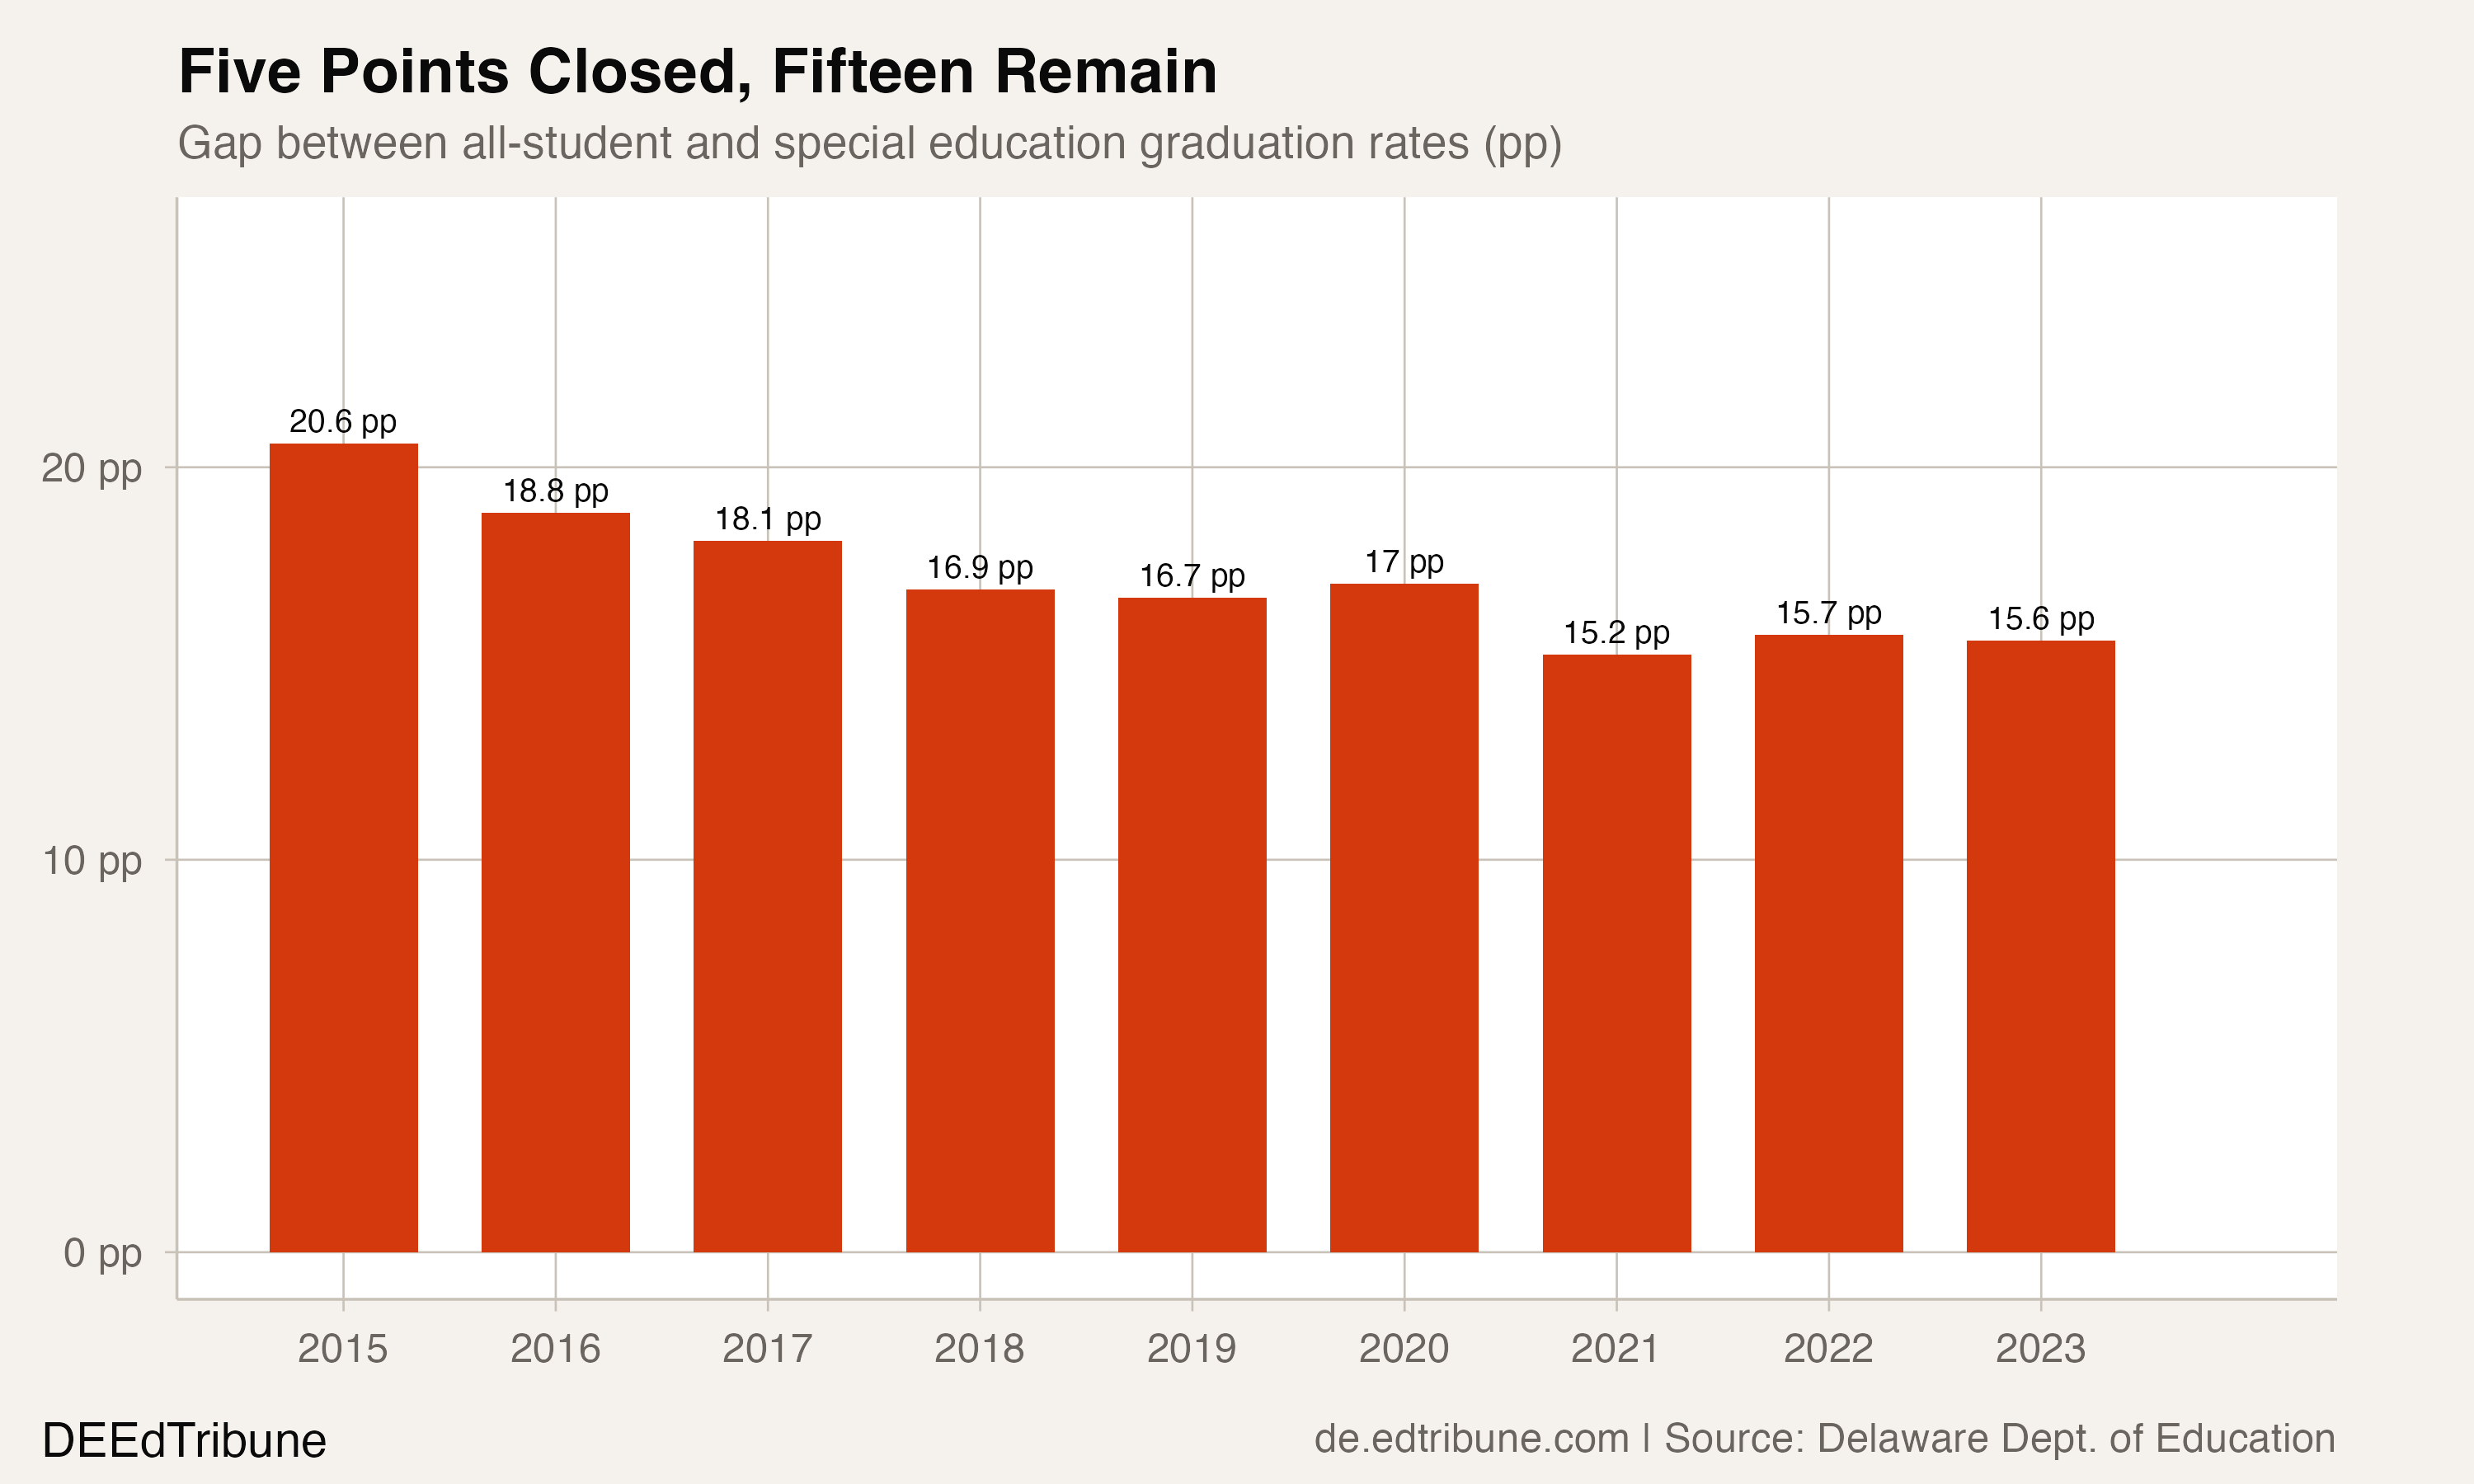
Five points closed across the nine reported graduating classes. That historical change does not establish a straight-line timetable for eliminating the remaining gap.
Where the gap concentrates
The statewide 15.6-point gap masks enormous variation at the district level. Caesar Rodney↗ET has the widest gap in the state: 26.7 percentage points. Its overall graduation rate is 89.3%, but its special education rate is 62.6%. Christina's gap is 22.3 points, and Cape Henlopen↗ET's is 21.9.
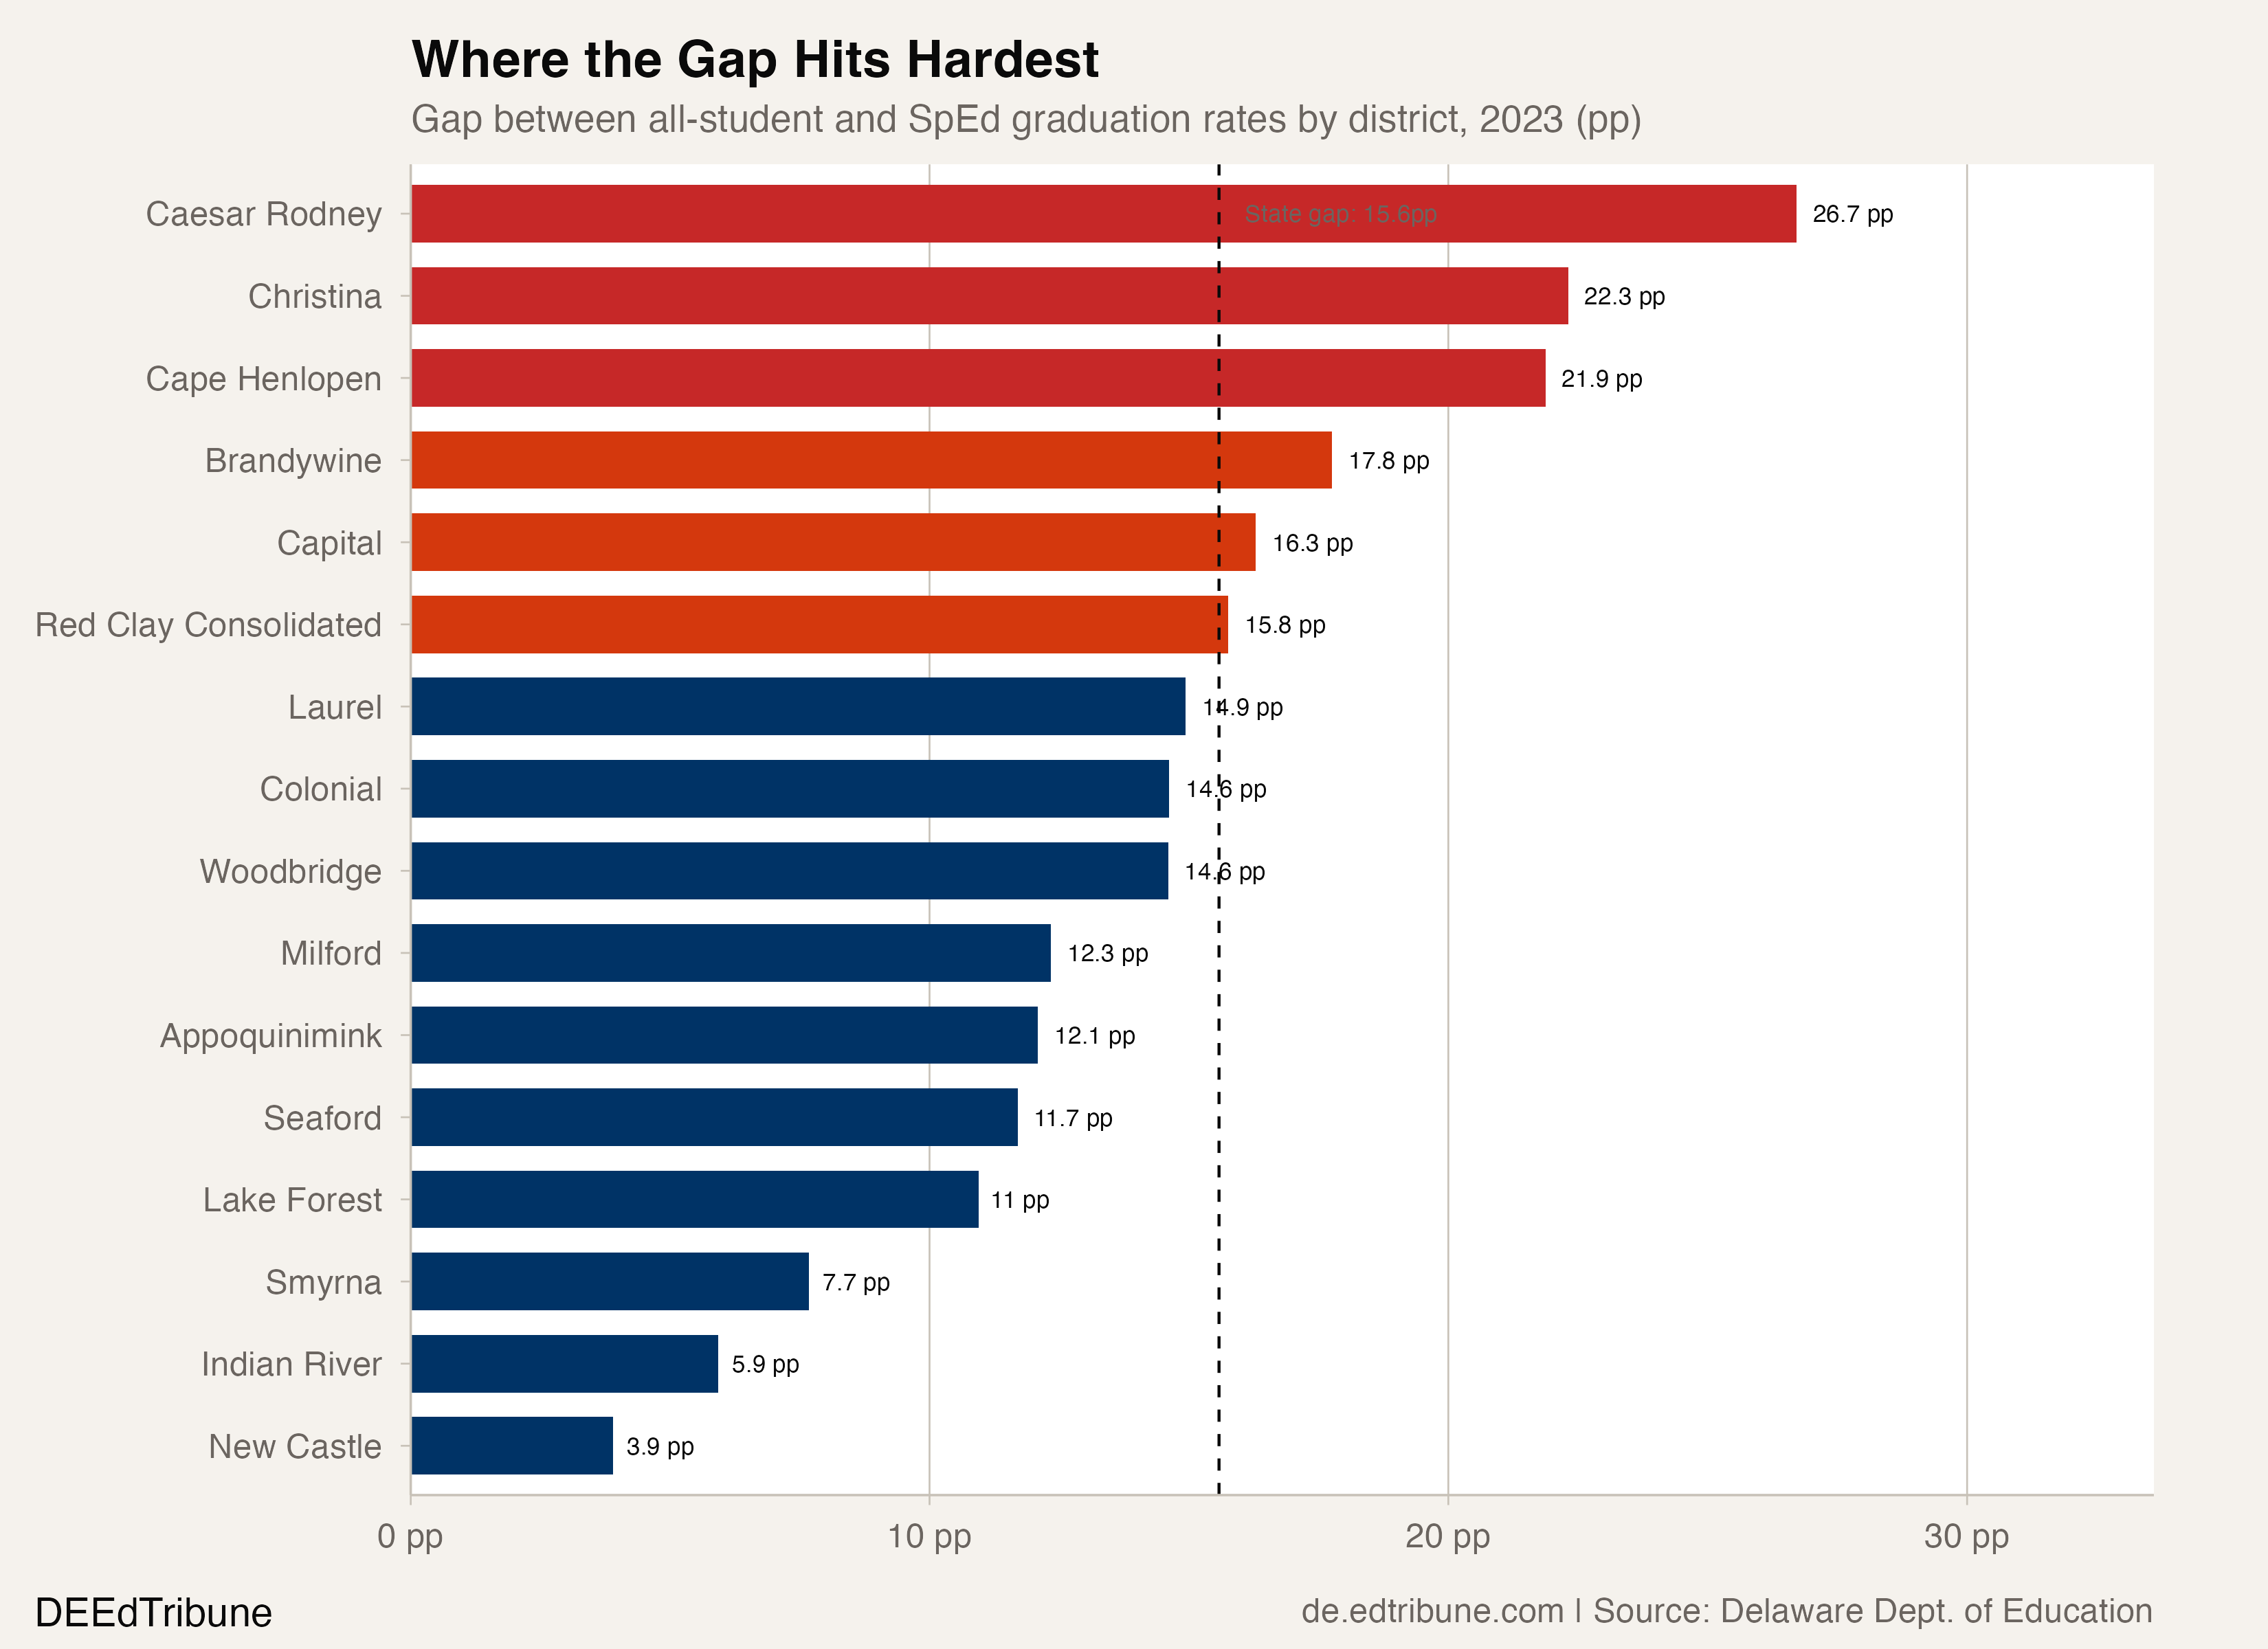
The six districts with gaps above 15 points are all traditional comprehensive districts. The two with the narrowest gaps are NCC Vo-Tech at 3.9 points and Smyrna↗ET at 7.7 points. Smyrna graduated 85.7% of its special education students in 2023.
What separates Smyrna from Caesar Rodney is not obvious from the data alone. Both serve Kent County. But Smyrna's special education students graduate at rates 34.8 points higher than Christina's and 23.1 points higher than Caesar Rodney's.
Christina: half a graduating class
Christina is an outlier even among struggling districts. Its special education graduation rate of 50.9% means that roughly half of its students with IEPs do not finish high school on time. The next-lowest reported district rate is Caesar Rodney's 62.6%.
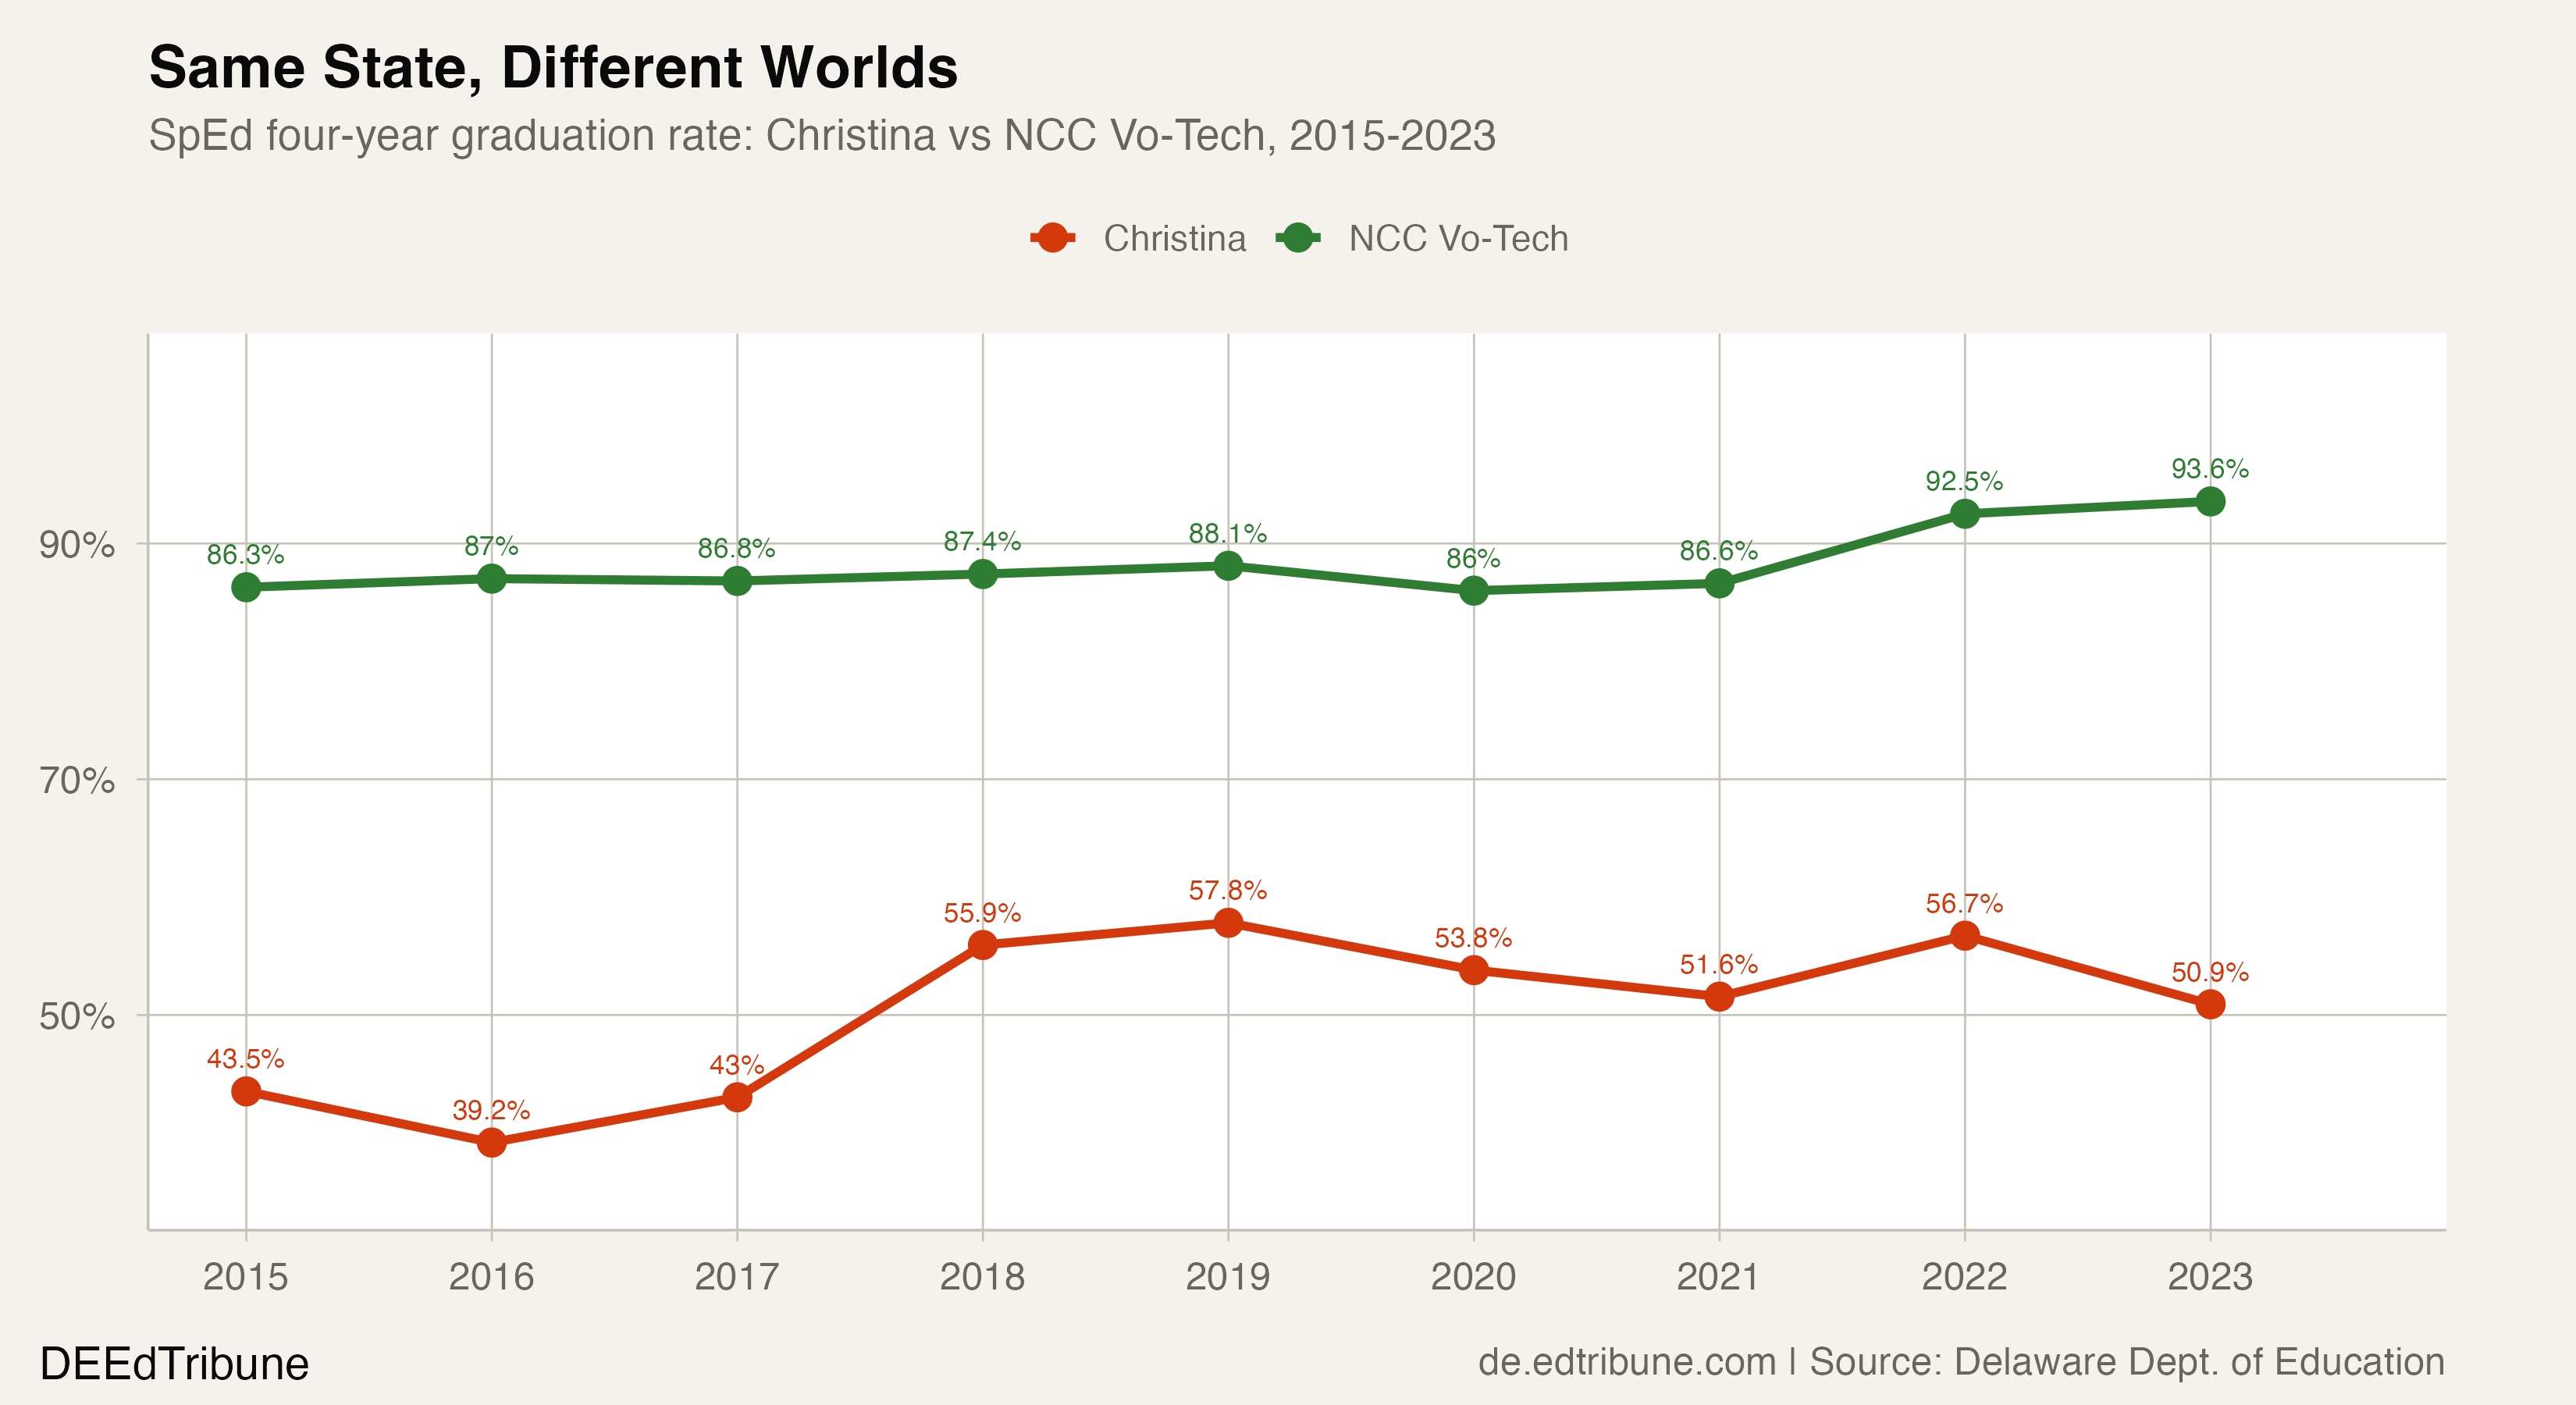
The trend at Christina has been volatile and discouraging. The rate was 43.5% in 2015, rose to 57.8% in 2019, fell back to 51.6% in 2021, and sat at 50.9% in 2023. Across the nine reported classes, Christina's special education graduation rate improved by 7.4 points. Over the same period, NCC Vo-Tech's rose from 86.3% to 93.6%. Their gap remained roughly 43 points.
Christina's 2023 graduating cohort included 220 special education students, the second-largest district cohort in the state behind Red Clay's 225. This is not a small-sample anomaly. Christina's 2023 special education graduation rate was 22.4 points below the state average.
The Redding Consortium for Educational Equity, the state task force studying Wilmington's fragmented school boundaries, voted in December 2025 to recommend consolidating Christina, Red Clay, Brandywine, and Colonial into a single district. Whether consolidation would address the special education gap is an open question the graduation data cannot answer.
The vo-tech question
NCC Vo-Tech's 93.6% special education graduation rate is 20.2 points above the state average and within 3.9 points of its own all-student rate.
[Competing explanation:] Selection into a vo-tech district may contribute to the difference, but the graduation records cannot measure that effect. NCC Vo-Tech's special education cohort of 140 students is not trivially small. It is larger than the special education cohorts at Caesar Rodney (99), Cape Henlopen (61), or Seaford (61). The district also embeds Learning Support Coaches in general education classrooms.
The more direct comparison may be Appoquinimink↗ET, a traditional district in southern New Castle County. Appoquinimink graduates 83.3% of its special education students, 10 points above the state average and 32.4 points above Christina.
Extra time is not the answer
Delaware reports both four-year and five-year graduation rates. For special education students, the five-year rate in 2022 was 74.1%, just 2.1 points above the four-year rate of 72.1%.
The five-year figure shows that relatively few additional students earned diplomas with one more year: the rate was about one additional graduate per 48 students above the four-year rate. The aggregate data does not show what happened to the remaining 26.7% or whether additional time beyond year five changed their outcomes.
The U.S. Department of Education has classified Delaware as "Needs Assistance" under IDEA for consecutive years, indicating the state requires technical assistance to improve special education outcomes. The designation reflects performance across multiple indicators, not graduation alone, but the graduation gap is the most visible metric.
The cohort is growing
One dimension that complicates the progress narrative: the special education cohort is expanding. In 2015, 1,368 students with IEPs were in Delaware's four-year graduation cohort. By 2023, that figure was 1,889, a 38.1% increase. Over the same period, the total graduation cohort grew by 11.0%.
Whether this reflects genuinely more students with disabilities or broader identification practices is unclear from graduation data alone. What is clear is that the system must deliver specialized instructional programs to a growing number of students while simultaneously closing a persistent gap.
The more immediate question is what separates Smyrna at 85.7% and Appoquinimink at 83.3% from Christina at 50.9% and Caesar Rodney at 62.6%. The graduation records establish the gap but cannot attribute it to IEP implementation, instructional placement, transition planning, demographics, or poverty. Answering that requires evidence beyond the aggregate rates.
Detailed code that reproduces the analysis and figures in this article is available exclusively to EdTribune subscribers.
Discussion
Sign in to join the discussion.
Loading comments...