Tuesday, July 14, 2026

Seaford's Graduation Rate Has Fallen 5.8 Points. No Other Delaware District Dropped.

Seaford School District's graduation rate dropped 5.8 points since 2015, the steepest decline in Delaware. A 13-point gender gap and deep racial disparities compound the problem.

At Seaford Senior High School, the class of 2023 walked across the stage with a 74.0% four-year graduation rate. That number sits 14.9 percentage points below the Delaware average. But the aggregate masks a sharper fact: only 67.7% of boys in the cohort graduated on time. Roughly one in three did not.

SeafordET is a small district in western Sussex County, where the poultry processing plants that drive the local economy draw a workforce that is heavily immigrant and low-income. Its 3,400 students are 37% Black, 29% Hispanic, and 26% white. The school district and CapitalET share the highest child poverty rate in the state at 19.8%. Those demographics alone do not explain what has happened to Seaford's graduation rate since 2015, because districts with similar profiles have improved. Seaford went the other direction.

The arc of a decade

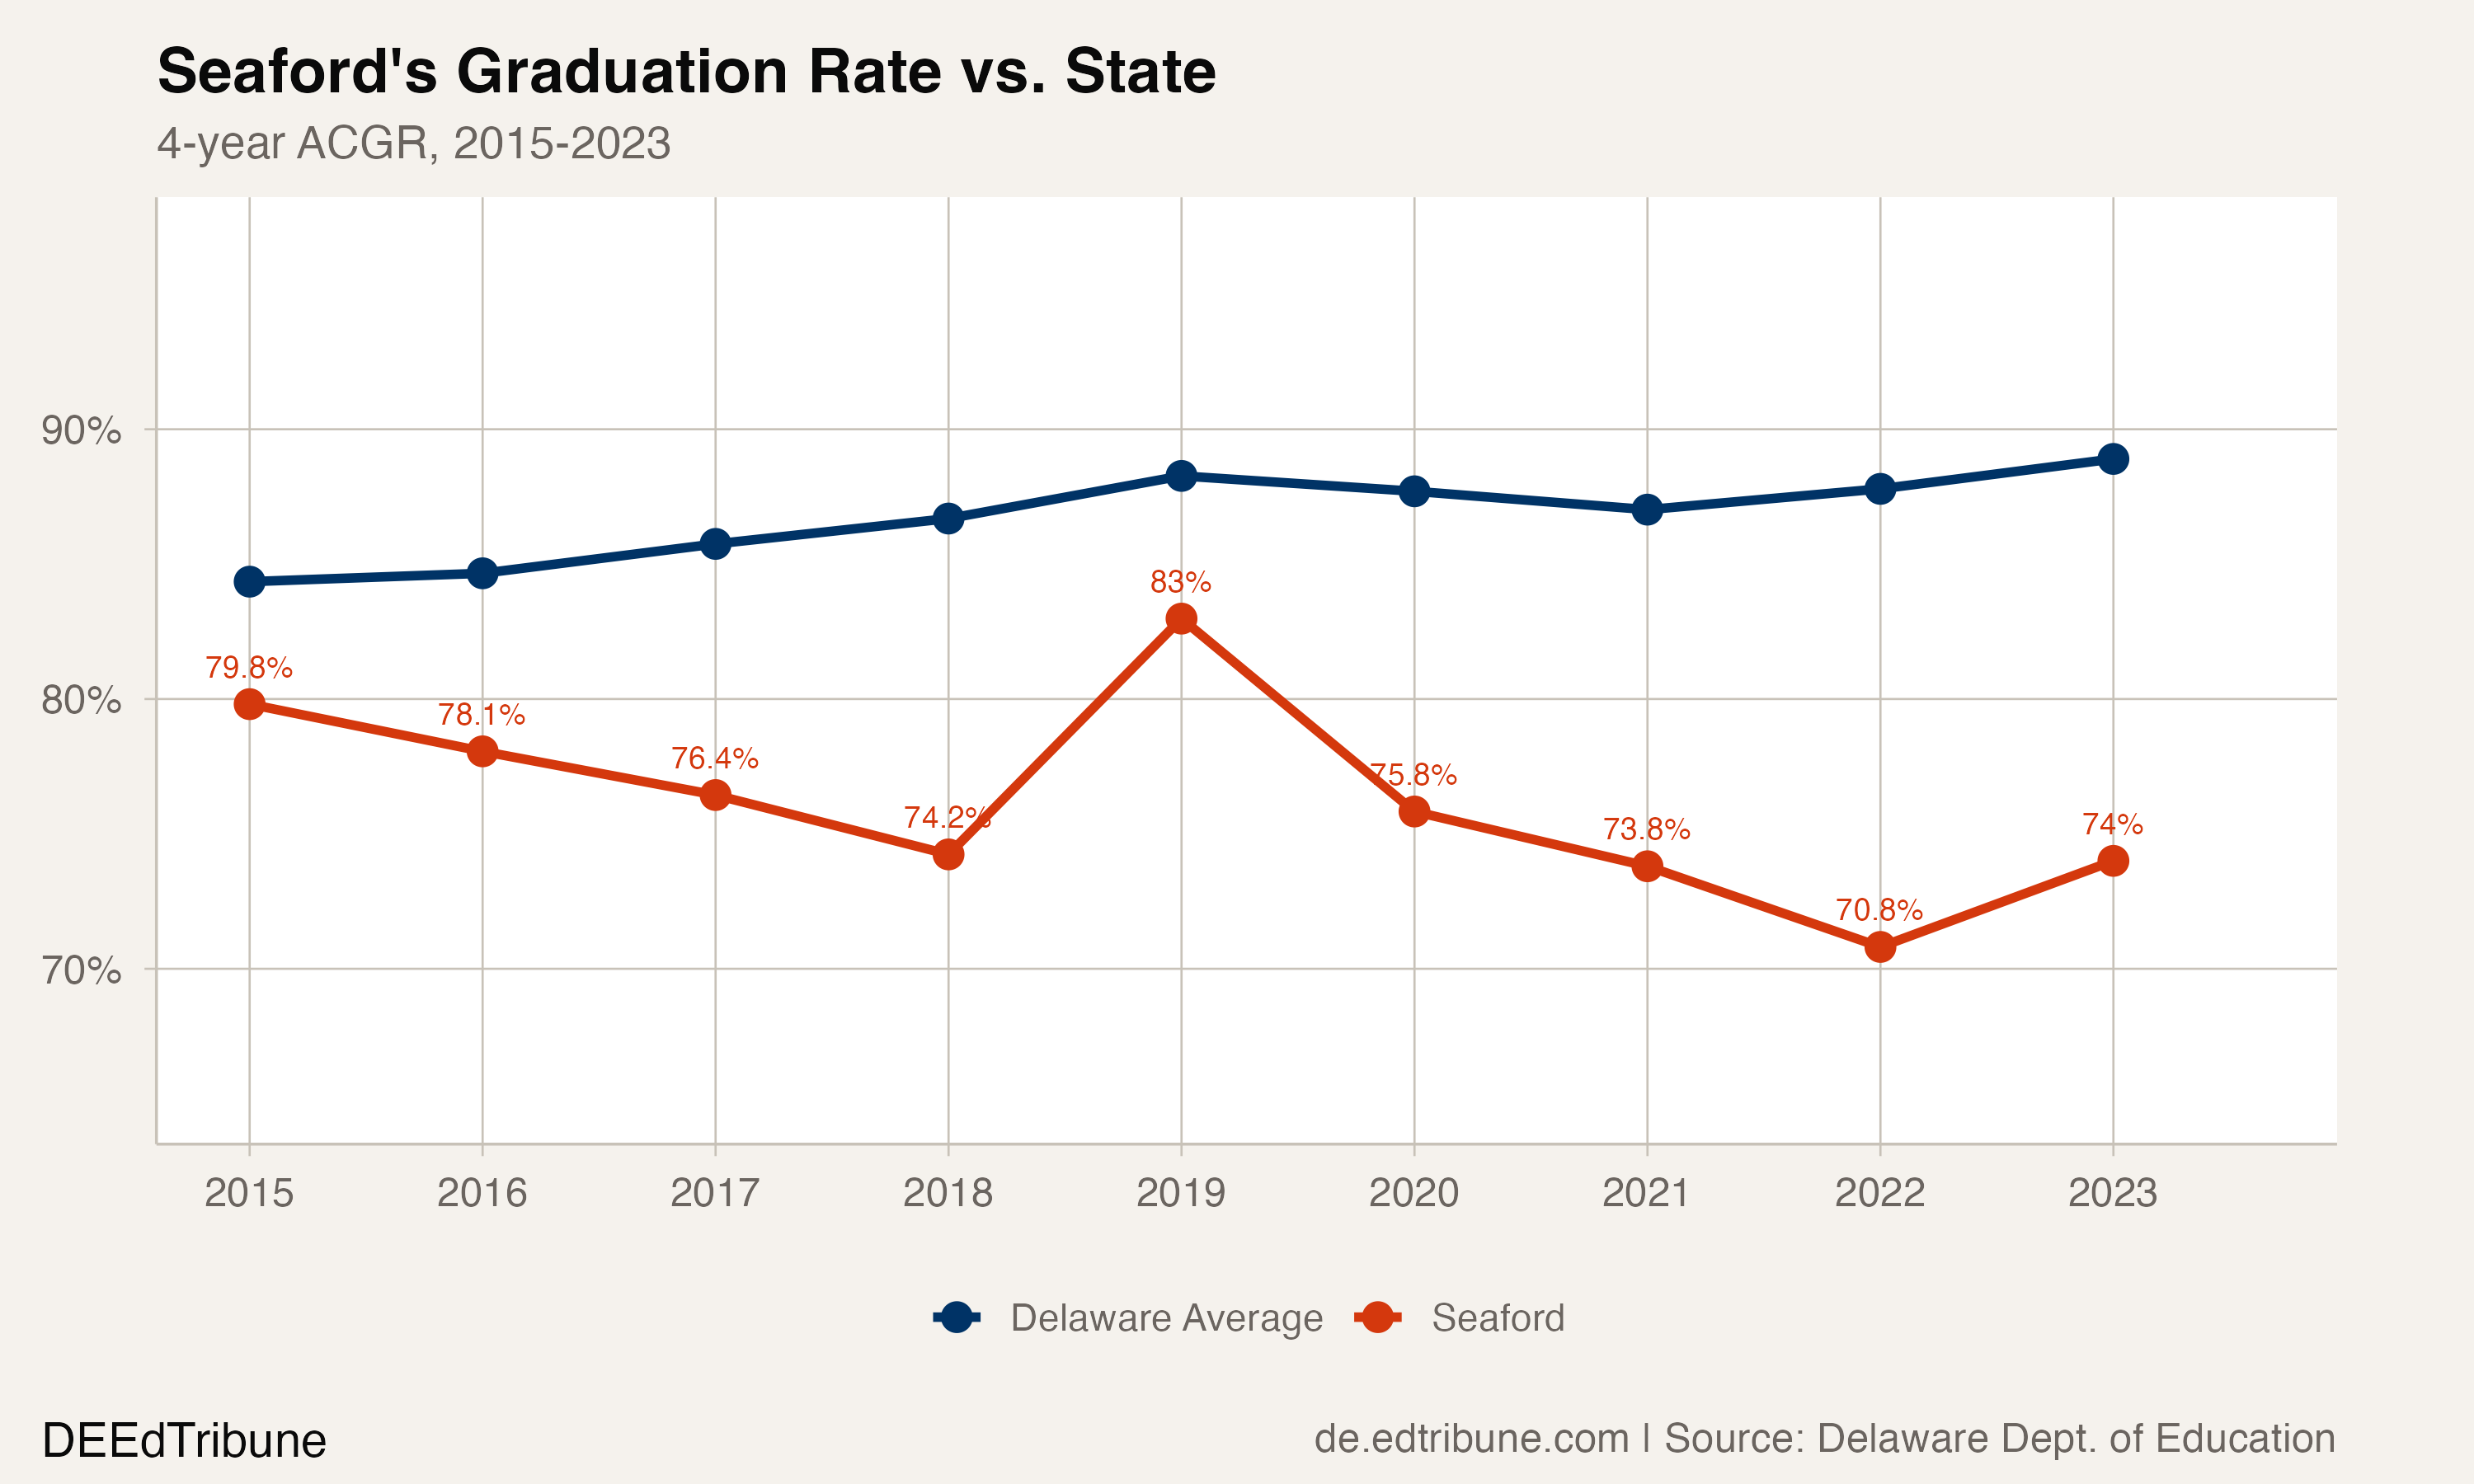
In 2015, Seaford graduated 79.8% of its cohort, below the state's 84.4% but within striking distance. The gap between Seaford and the state average was 4.5 points. By 2023, that gap had widened to 14.9 points, because the state climbed to 88.9% while Seaford fell.

The decline was not steady. Seaford's rate actually rose to 83.0% in 2019, briefly narrowing the gap to 5.3 points. Then it collapsed: 75.8% in 2020, 73.8% in 2021, and a trough of 70.8% in 2022. The 2023 cohort recovered 3.2 points from that low, but the trajectory remains well below where Seaford started.

Seaford's graduation rate compared to the Delaware state average, 2015-2023

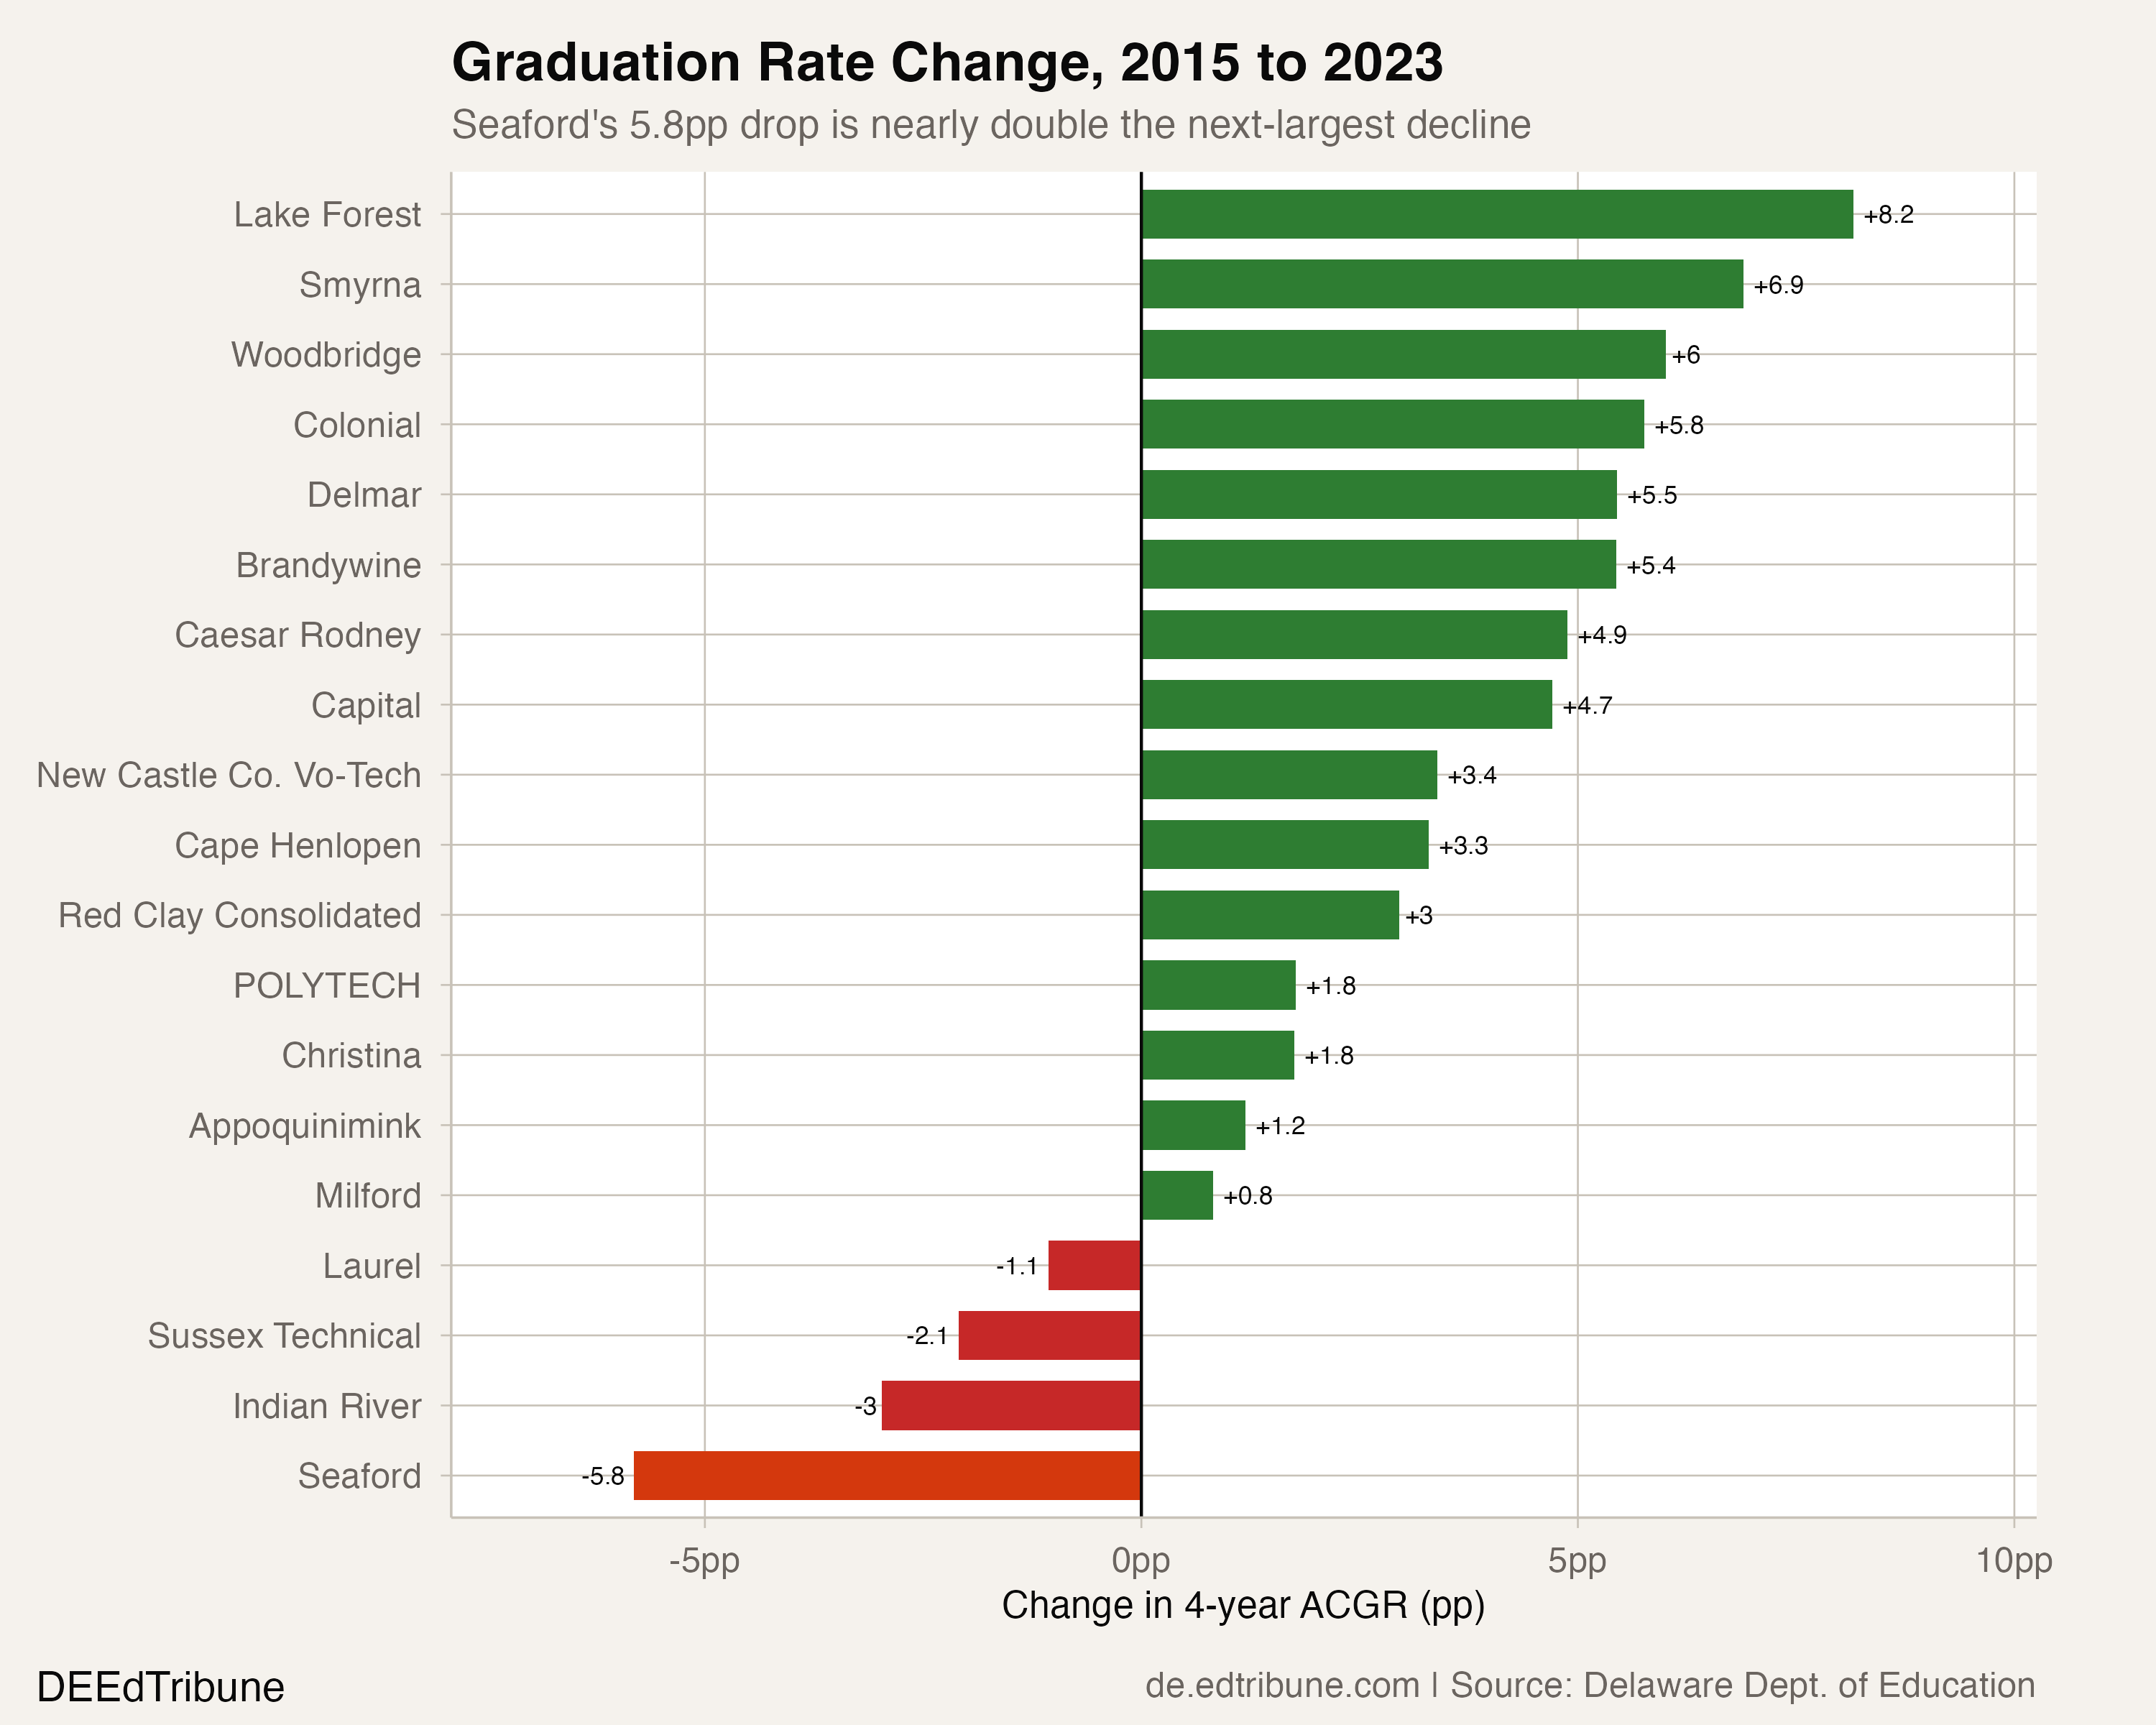
Across Delaware's 19 districts, four finished 2023 with a lower graduation rate than in 2015. Indian RiverET lost 3.0 points, Sussex TechnicalET lost 2.1, and LaurelET lost 1.1. Seaford's 5.8-point decline is nearly double the next-largest drop. Meanwhile, Lake ForestET gained 8.2 points and SmyrnaET gained 6.9. The divergence is concentrated in Sussex County, where three of the four declining districts sit.

Graduation rate change by district, 2015 to 2023

Boys in crisis

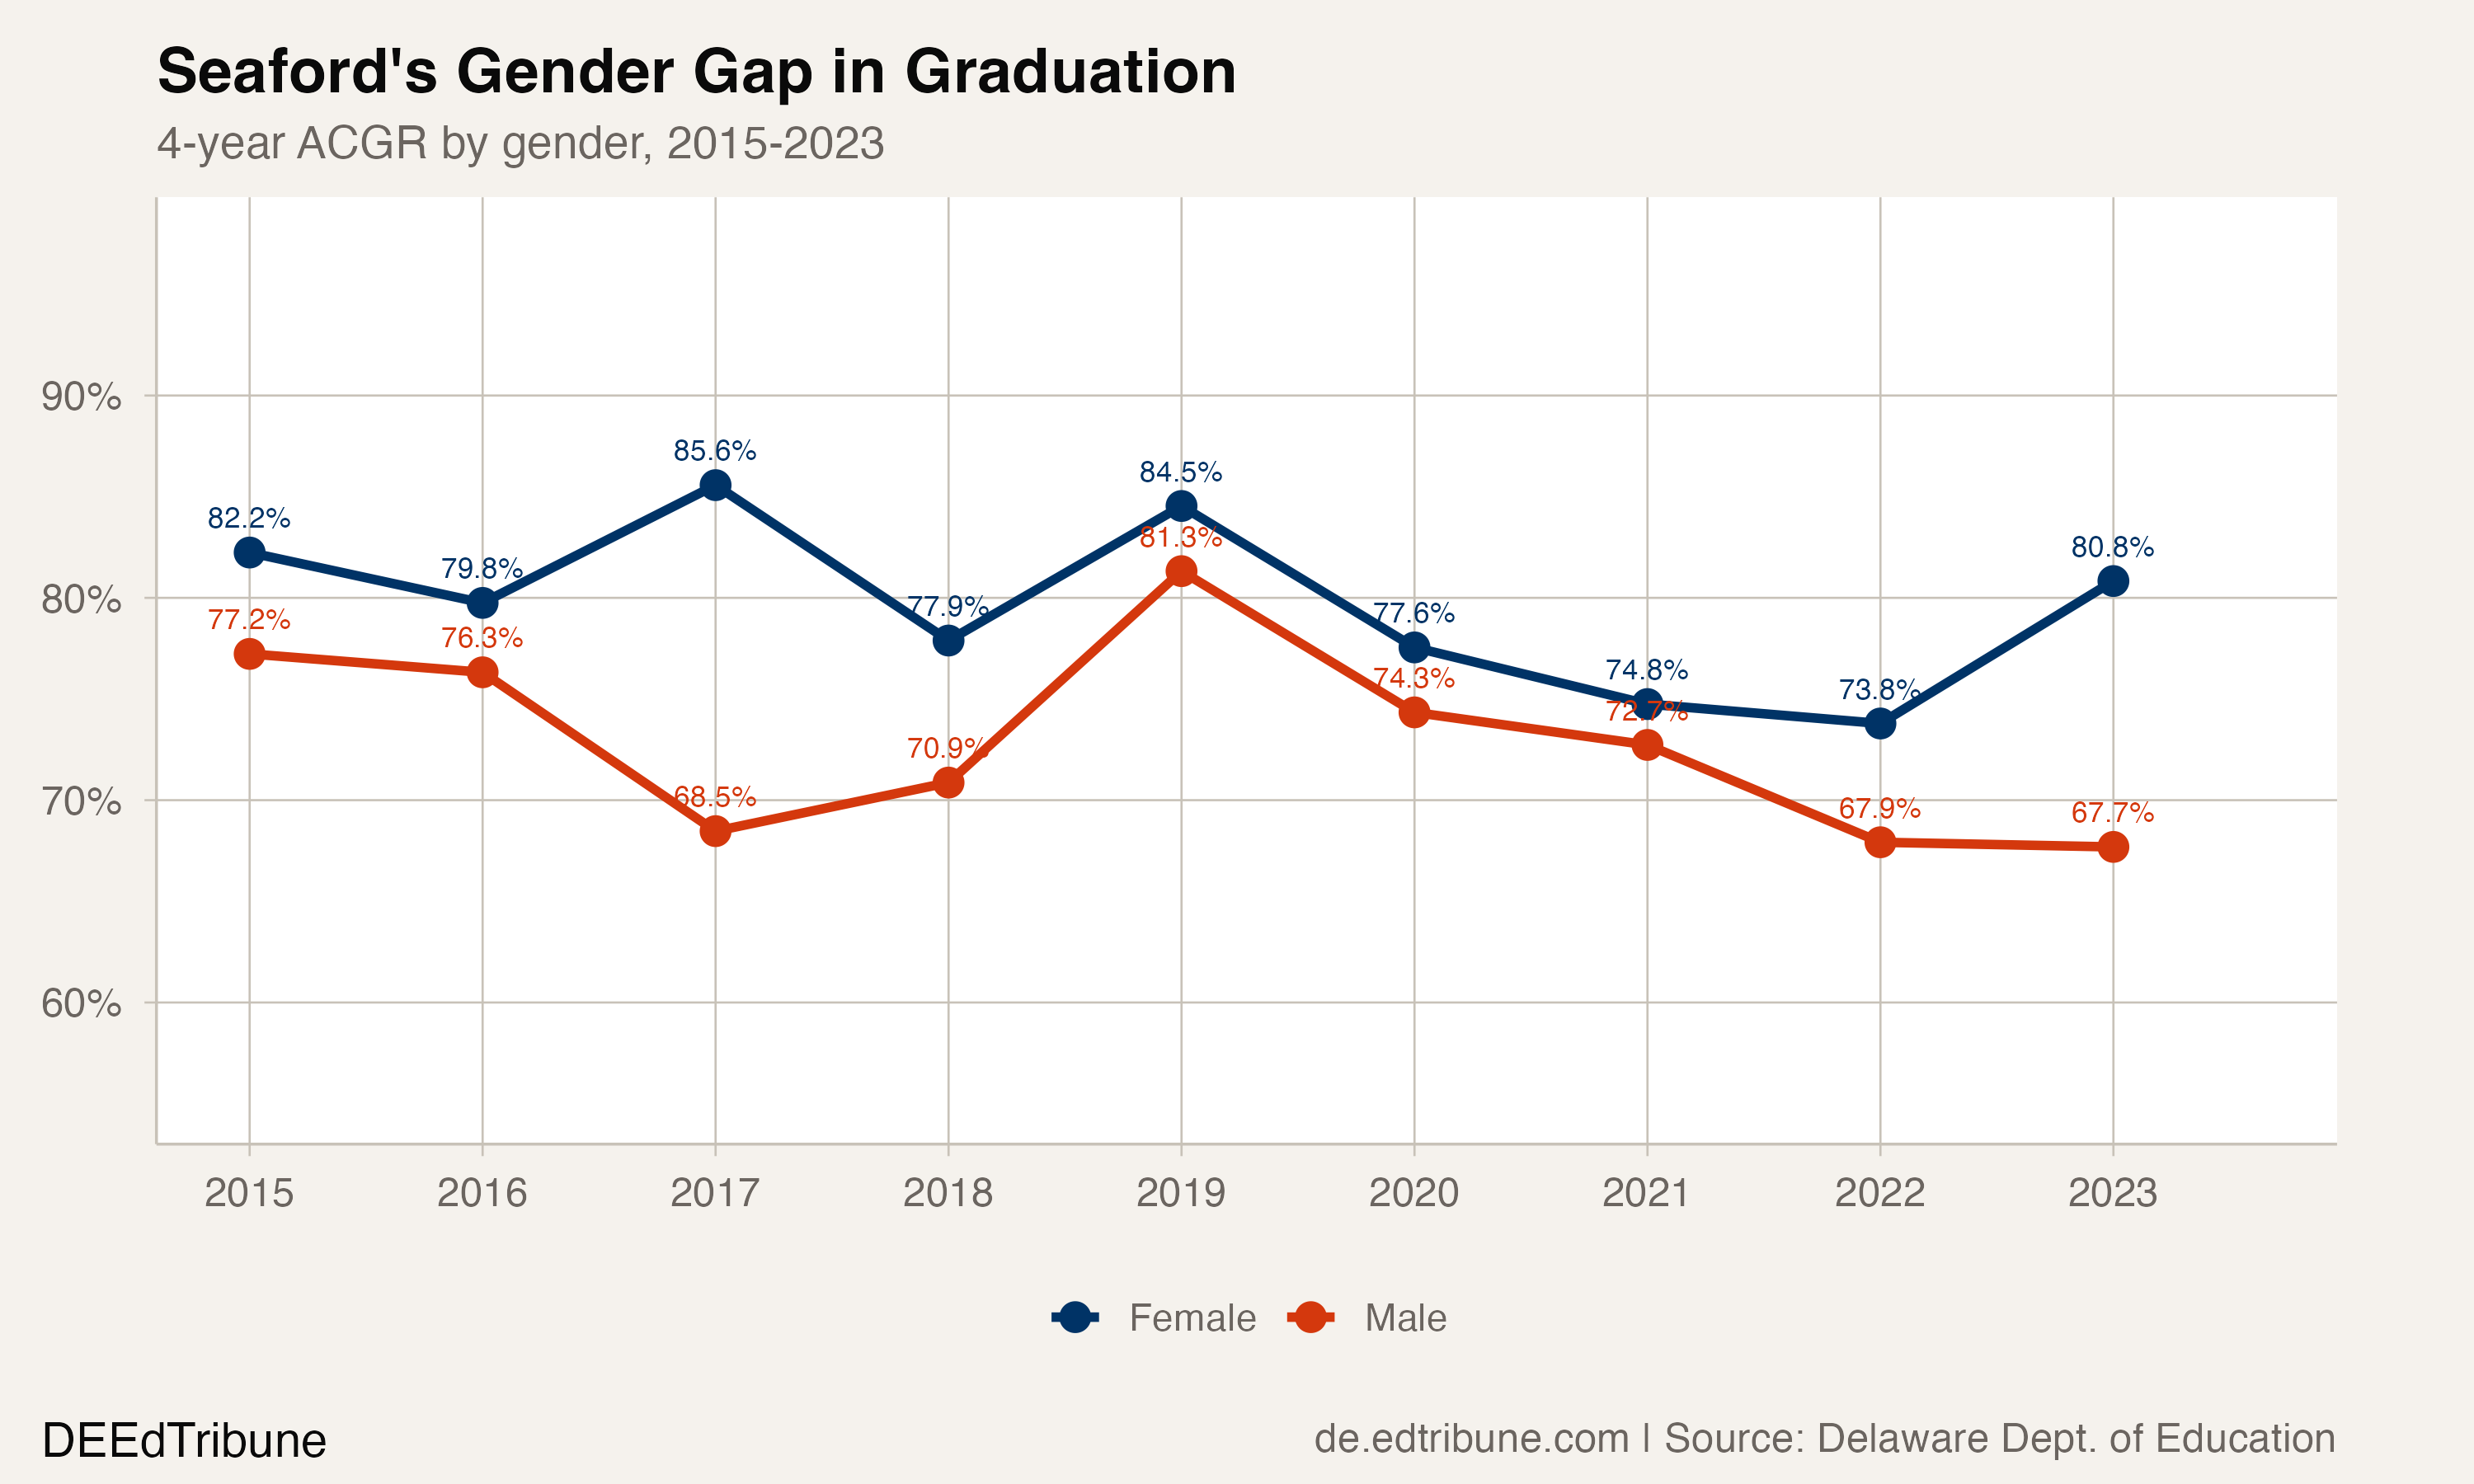
The statewide gender gap in graduation rates runs about 4 to 6 percentage points in most Delaware districts. In Seaford, it runs 13.1.

Female students graduated at 80.8% in 2023, a rate that would place Seaford in the middle of Delaware's district rankings. Male students graduated at 67.7%, a rate lower than every district's overall average except ChristinaET's 73.2%. The male rate has been volatile: it hit 68.5% in 2017, recovered to 81.3% in 2019, then crashed again to 67.9% in 2022 before barely ticking up to 67.7% in 2023.

Seaford's graduation rate by gender, 2015-2023

The 2019 spike is instructive. That year, the male rate reached its highest point in the dataset at 81.3%, and the gender gap shrank to 3.2 points. Whatever intervention or cohort composition produced that result did not persist. The gap reopened to 5.9 points by 2022 and 13.1 points by 2023. Christina's gender gap of 12.8 points is the only one in the state that comes close.

The grade-level enrollment at Seaford Senior High tells part of the story. In the 2024-25 school year, 265 students were enrolled in ninth grade but only 153 in twelfth, a 42% shrinkage from entry to exit. Students who leave before senior year do not appear in the graduation rate denominator if they transfer, but those who remain enrolled and do not finish on time do.

Year-over-year volatility

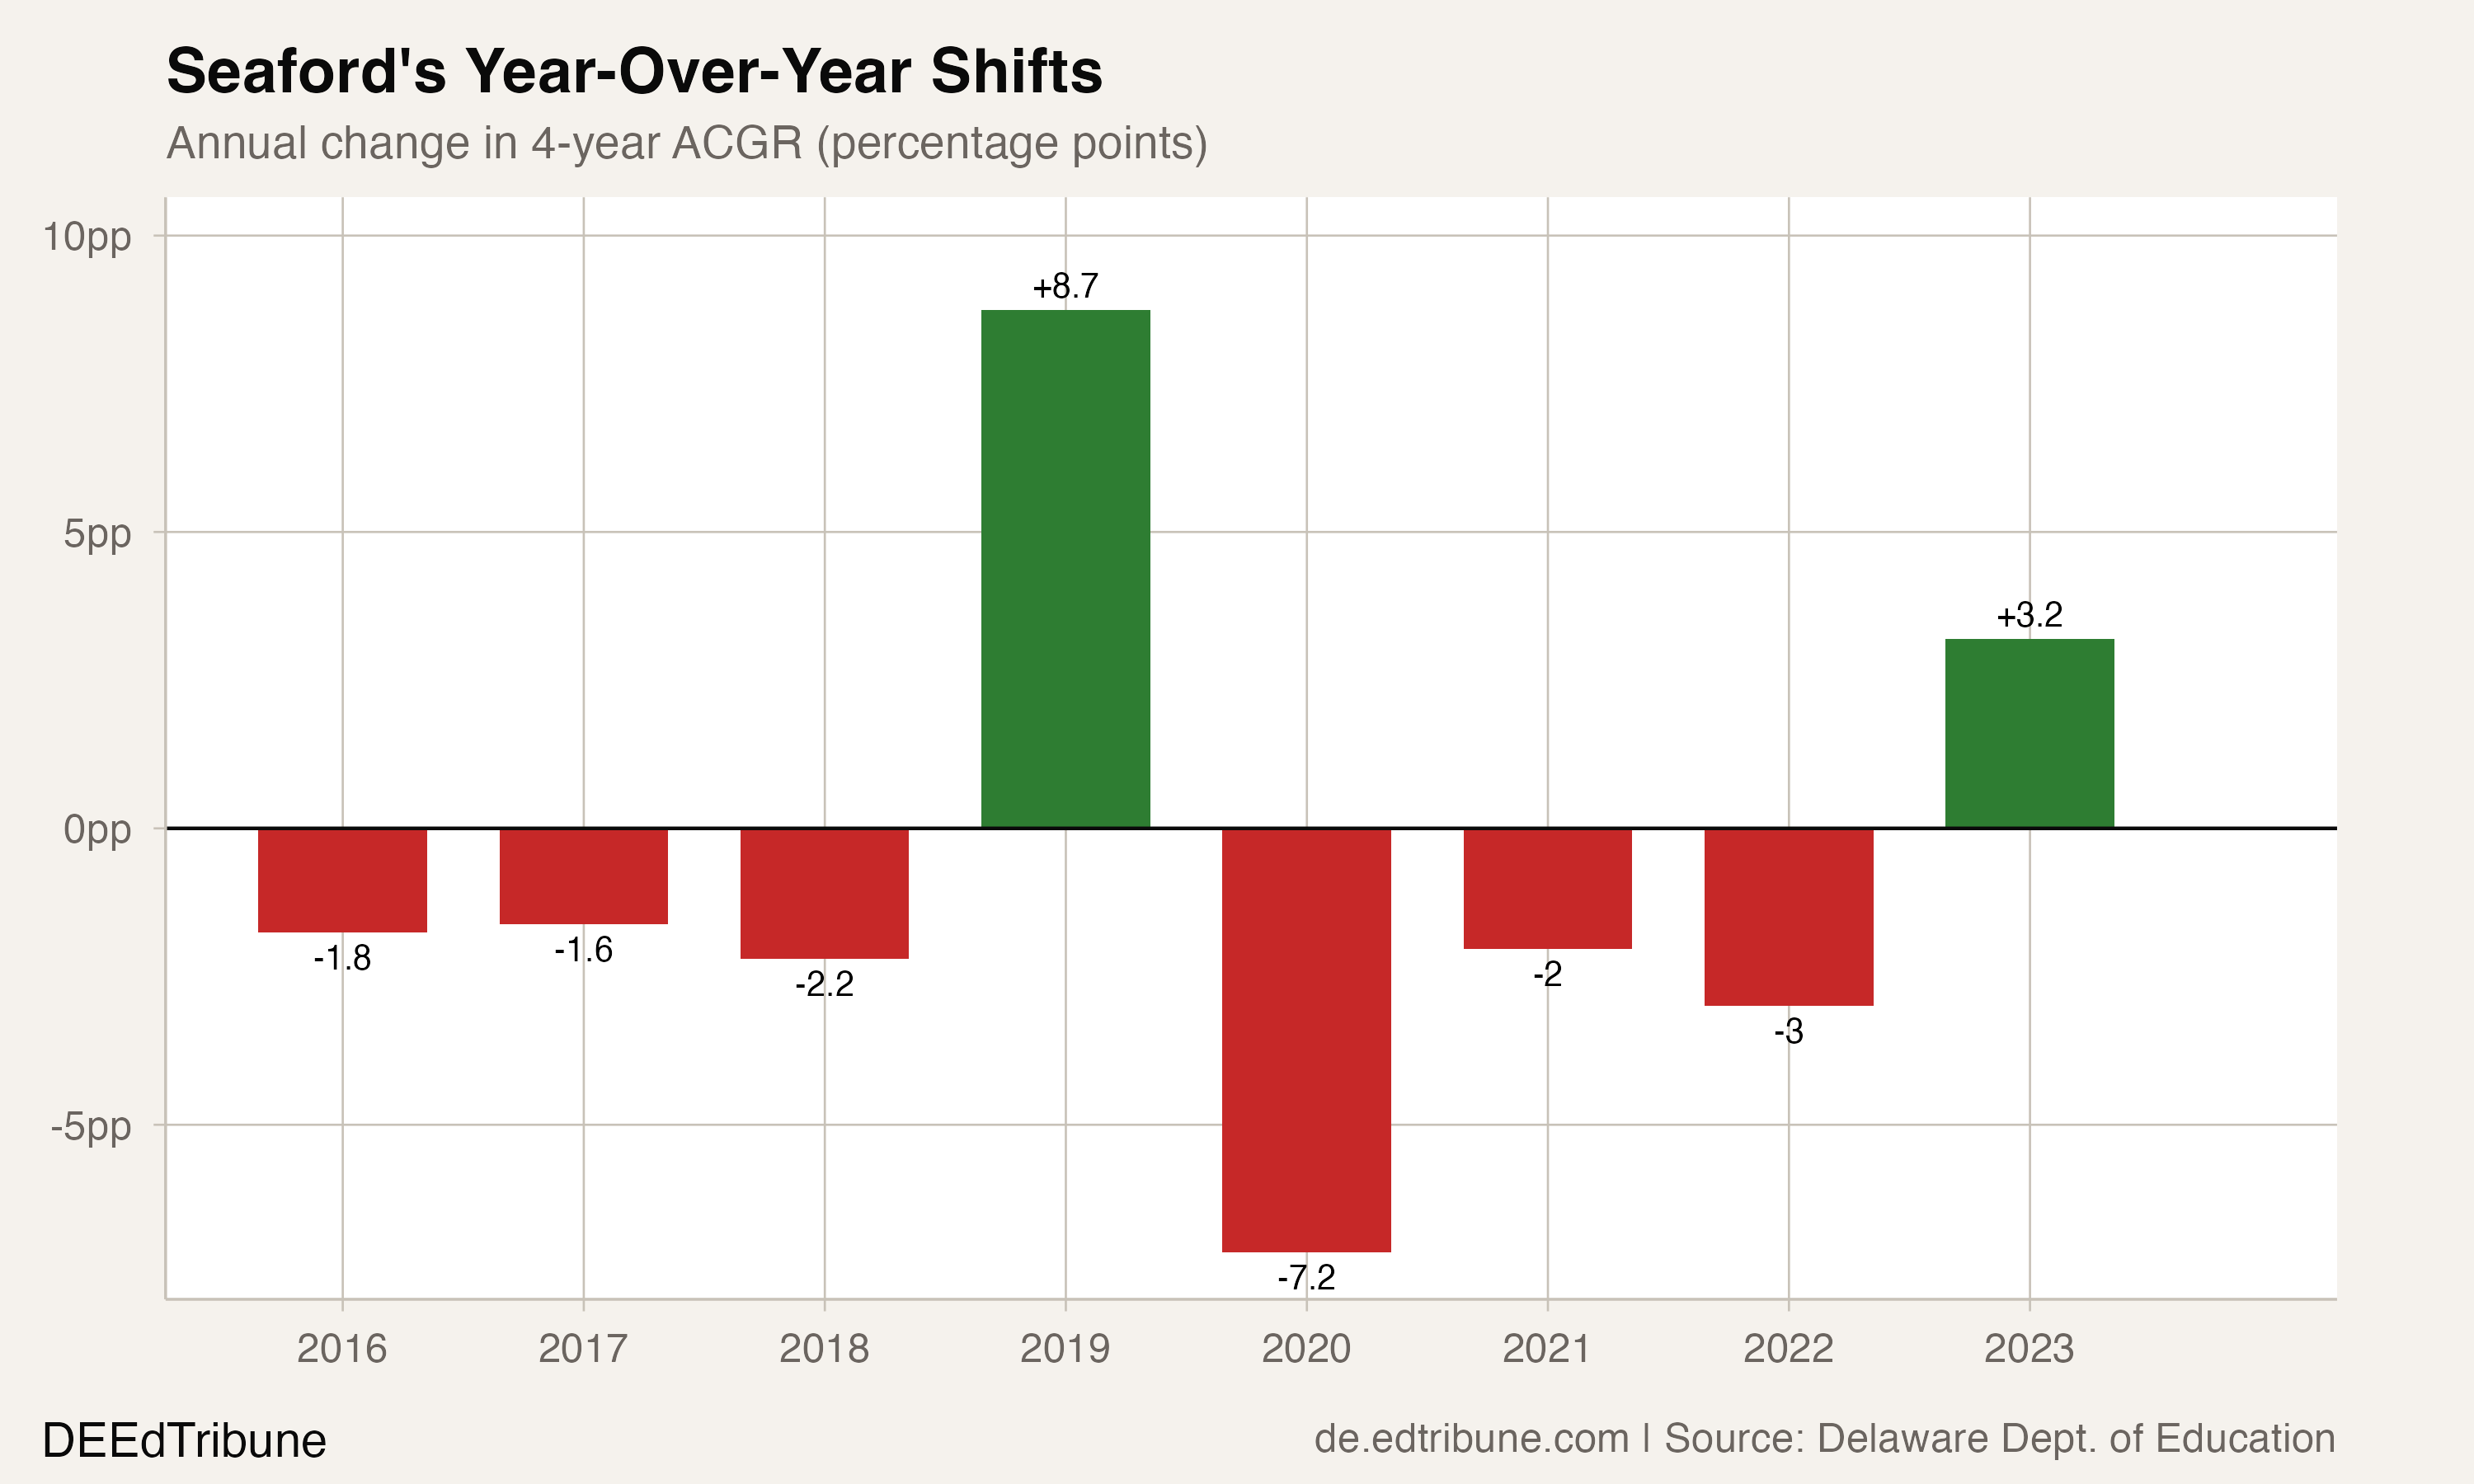
Seaford's rate does not decline steadily. It lurches. The year-over-year changes since 2016 range from an 8.7-point gain (2019) to a 7.2-point loss (2020). No other Delaware district shows this degree of annual swing, which suggests the rate is sensitive to relatively small changes in a cohort of around 200 students.

Seaford's year-over-year changes in graduation rate

The 2023 cohort of 250 students was the largest in the dataset, up from 208 in 2015. A growing cohort with a falling rate means more students, in absolute terms, are not completing high school on time.

Race and poverty

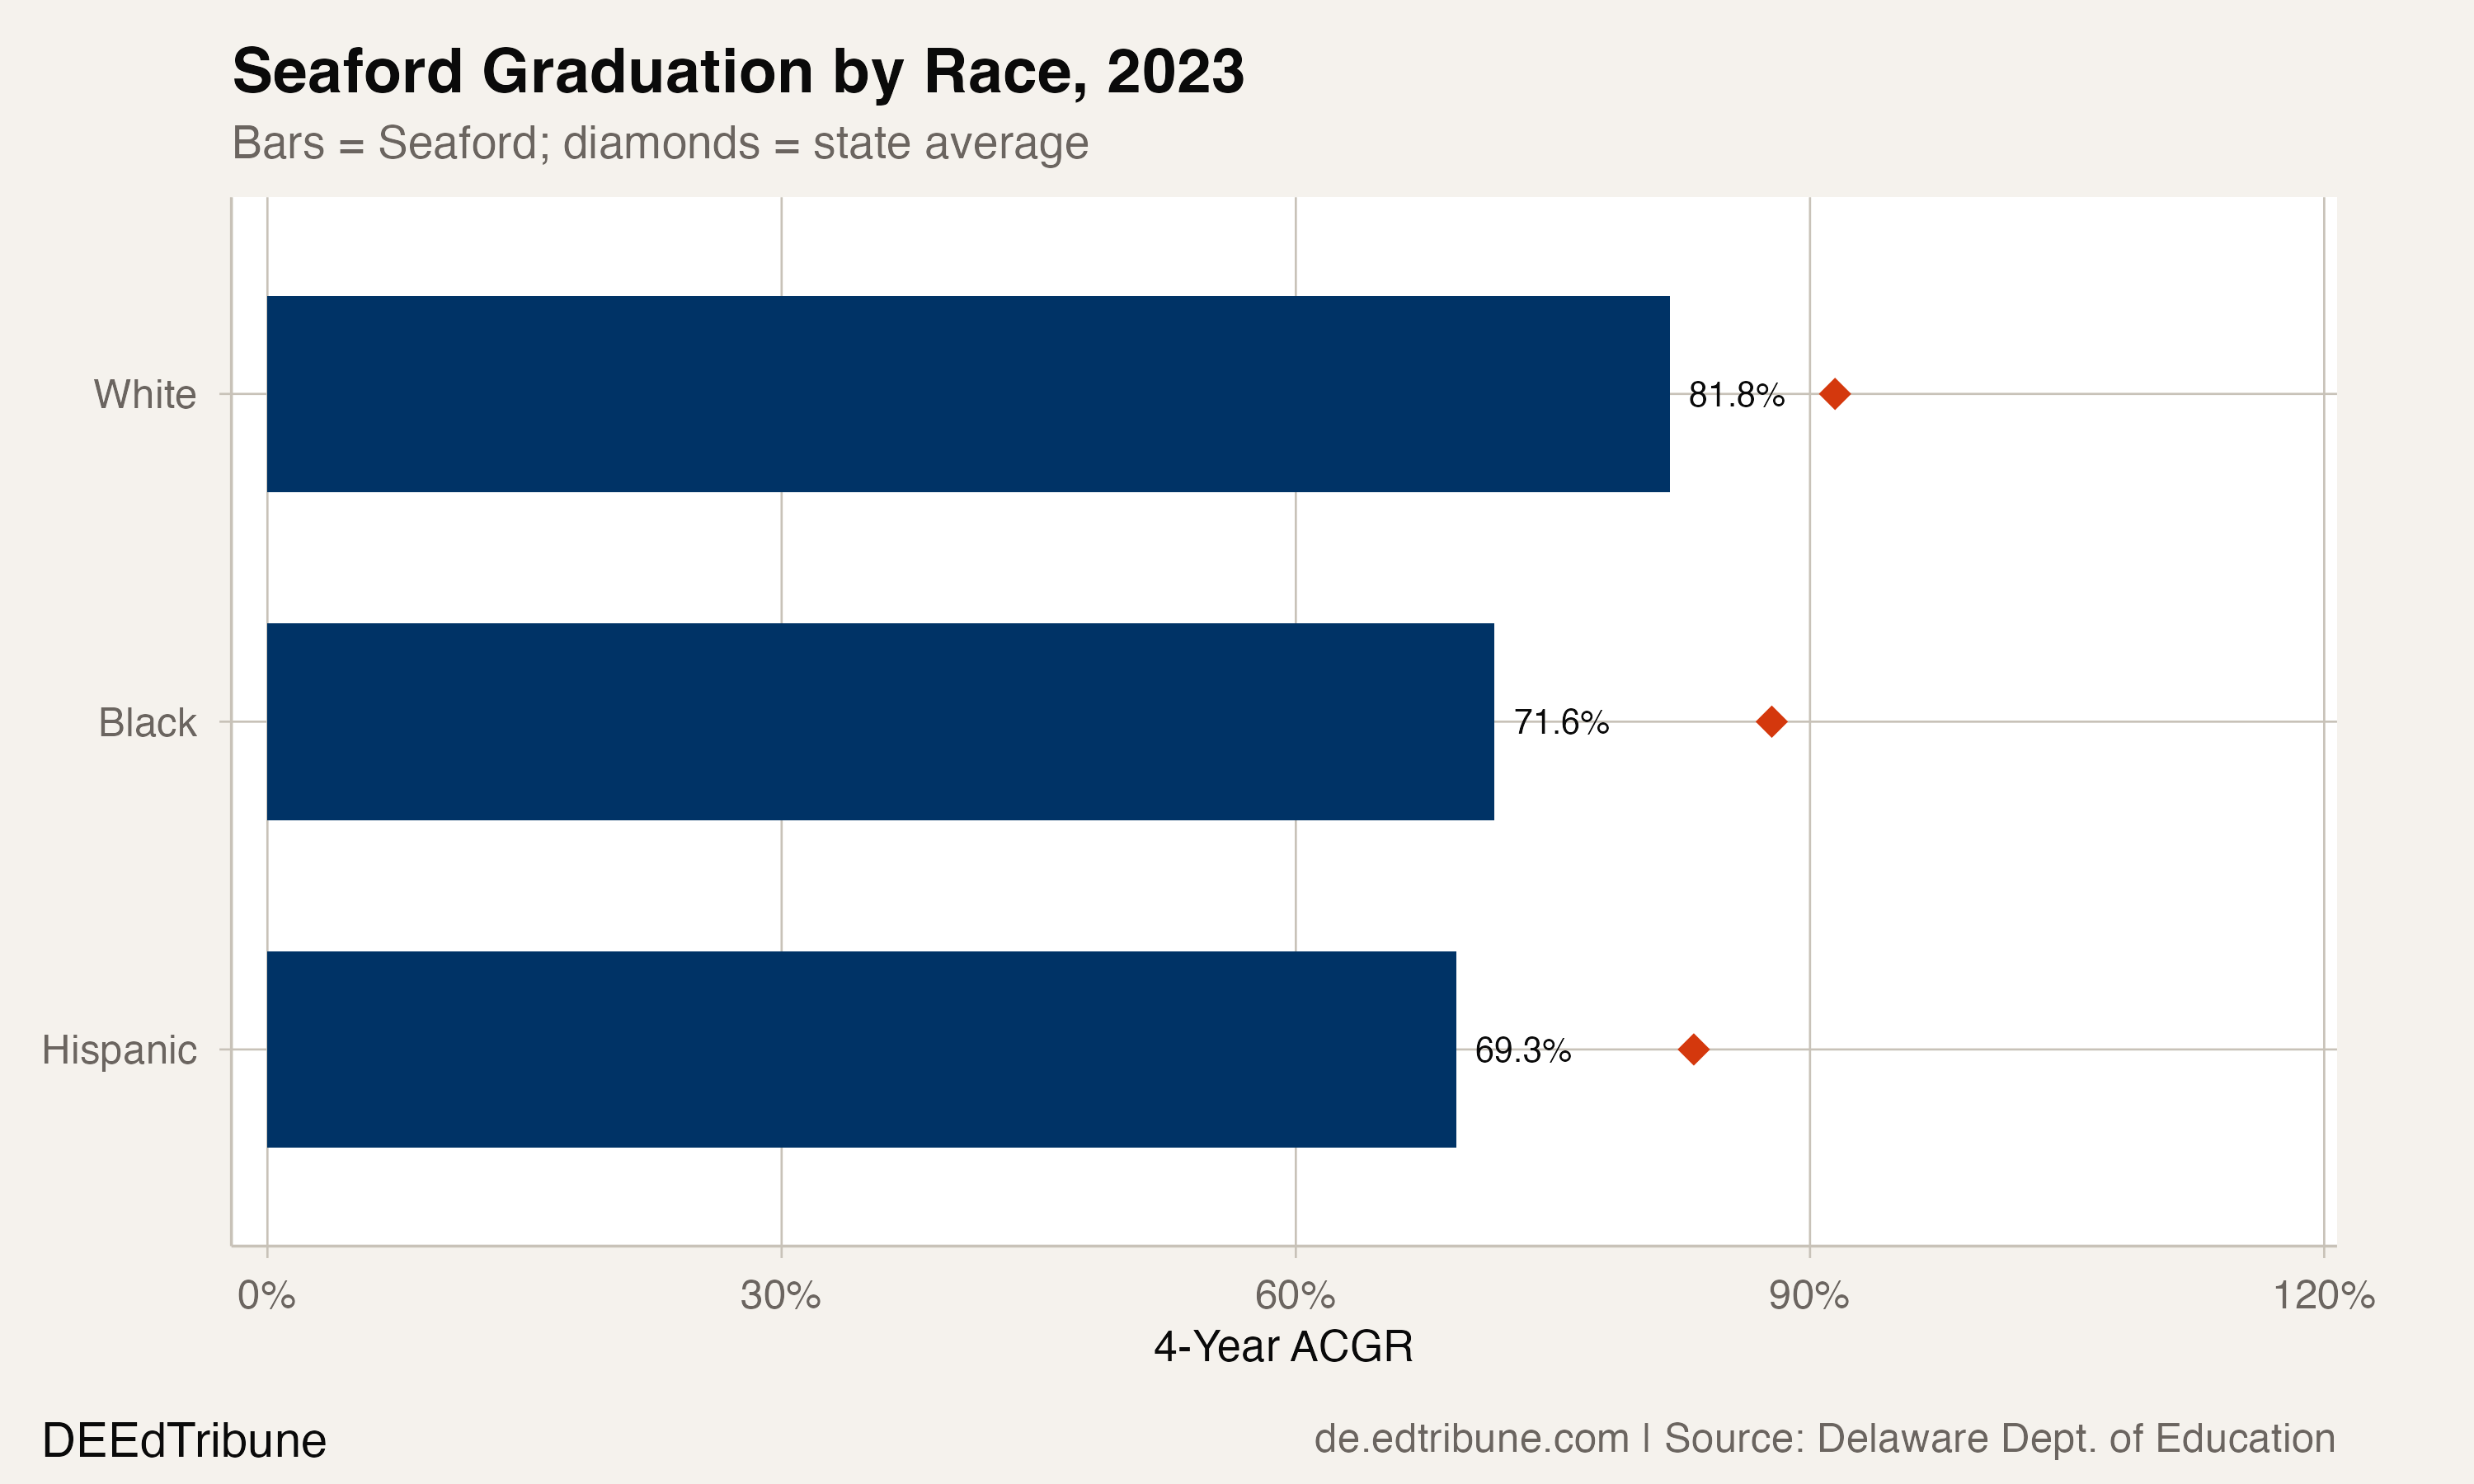
In 2023, white students in Seaford graduated at 81.8%, Black students at 71.6%, and Hispanic students at 69.4%. That 12.4-point gap between white and Hispanic students is notable because it has reversed: in 2015, Hispanic students graduated at 81.3%, slightly above the white rate of 80.8%. The Hispanic rate has since dropped 11.9 points.

Seaford graduation rates by race, 2023, compared to state averages

The state averages for each group, shown as diamonds in the chart, illustrate how far Seaford trails. Every racial group in Seaford graduates at a rate well below its statewide counterpart.

The economic dimension compounds each of these gaps. Economically disadvantaged students in Seaford graduated at 64.2% in 2023, down from 77.6% in 2015. That 13.4-point decline is steeper than the overall rate's drop and represents the single largest deterioration in any subgroup. In a district where 43% of high school students qualify for free lunch, this subgroup's trajectory drags the district average down structurally.

English learners, a growing population in a poultry-processing community, graduated at 66.7% in 2023. Students with disabilities graduated at 62.3%. Both figures improved slightly from 2022, but remain far below the district's overall rate.

What the test scores already showed

Seaford's graduation rate does not exist in isolation. At Seaford Senior High, math proficiency runs between 10% and 14%, roughly half the state average. Reading proficiency sits between 25% and 29%, also below the statewide mark. A high school where barely one in 10 students demonstrates grade-level math competency is a school where the academic pipeline feeding graduation has fundamental gaps.

The district operates with a student-teacher ratio of 17:1, higher than the state average of 14:1, and per-pupil spending of $15,544, below the state median of $18,388. Whether those resource constraints directly contribute to the graduation decline is difficult to isolate, but they define the operational environment in which Seaford is trying to reverse it.

New leadership, same trajectory

In August 2023, the Seaford Board of Education appointed Dr. Sharon DiGirolamo as superintendent. Dr. DiGirolamo had served as the district's Director of Special Education since 2015 and Assistant Superintendent since 2020, making her an insider who has watched the graduation decline from within the system.

"I'm delighted to continue on my path with the Seaford School District as the new Superintendent; I will lead, learn, collaborate, and serve to the best of my ability." -- Dr. Sharon DiGirolamo, 47abc, August 2023

Whether internal continuity or an outside perspective is what Seaford needs is an open question. The district's brief recovery in 2019 shows the rate can move quickly in a small cohort. But the structural indicators, from test scores to poverty rates to the widening gender gap, suggest the 2019 spike was the anomaly, not the baseline.

The 2024 graduation data, when it arrives, will show whether the 3.2-point uptick in 2023 was the beginning of a recovery or another false start in a district that has produced more of those than real turnarounds.

Detailed code that reproduces the analysis and figures in this article is available exclusively to EdTribune subscribers.

Discussion

Loading comments...