Correction (July 21, 2026): The original article included Great Oaks economic-disadvantage figures that the current Delaware state package does not return. It also treated aggregate rates as individual probabilities and used external figures and causal explanations that the attendance file cannot verify. This version removes those claims, corrects the Black-student comparison for East Side, and rebuilds the article and ledger from fresh package output.
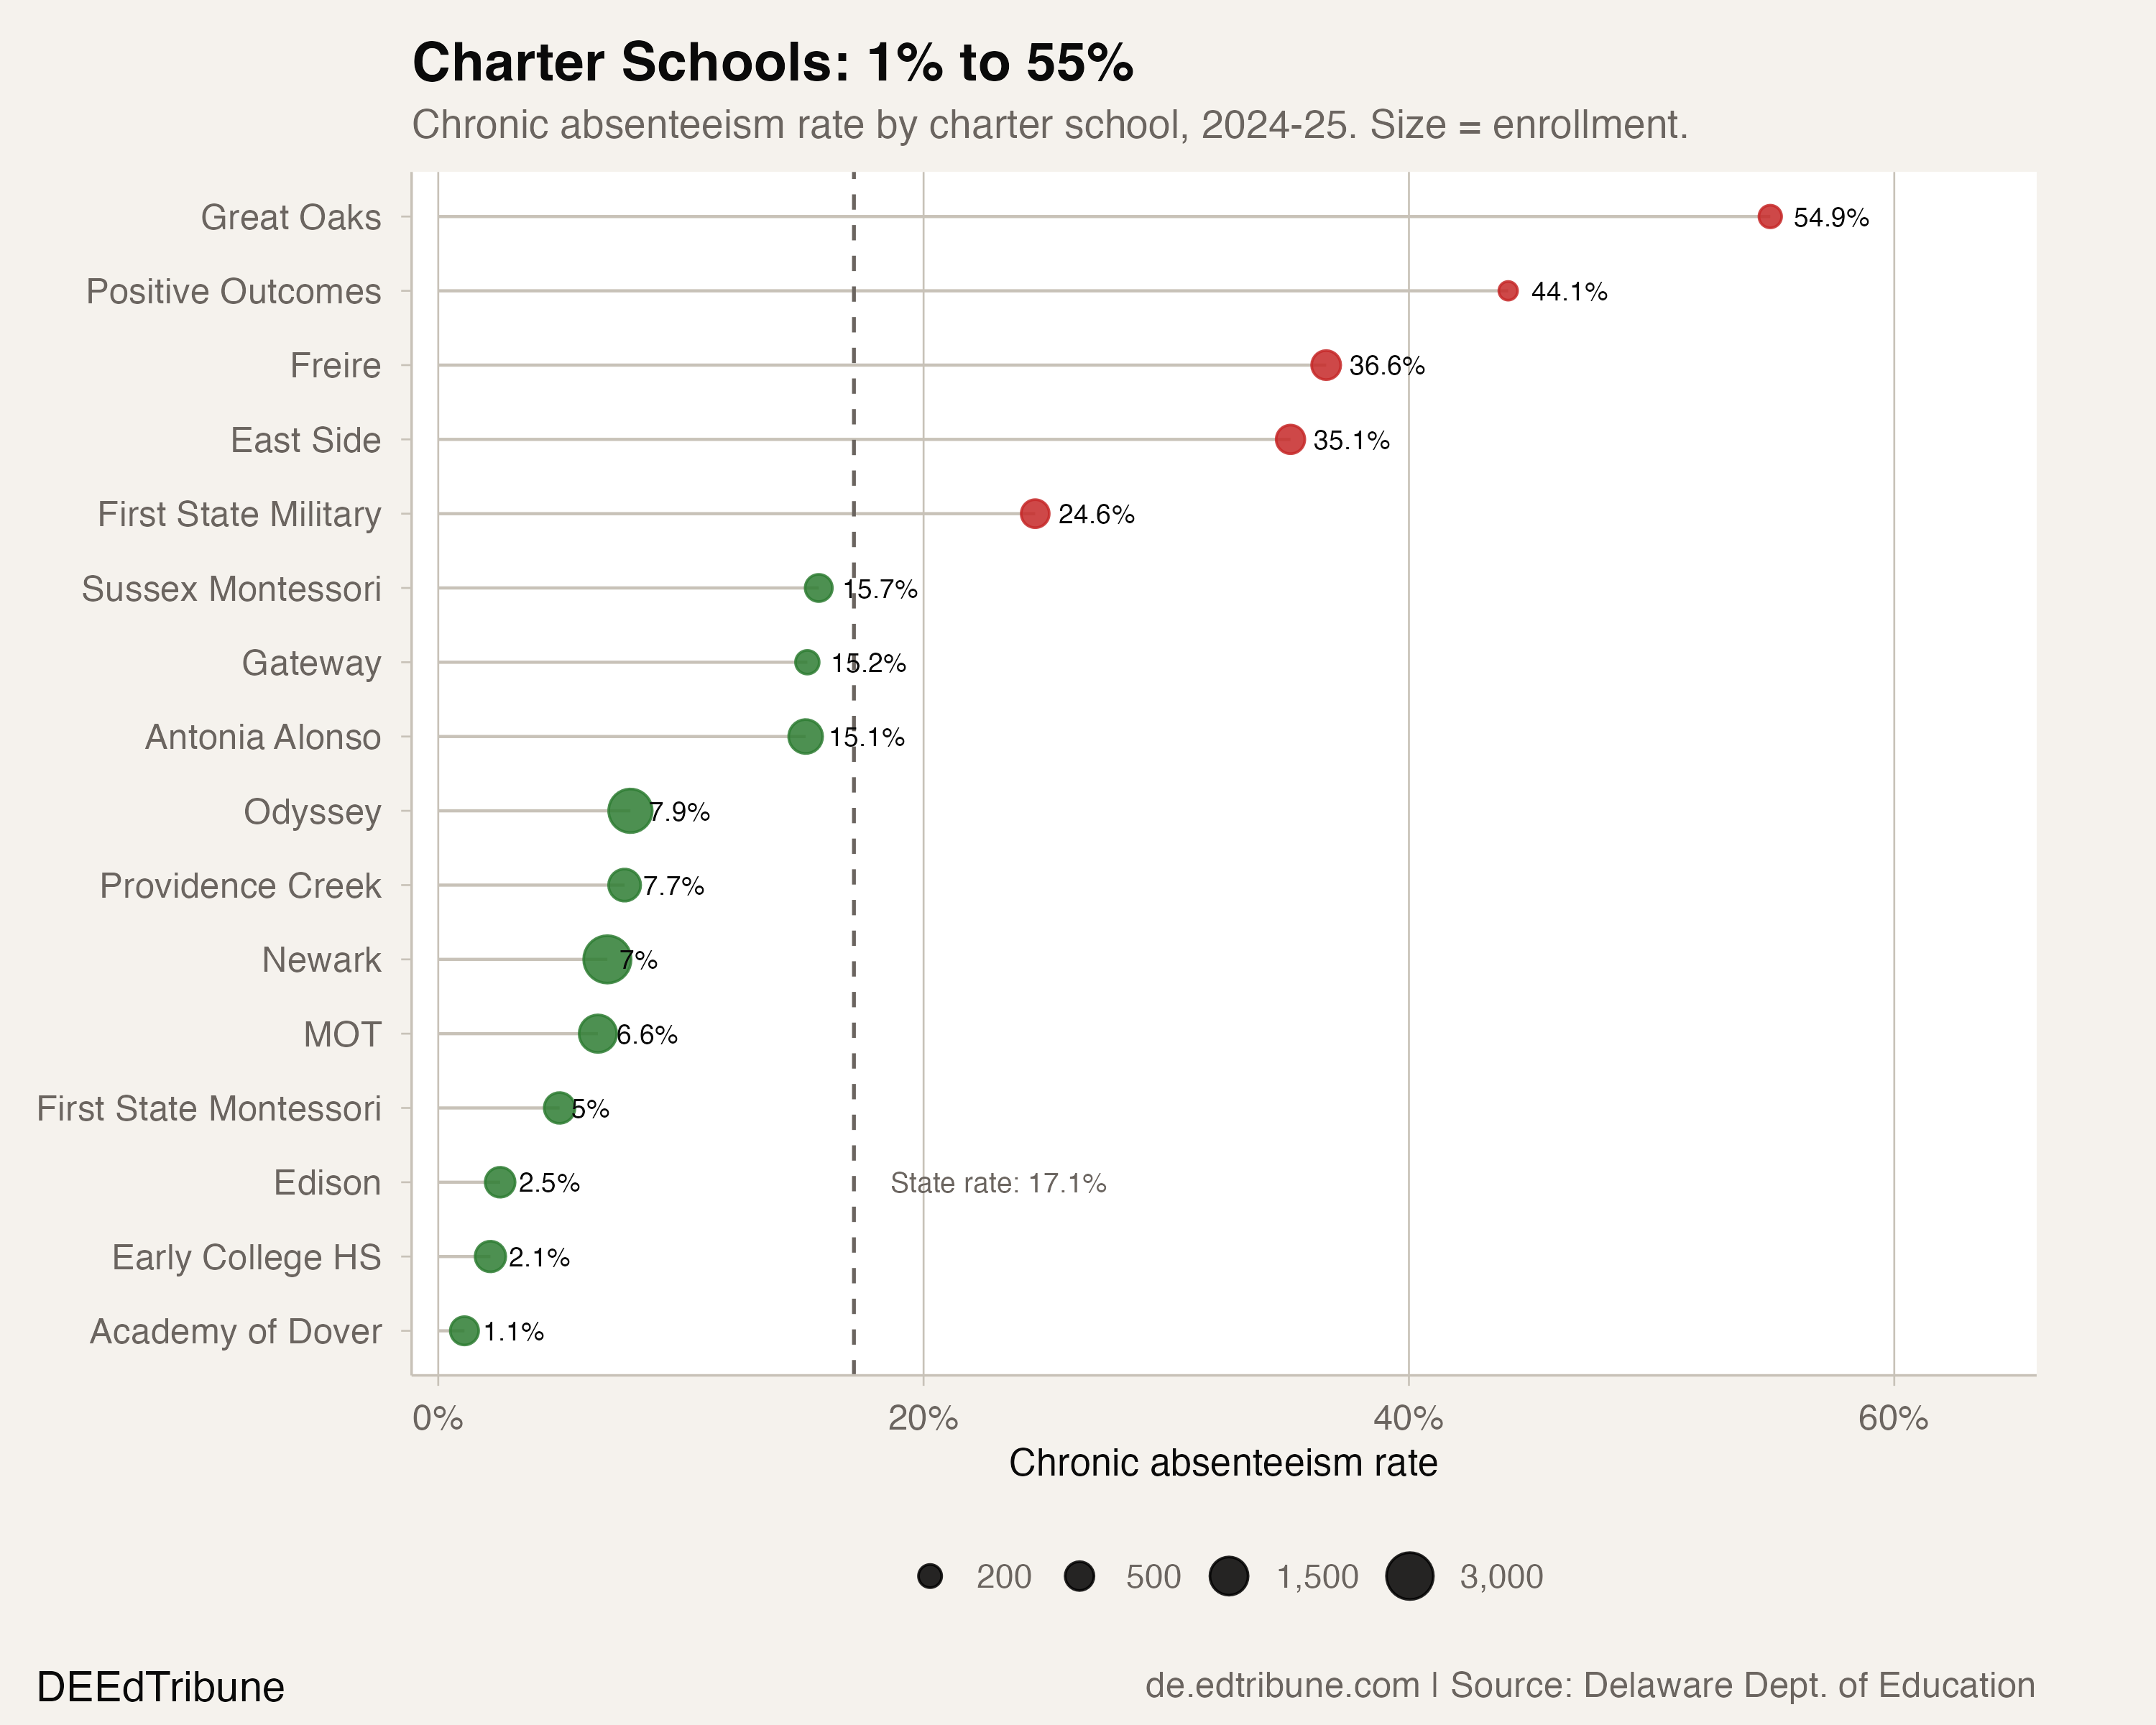
Academy of Dover Charter School↗ET posted a 1.1% chronic absenteeism rate in 2024-25: five of 461 students. Across Wilmington, Great Oaks Charter School↗ET posted 54.9%, or 101 of 184 students.
The 53.8 percentage-point gap between the two schools was more than twice the 22.6-point range across Delaware's 22 traditional districts. The result is not a single charter-sector pattern. It is a distribution with unusually distant ends.
The measurement problem
The unweighted mean chronic absenteeism rate across Delaware's 16 charter schools with 2025 data is 17.6%, compared to 15.3% for 22 traditional districts. By that measure, charters perform worse.
The median points the other way: 11.5% for charter schools and 15.7% for traditional districts.
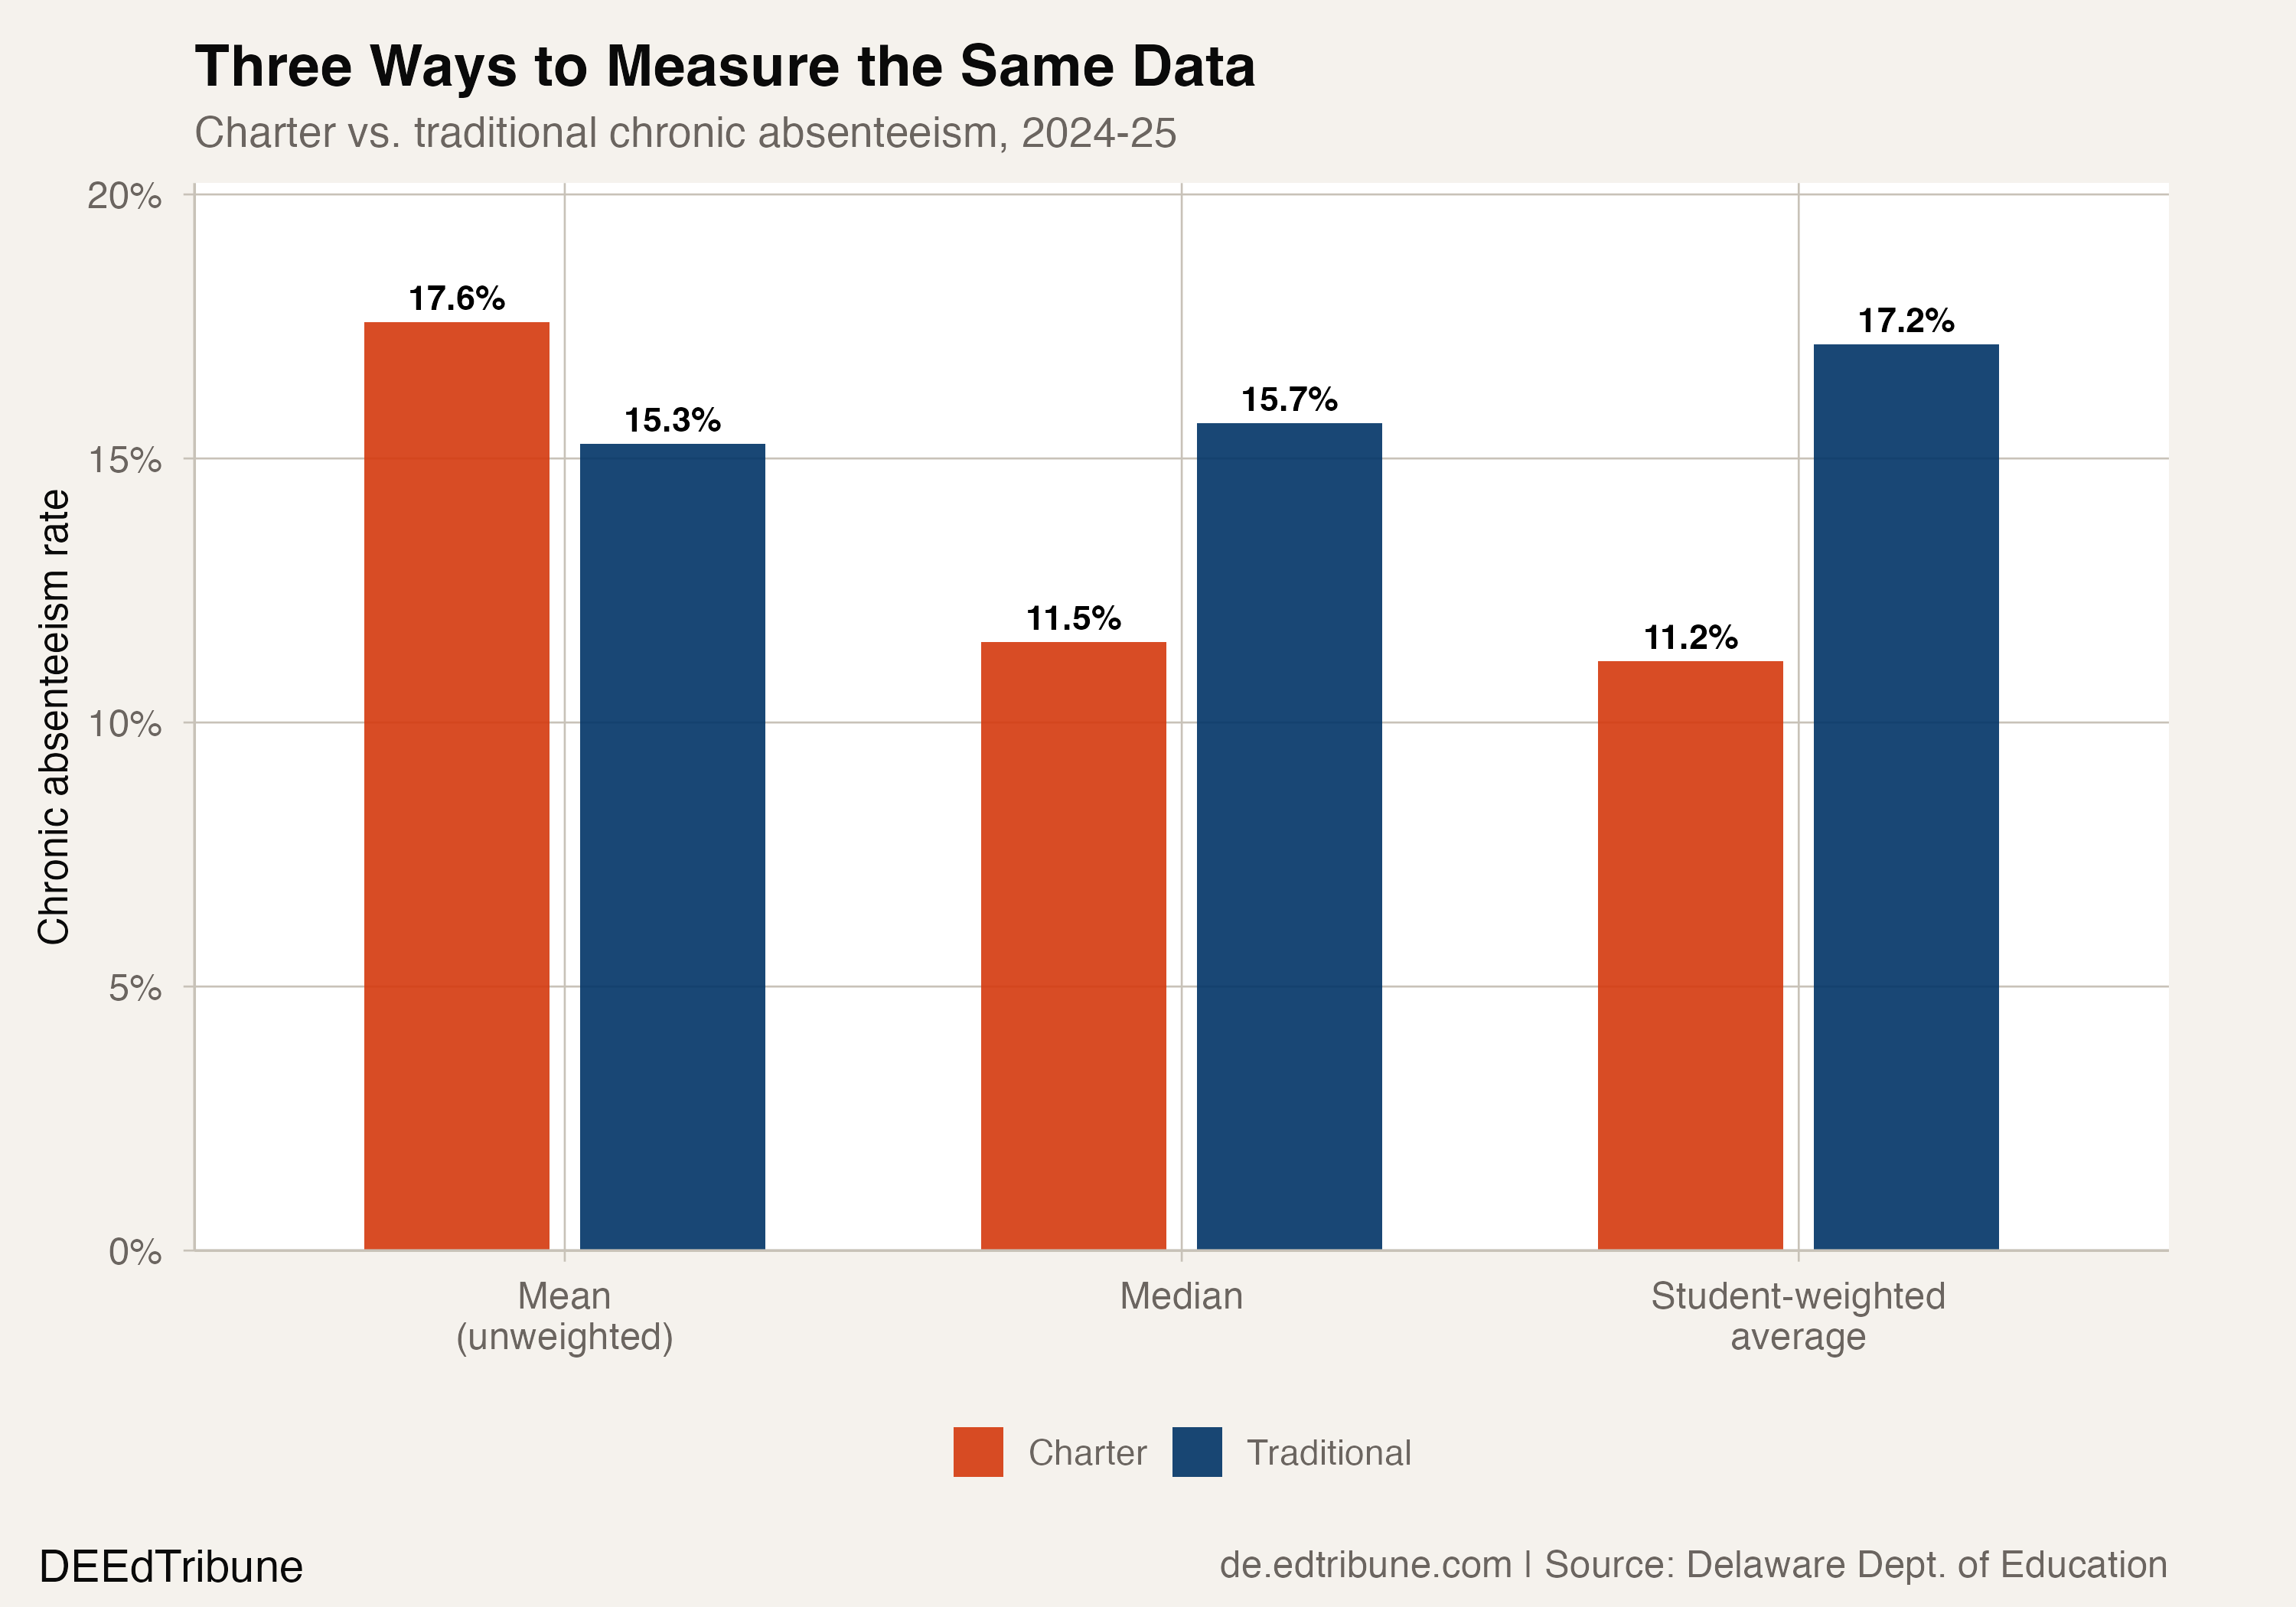
Weighting the same district-level rates by enrollment produces 11.2% for charter schools and 17.2% for traditional districts. The largest charters had comparatively low rates: Newark Charter↗ET enrolled 3,114 students and reported 7.0%, Odyssey Charter↗ET enrolled 2,375 and reported 7.9%, and MOT Charter↗ET enrolled 1,414 and reported 6.6%. These are aggregate school rates, not evidence about the probability for otherwise comparable individual students.
The mean is distorted by four small schools that enroll 1,317 students combined, less than 10% of charter enrollment, but post rates above 30%.
Where the extremes sit
Eight charter schools posted chronic absenteeism rates below 10% in 2025, including five below 8%. Their combined enrollment is 10,043 students.
At the other end, four charters exceeded 30%: East Side Charter↗ET (35.1%, 484 students), Freire Charter School Wilmington↗ET (36.6%, 522 students), Positive Outcomes Charter School↗ET (44.1%, 127 students), and Great Oaks↗ET (54.9%, 184 students). These four schools enroll 1,317 students.
Great Oaks reported 157 Black students, with a 59.2% chronic absenteeism rate. Its special-education row covered 66 students and reported 54.6%. Edison Charter↗ET reported 563 Black students and a 2.5% rate for that subgroup. East Side reported 454 Black students and a 35.7% subgroup rate. These comparisons show that similarly labeled aggregate subgroups can have very different school-level results; they do not establish why.
The charter distribution was usually wider
Across the 10 reporting years from 2015 through 2025, excluding the missing 2020 series, the standard deviation of charter-school rates averaged 13.8 percentage points. The traditional-district average was 6.8. Charter rates had the larger standard deviation in nine of those 10 years.
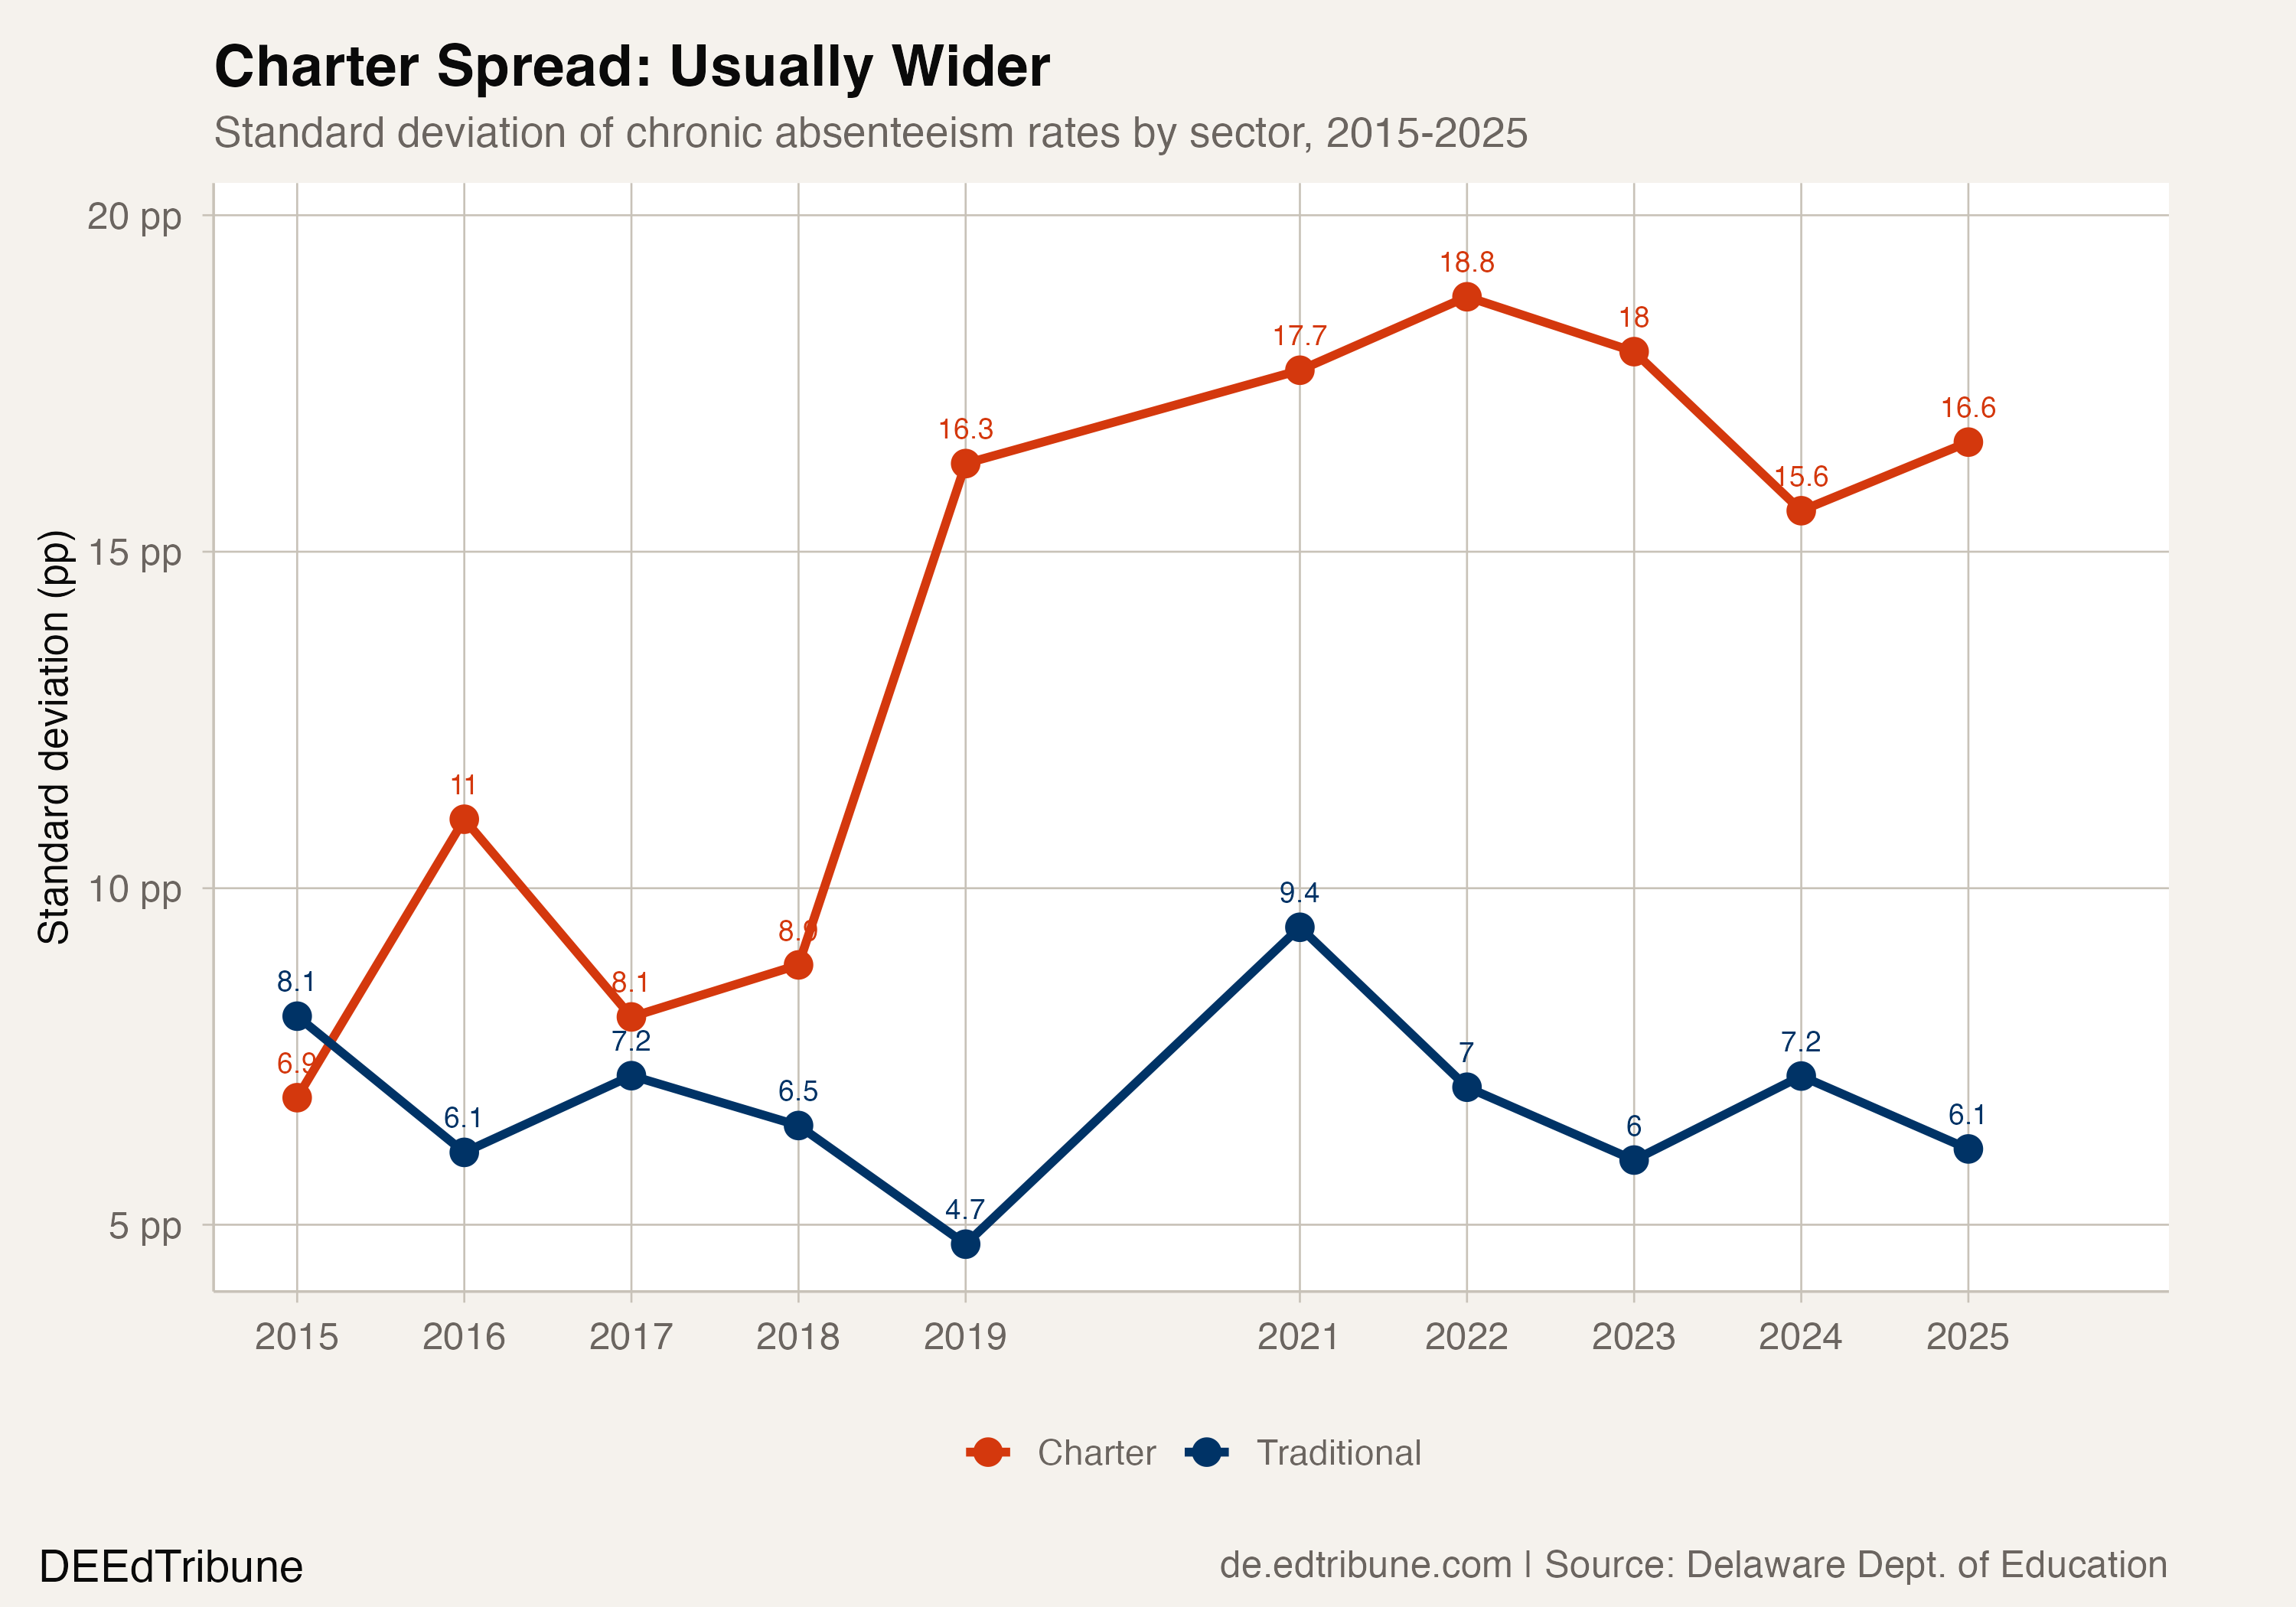
In 2025, the charter standard deviation was 16.6 points, compared with 6.1 for traditional districts. The interquartile ranges were 21.0 and 8.1 points, respectively. Those statistics establish a wider distribution, not its cause.
Great Oaks: a rebound in absenteeism
The package records Great Oaks with 232 students and a 26.7% rate in 2016. Enrollment peaked at 467 in 2018, when the rate was 33.8%. The rate reached 65.7% in 2022, fell to 38.8% in 2023 and 26.6% in 2024, then rebounded to 54.9% in 2025. That was its second-highest rate in the available series.
Enrollment fell to 184 in 2025, 60.6% below the 2018 peak. The latest count was 101 chronically absent students.
Three unusually large one-year drops
Academy of Dover↗ET fell from 23.9% in 2024 to 1.1% in 2025, a 22.9-point drop. Early College High School at Del State↗ET fell from 18.4% to 2.2%, a 16.3-point drop. Edison fell from 18.5% to 2.6%, a 15.9-point drop.
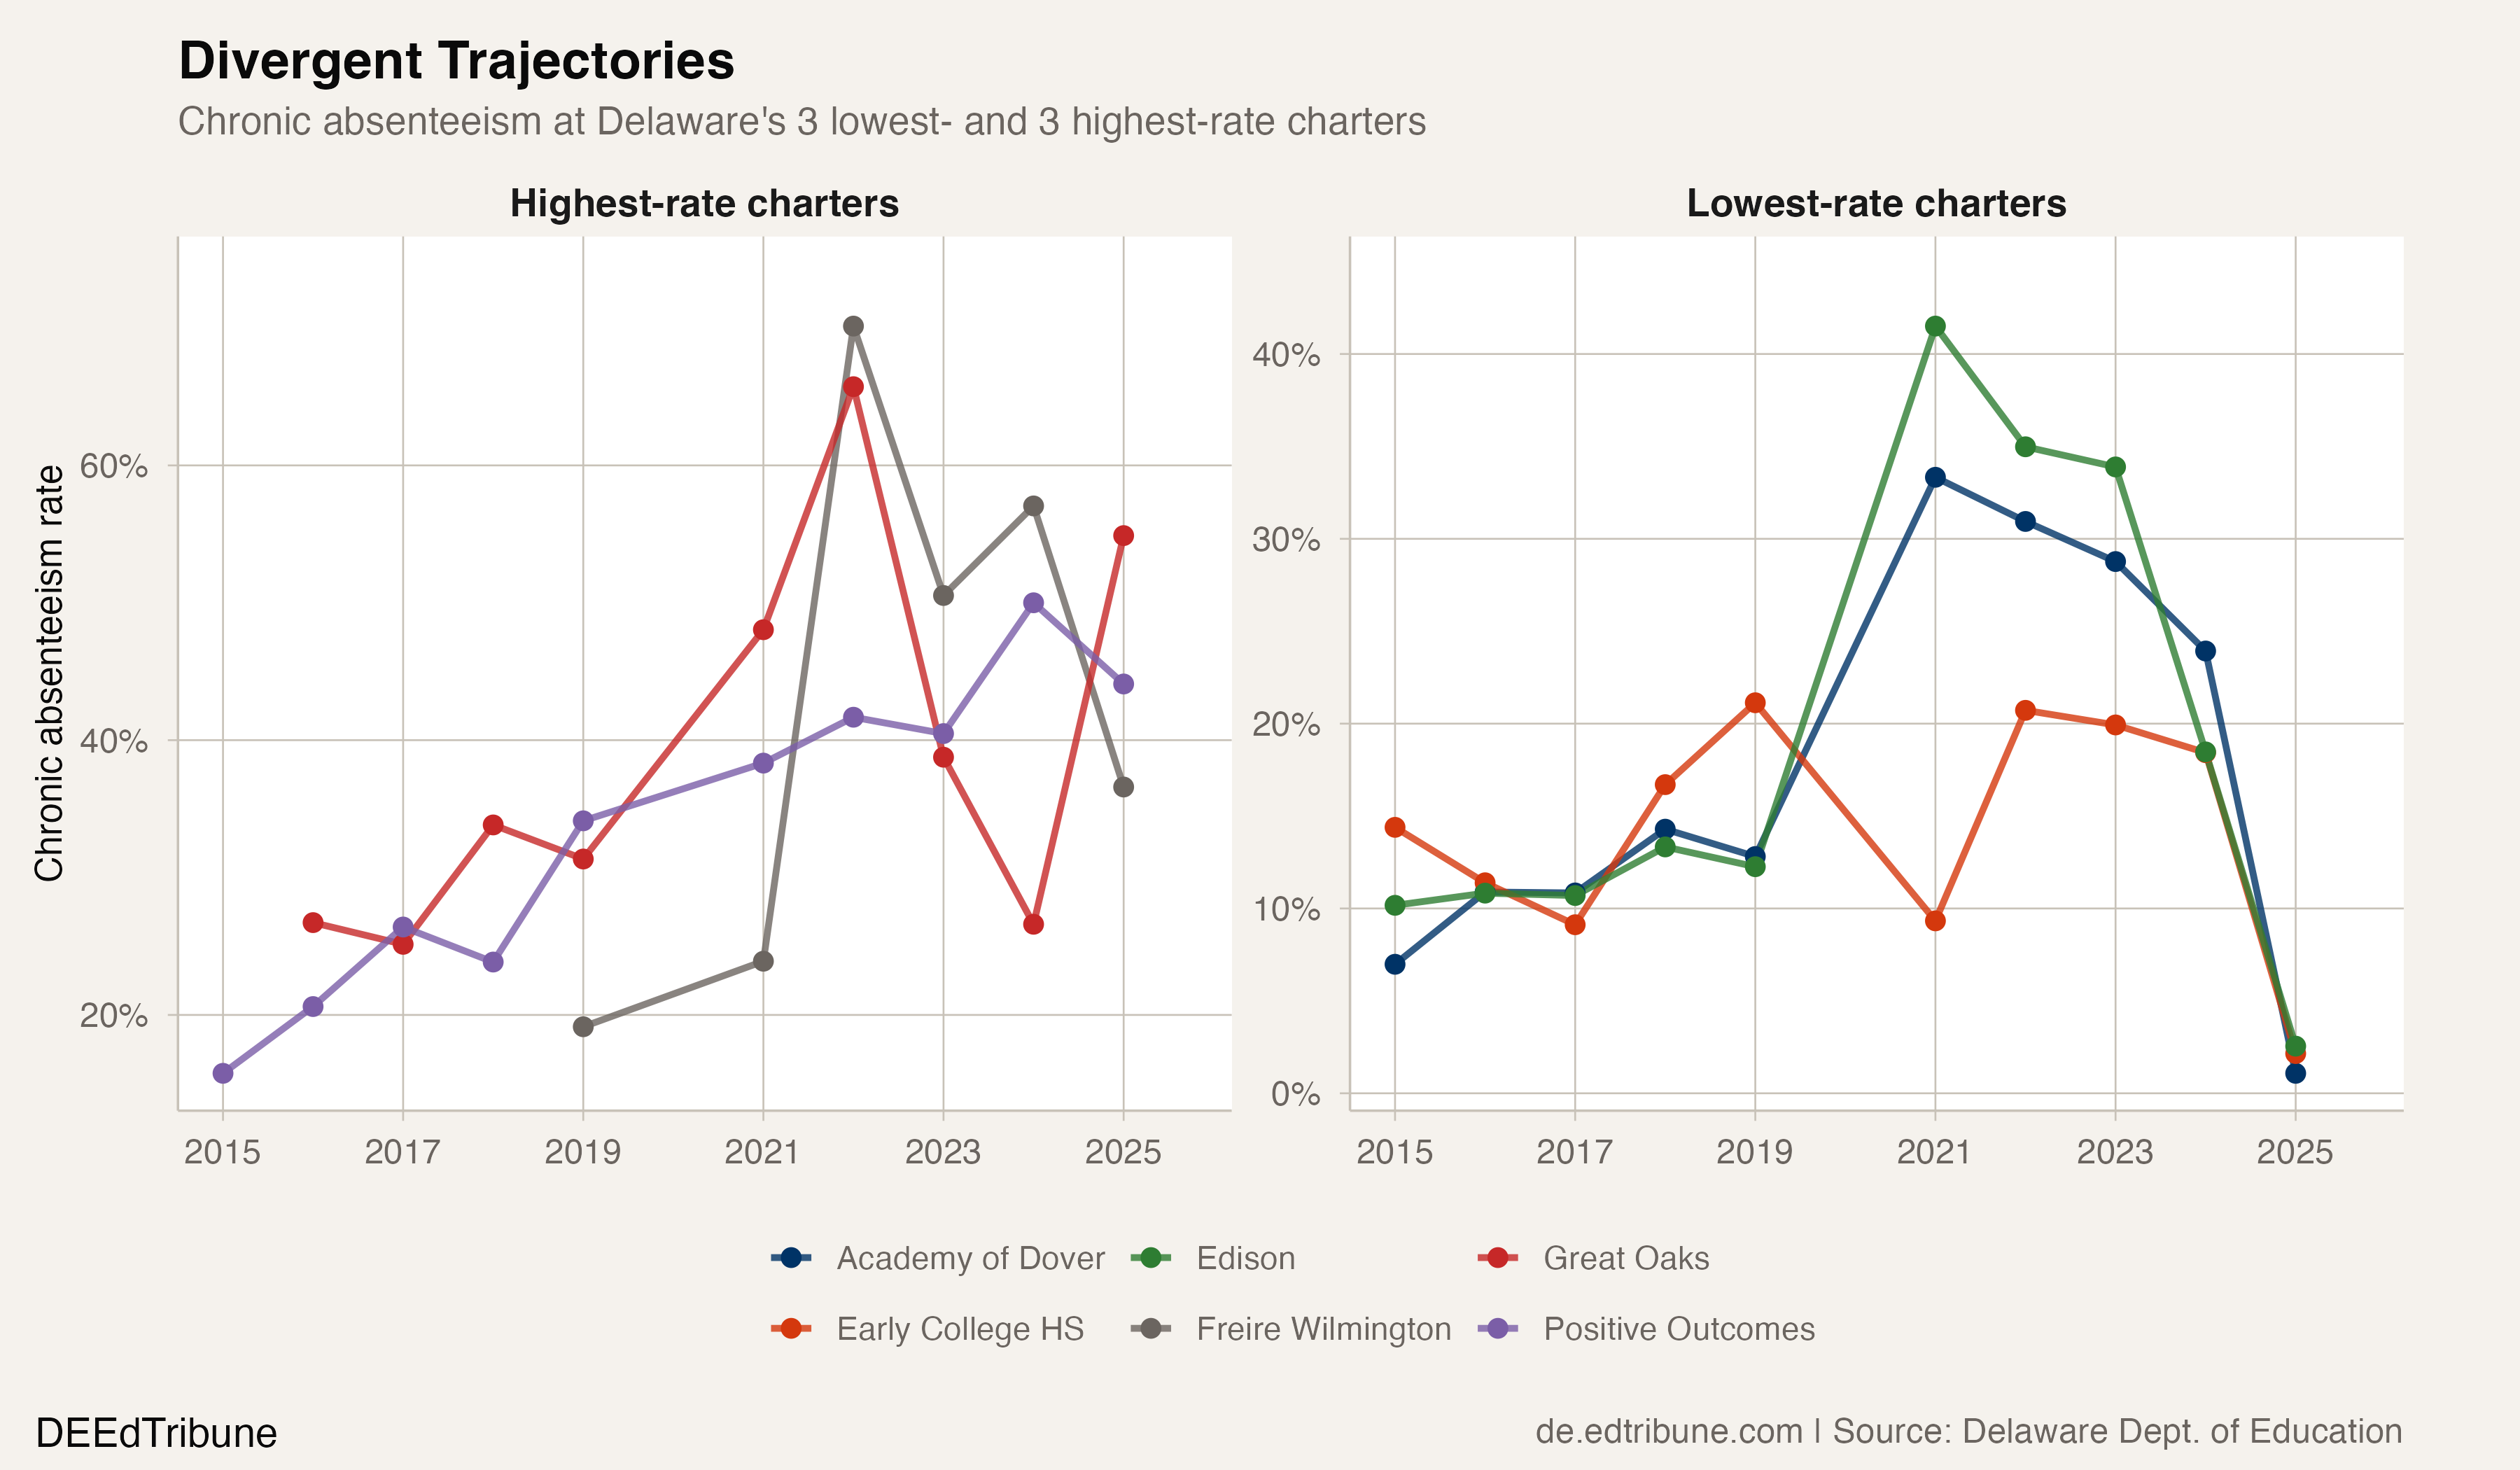
The package does not identify the mechanism behind those changes. They could reflect attendance changes, reporting changes or both. The safe conclusion is that the reported rates moved sharply and deserve confirmation against school-level records before being interpreted as program effects.
Other schools show sustained or multi-year high rates. Positive Outcomes exceeded 20% in every reporting year from 2016 onward and exceeded 40% in four reporting years from 2021 through 2025. Freire moved from 70.1% in 2022 to 36.6% in 2025. East Side moved from 78.2% in 2023 to 35.1% in 2025.
Sector summaries answer different questions
The 2025 statewide chronic absenteeism rate was 17.1%. Eleven of 16 charter schools, enrolling 11,620 students, were below it. Five, enrolling 1,760 students, were at or above it.
The charter sector's mean rate of 17.6% is an arithmetic fact. It captures a real thing: the simple average across entities. But as a description of charter school performance, it obscures more than it reveals. It treats a 3,114-student school with a 7.0% rate the same as a 127-student school with a 44.1% rate. It collapses a 53.8-point range into a single number.
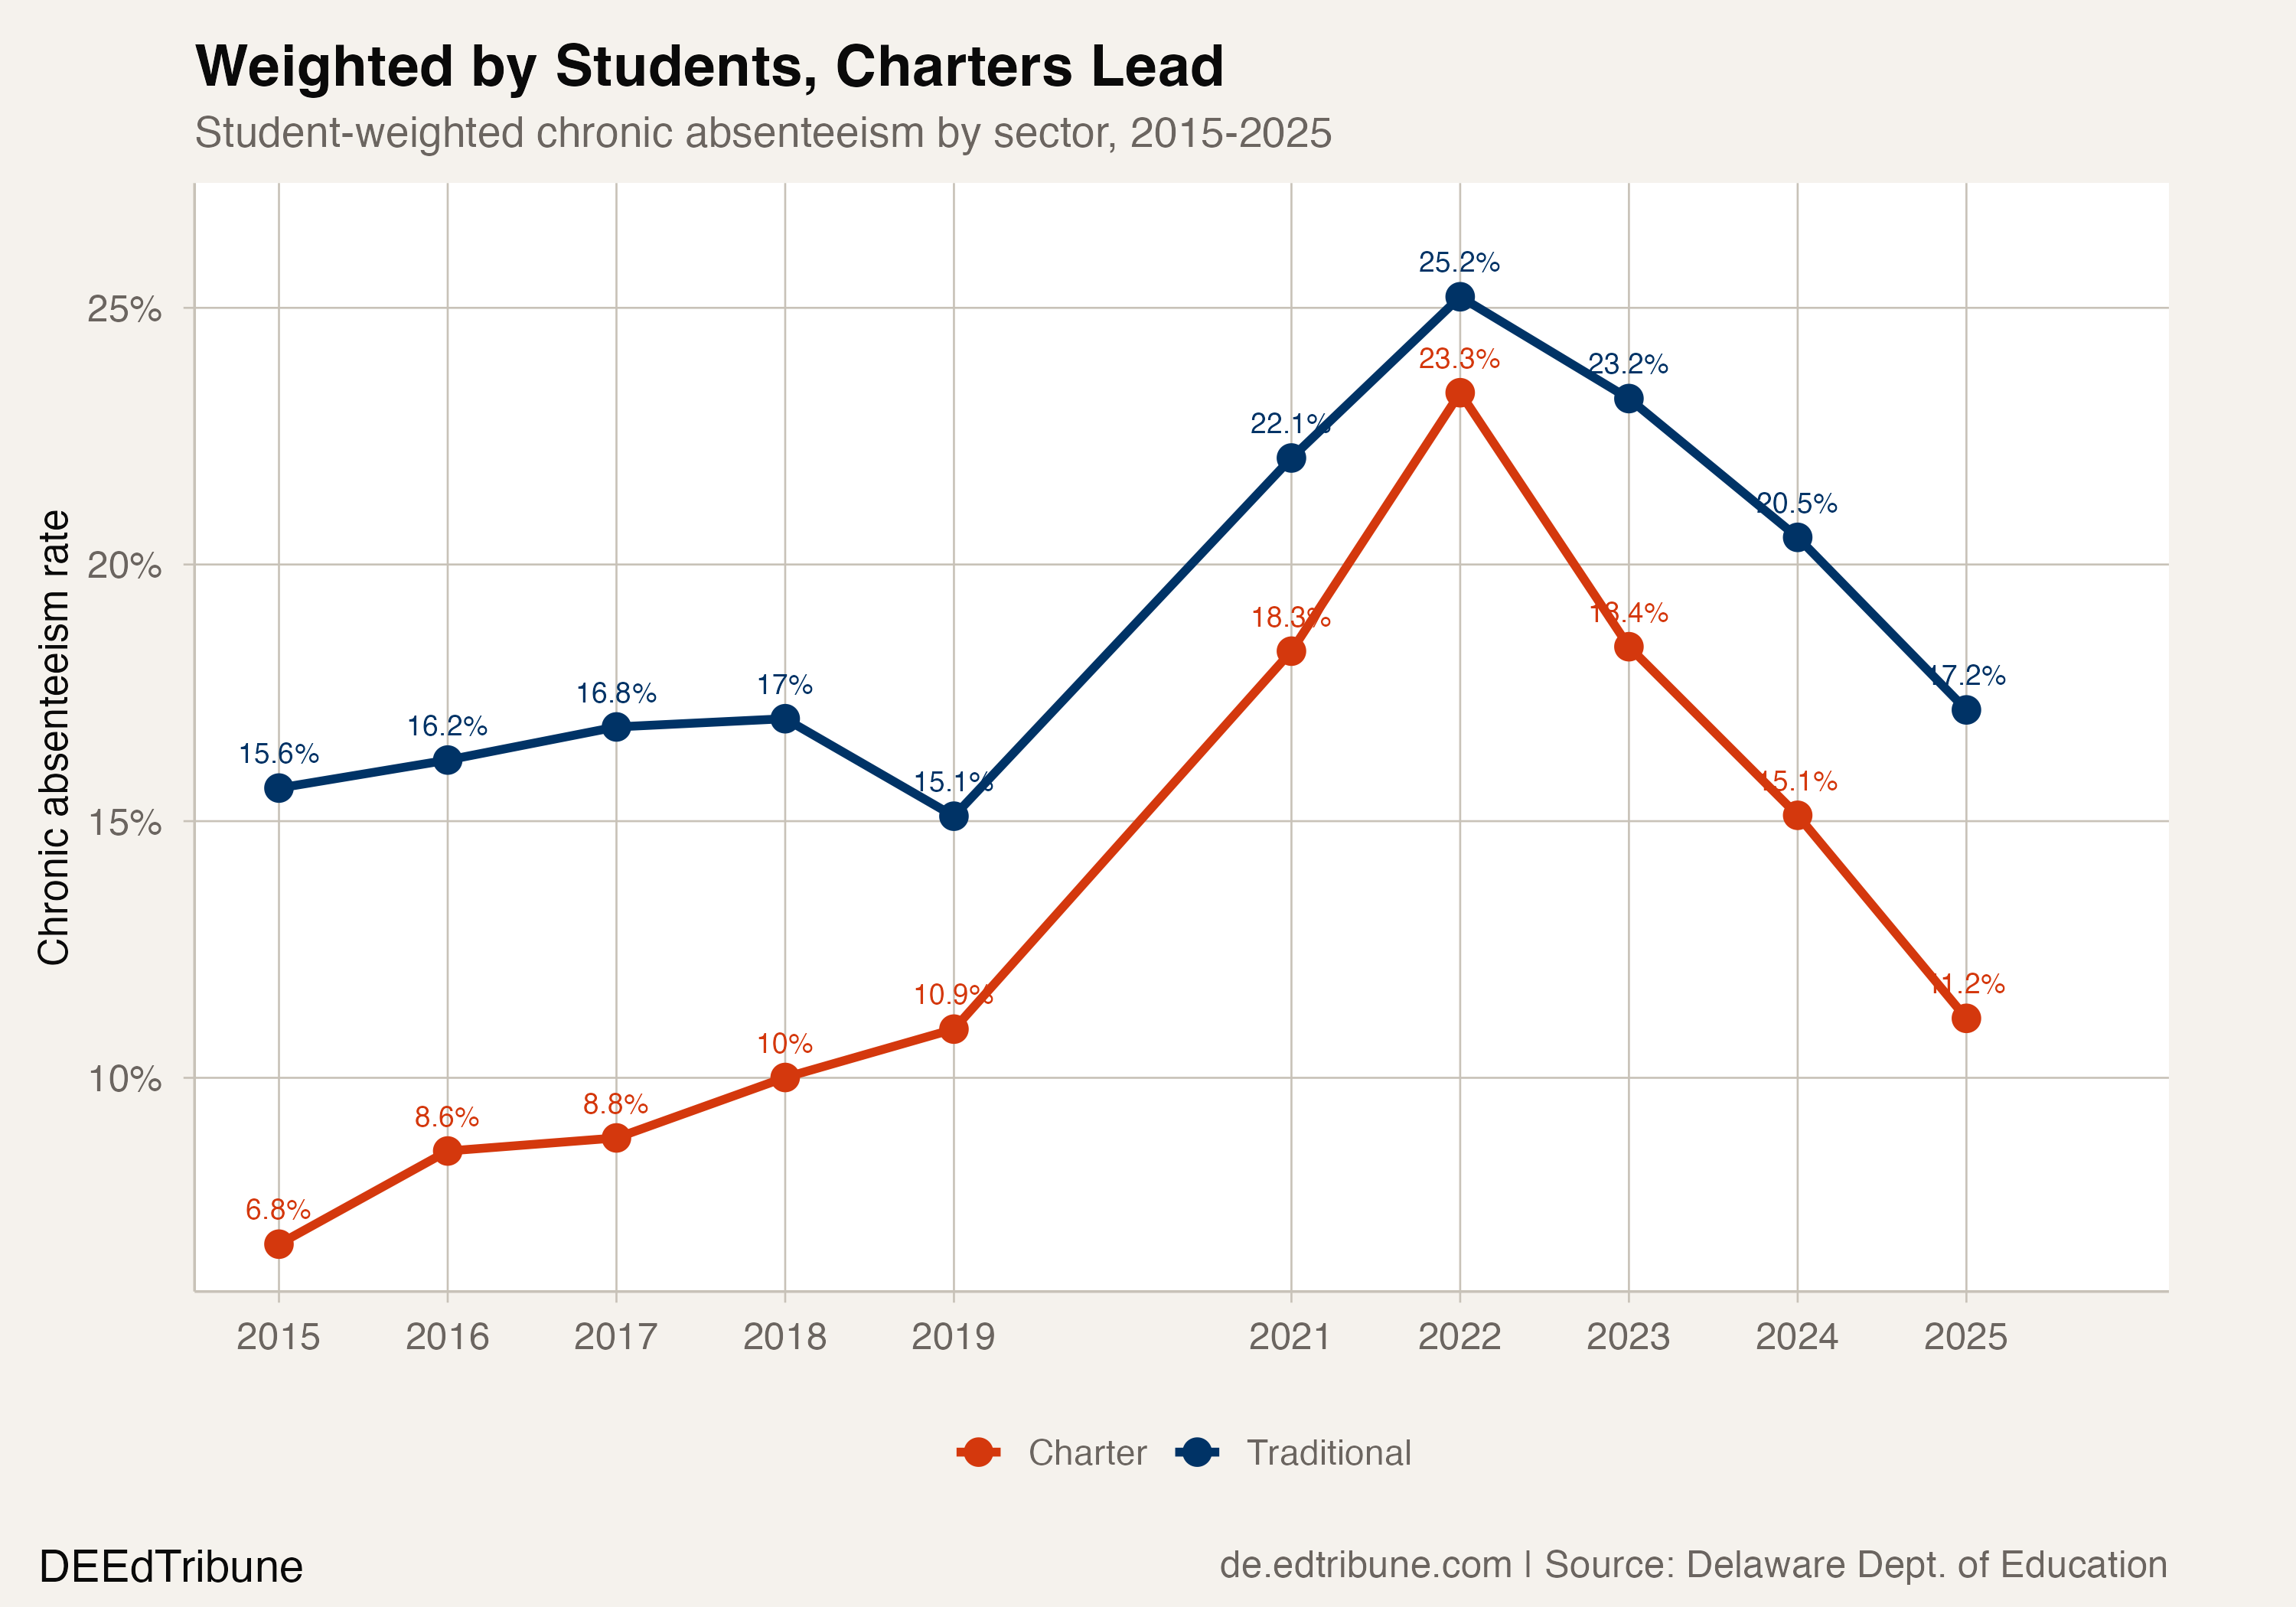
The student-weighted charter rate was below the student-weighted traditional rate in every available reporting year from 2015 through 2025. That pattern describes where enrolled students were counted; it does not isolate selection, school practice, reporting, student needs or any other mechanism.
Delaware's charter sector does not have one chronic absenteeism pattern. It has four schools with severe chronic absenteeism problems, eight schools below 10%, and four more in between. Sector-level statistics flatten that distinction into a talking point, whichever direction you want the talking point to go.
The Delaware package supports a clear descriptive conclusion: charter schools cannot be summarized faithfully with one unweighted sector average. The mean, median, student-weighted rate and school-level range answer different questions, and the distance between individual schools is the central fact in this distribution.
Detailed code that reproduces the analysis and figures in this article is available exclusively to EdTribune subscribers.
Discussion
Sign in to join the discussion.
Loading comments...