In 2019, Lake Forest School District↗ET reported a four-year graduation rate of 78.3%, its lowest rate in the historical records examined here. It trailed Delaware's published state rate by 10.0 percentage points.
By 2023, Lake Forest's rate was 90.4%, a 12.1-point gain over four years. That was the largest improvement among Delaware's 16 geographic districts. This is a historical comparison of the classes of 2015 through 2023, rather than a statement about current graduation rates.
The comparison follows the Department of Education's distinction between geographic districts, vocational-technical schools and charter schools. Each geographic district has a measured graduation rate and a positive published cohort in every year examined. Preschool reporting entities are excluded.
From last to second among the named Kent County peers
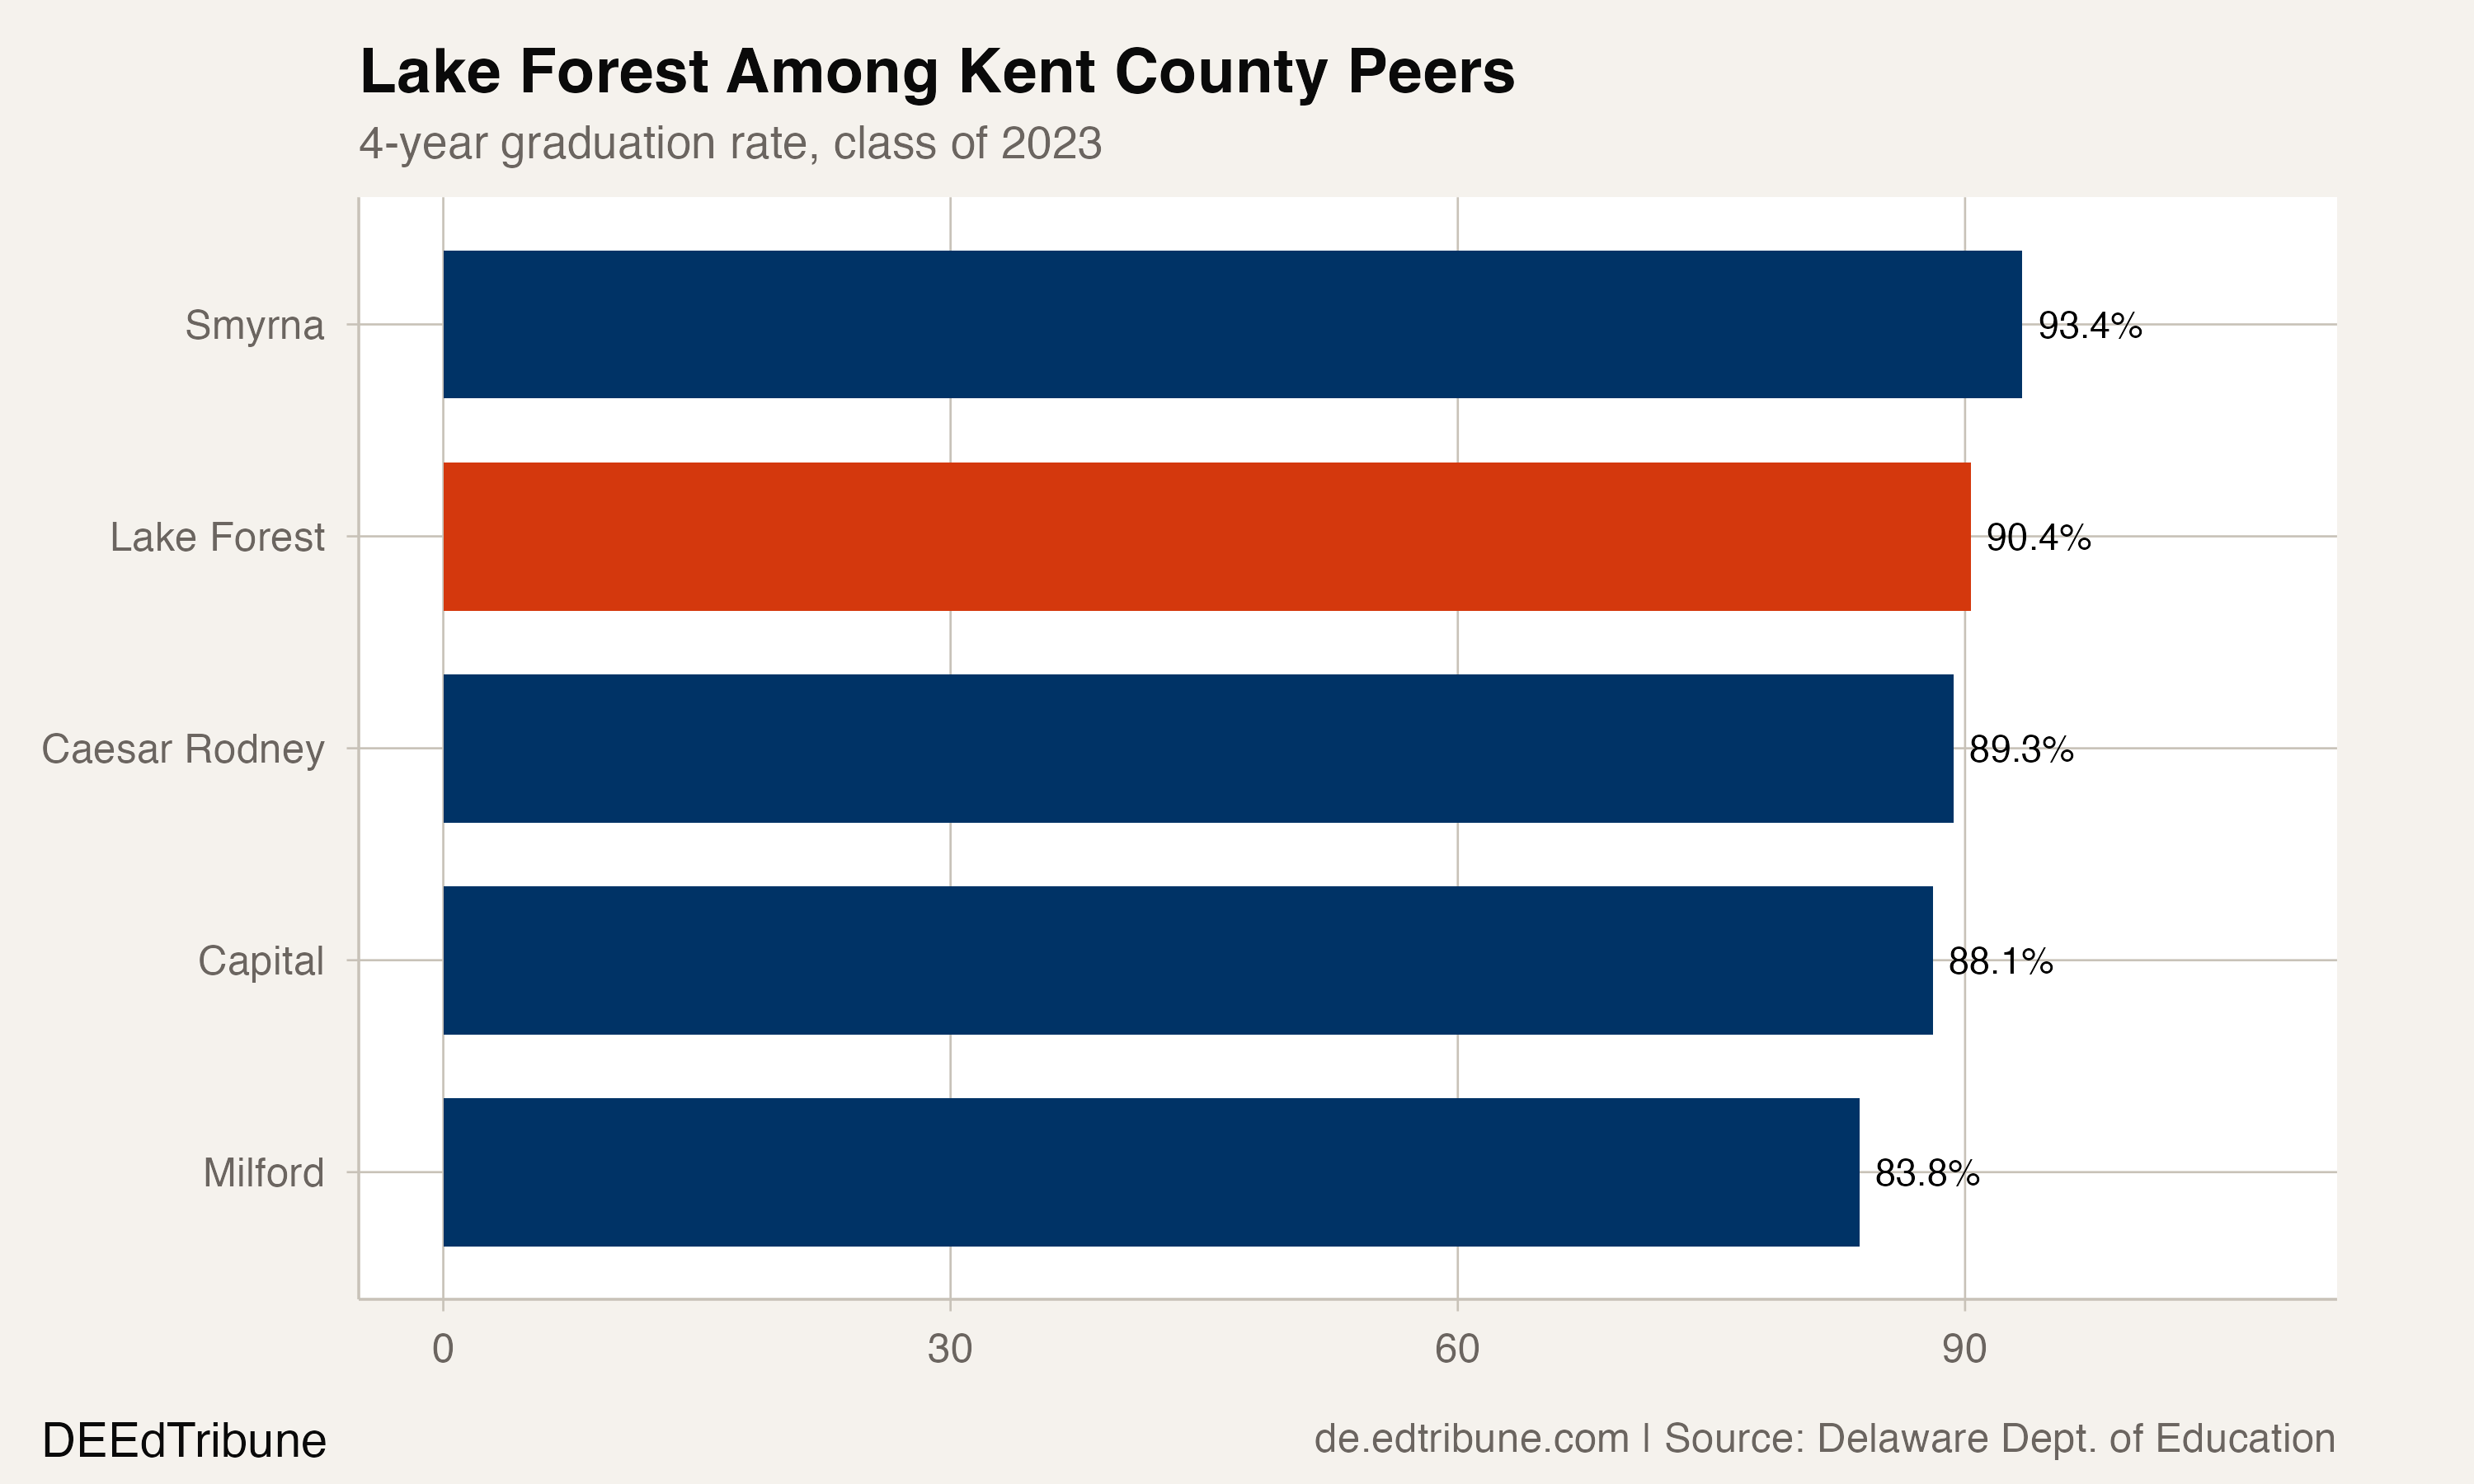
In 2019, Lake Forest ranked last among the five districts compared here: Lake Forest, Smyrna↗ET, Milford↗ET, Caesar Rodney↗ET and Capital↗ET.
By 2023, Lake Forest ranked second in that group. Smyrna reported 93.4%, followed by Lake Forest's 90.4%, Caesar Rodney's 89.3%, Capital's 88.1% and Milford's 83.8%.
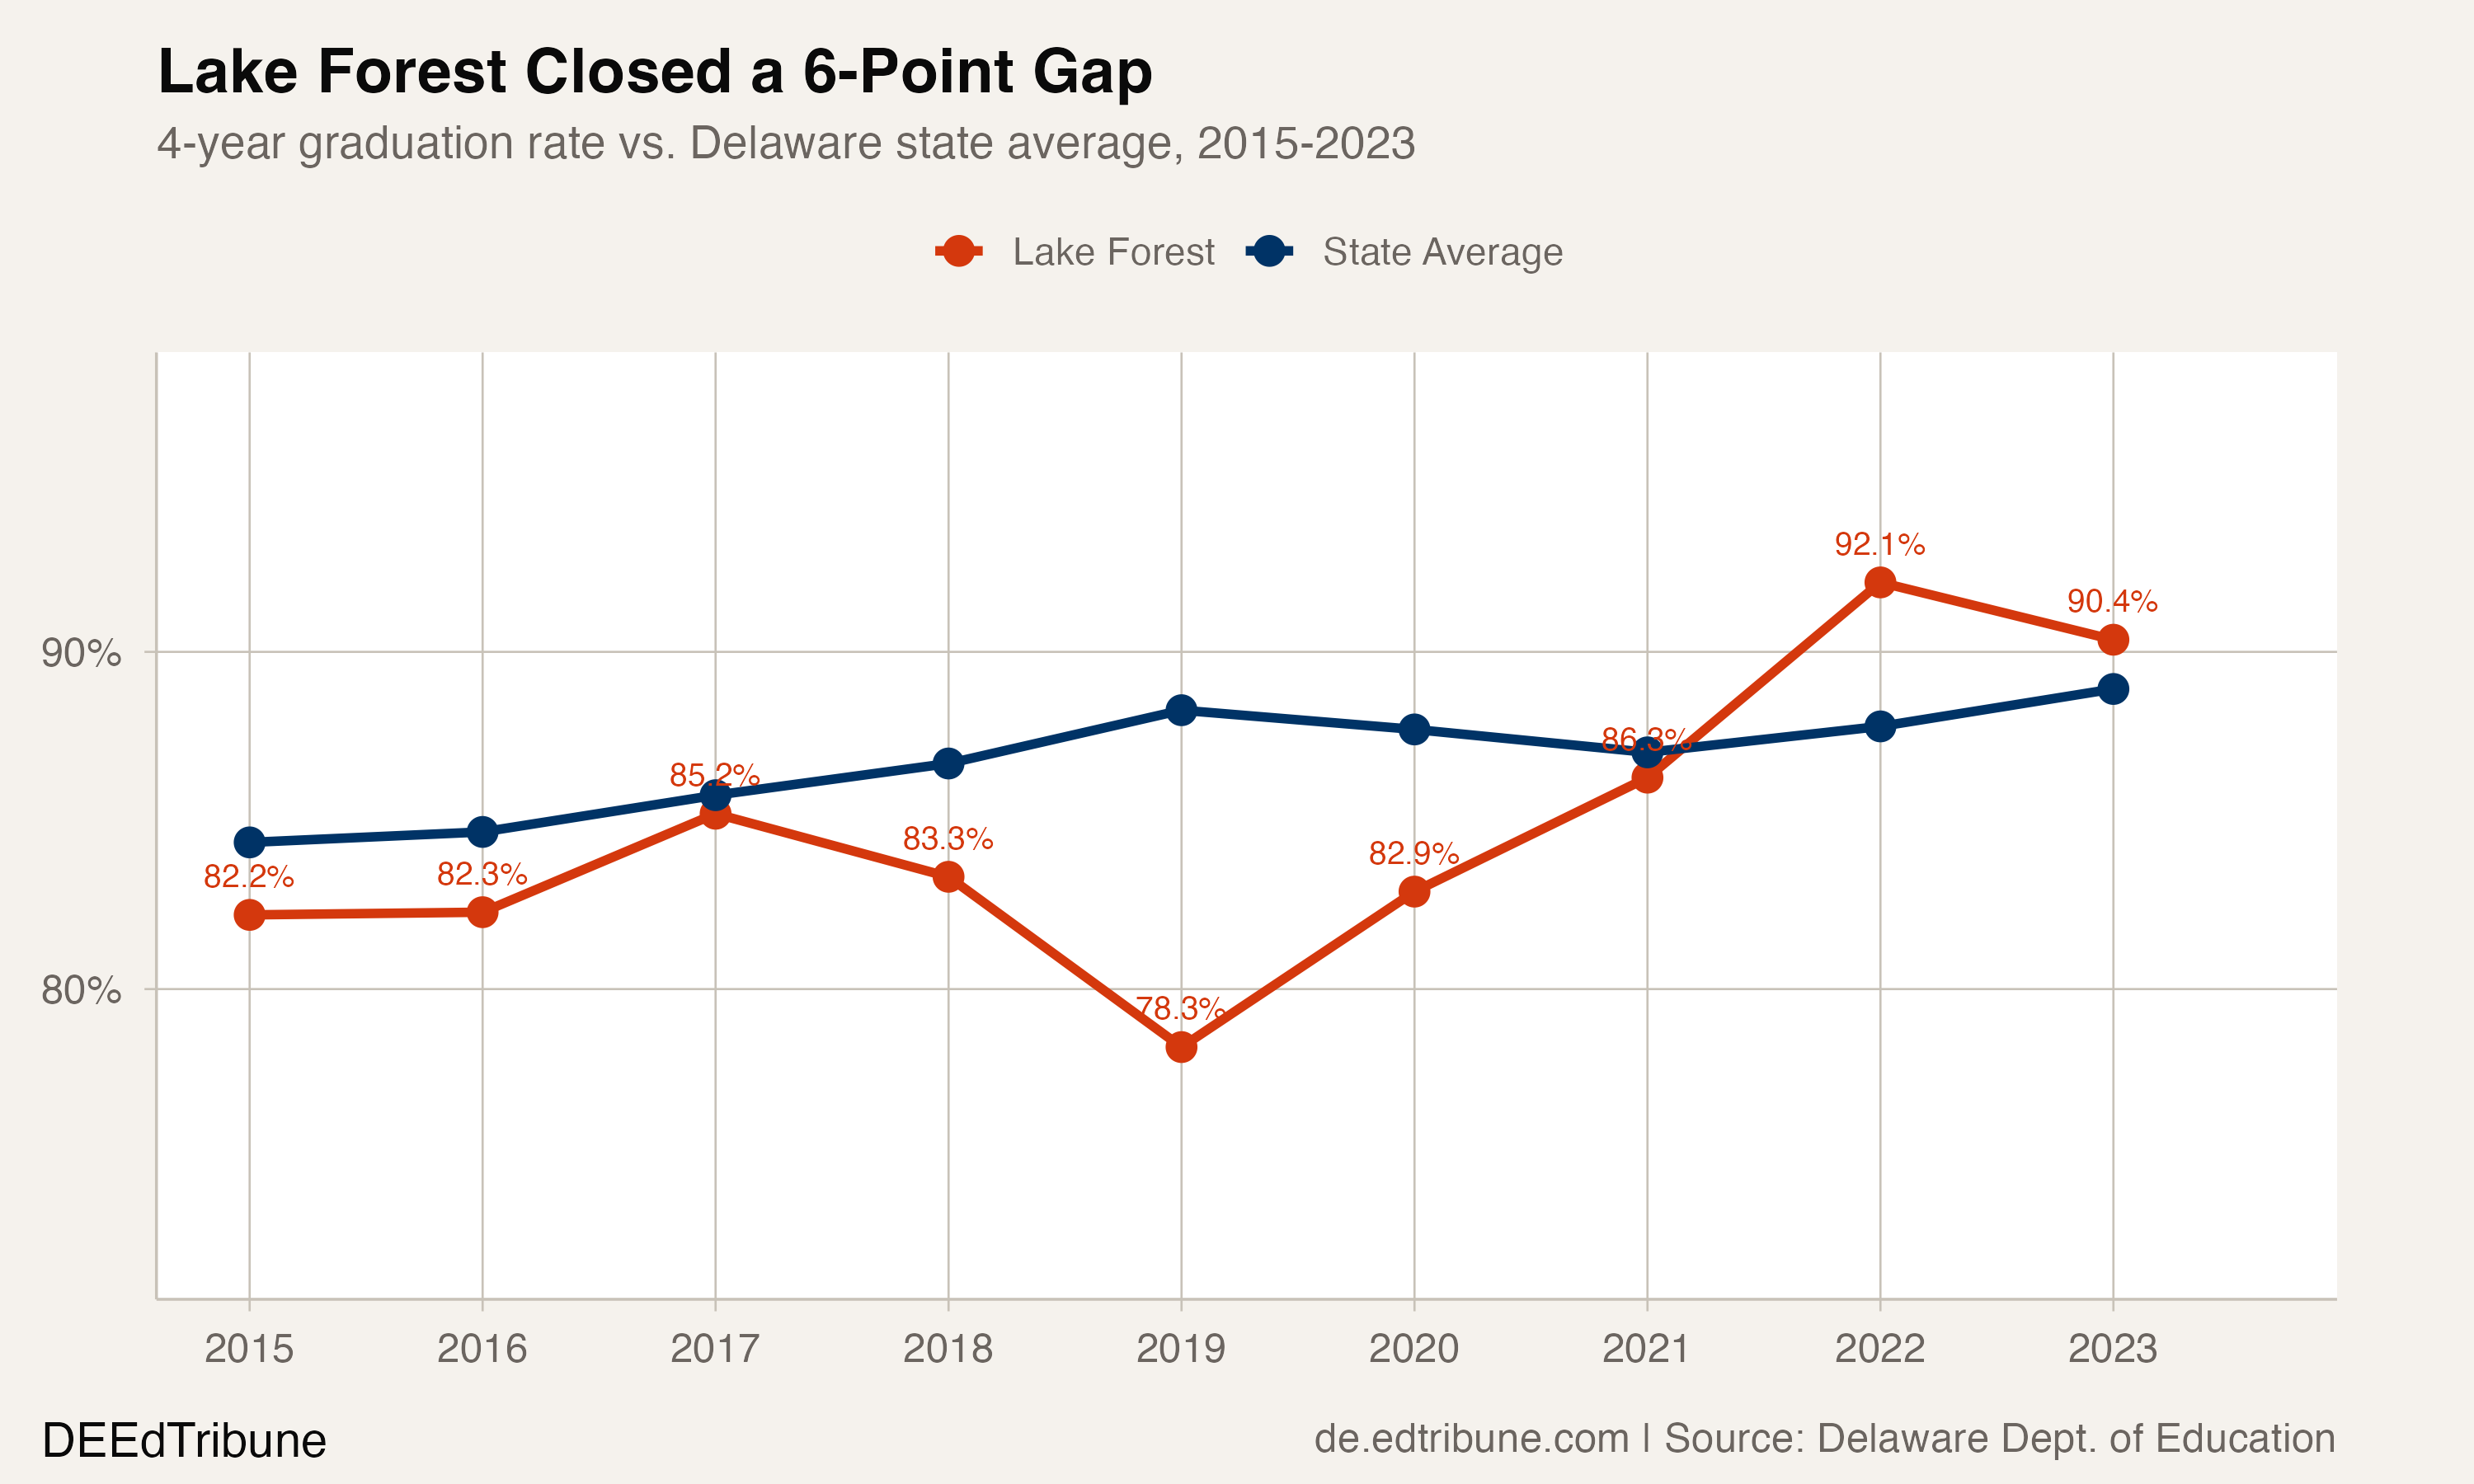
Lake Forest trailed the state by 2.1 points in 2015 and 10.0 points in 2019. In 2023, its 90.4% rate was 1.5 points above the state's 88.9%. These comparisons use the published district and statewide rates independently.
Over the eight years from 2015 to 2023, the state rate increased 4.6 points. Lake Forest's 12.1-point increase describes the shorter 2019–2023 interval.
Three annual gains, then a decline
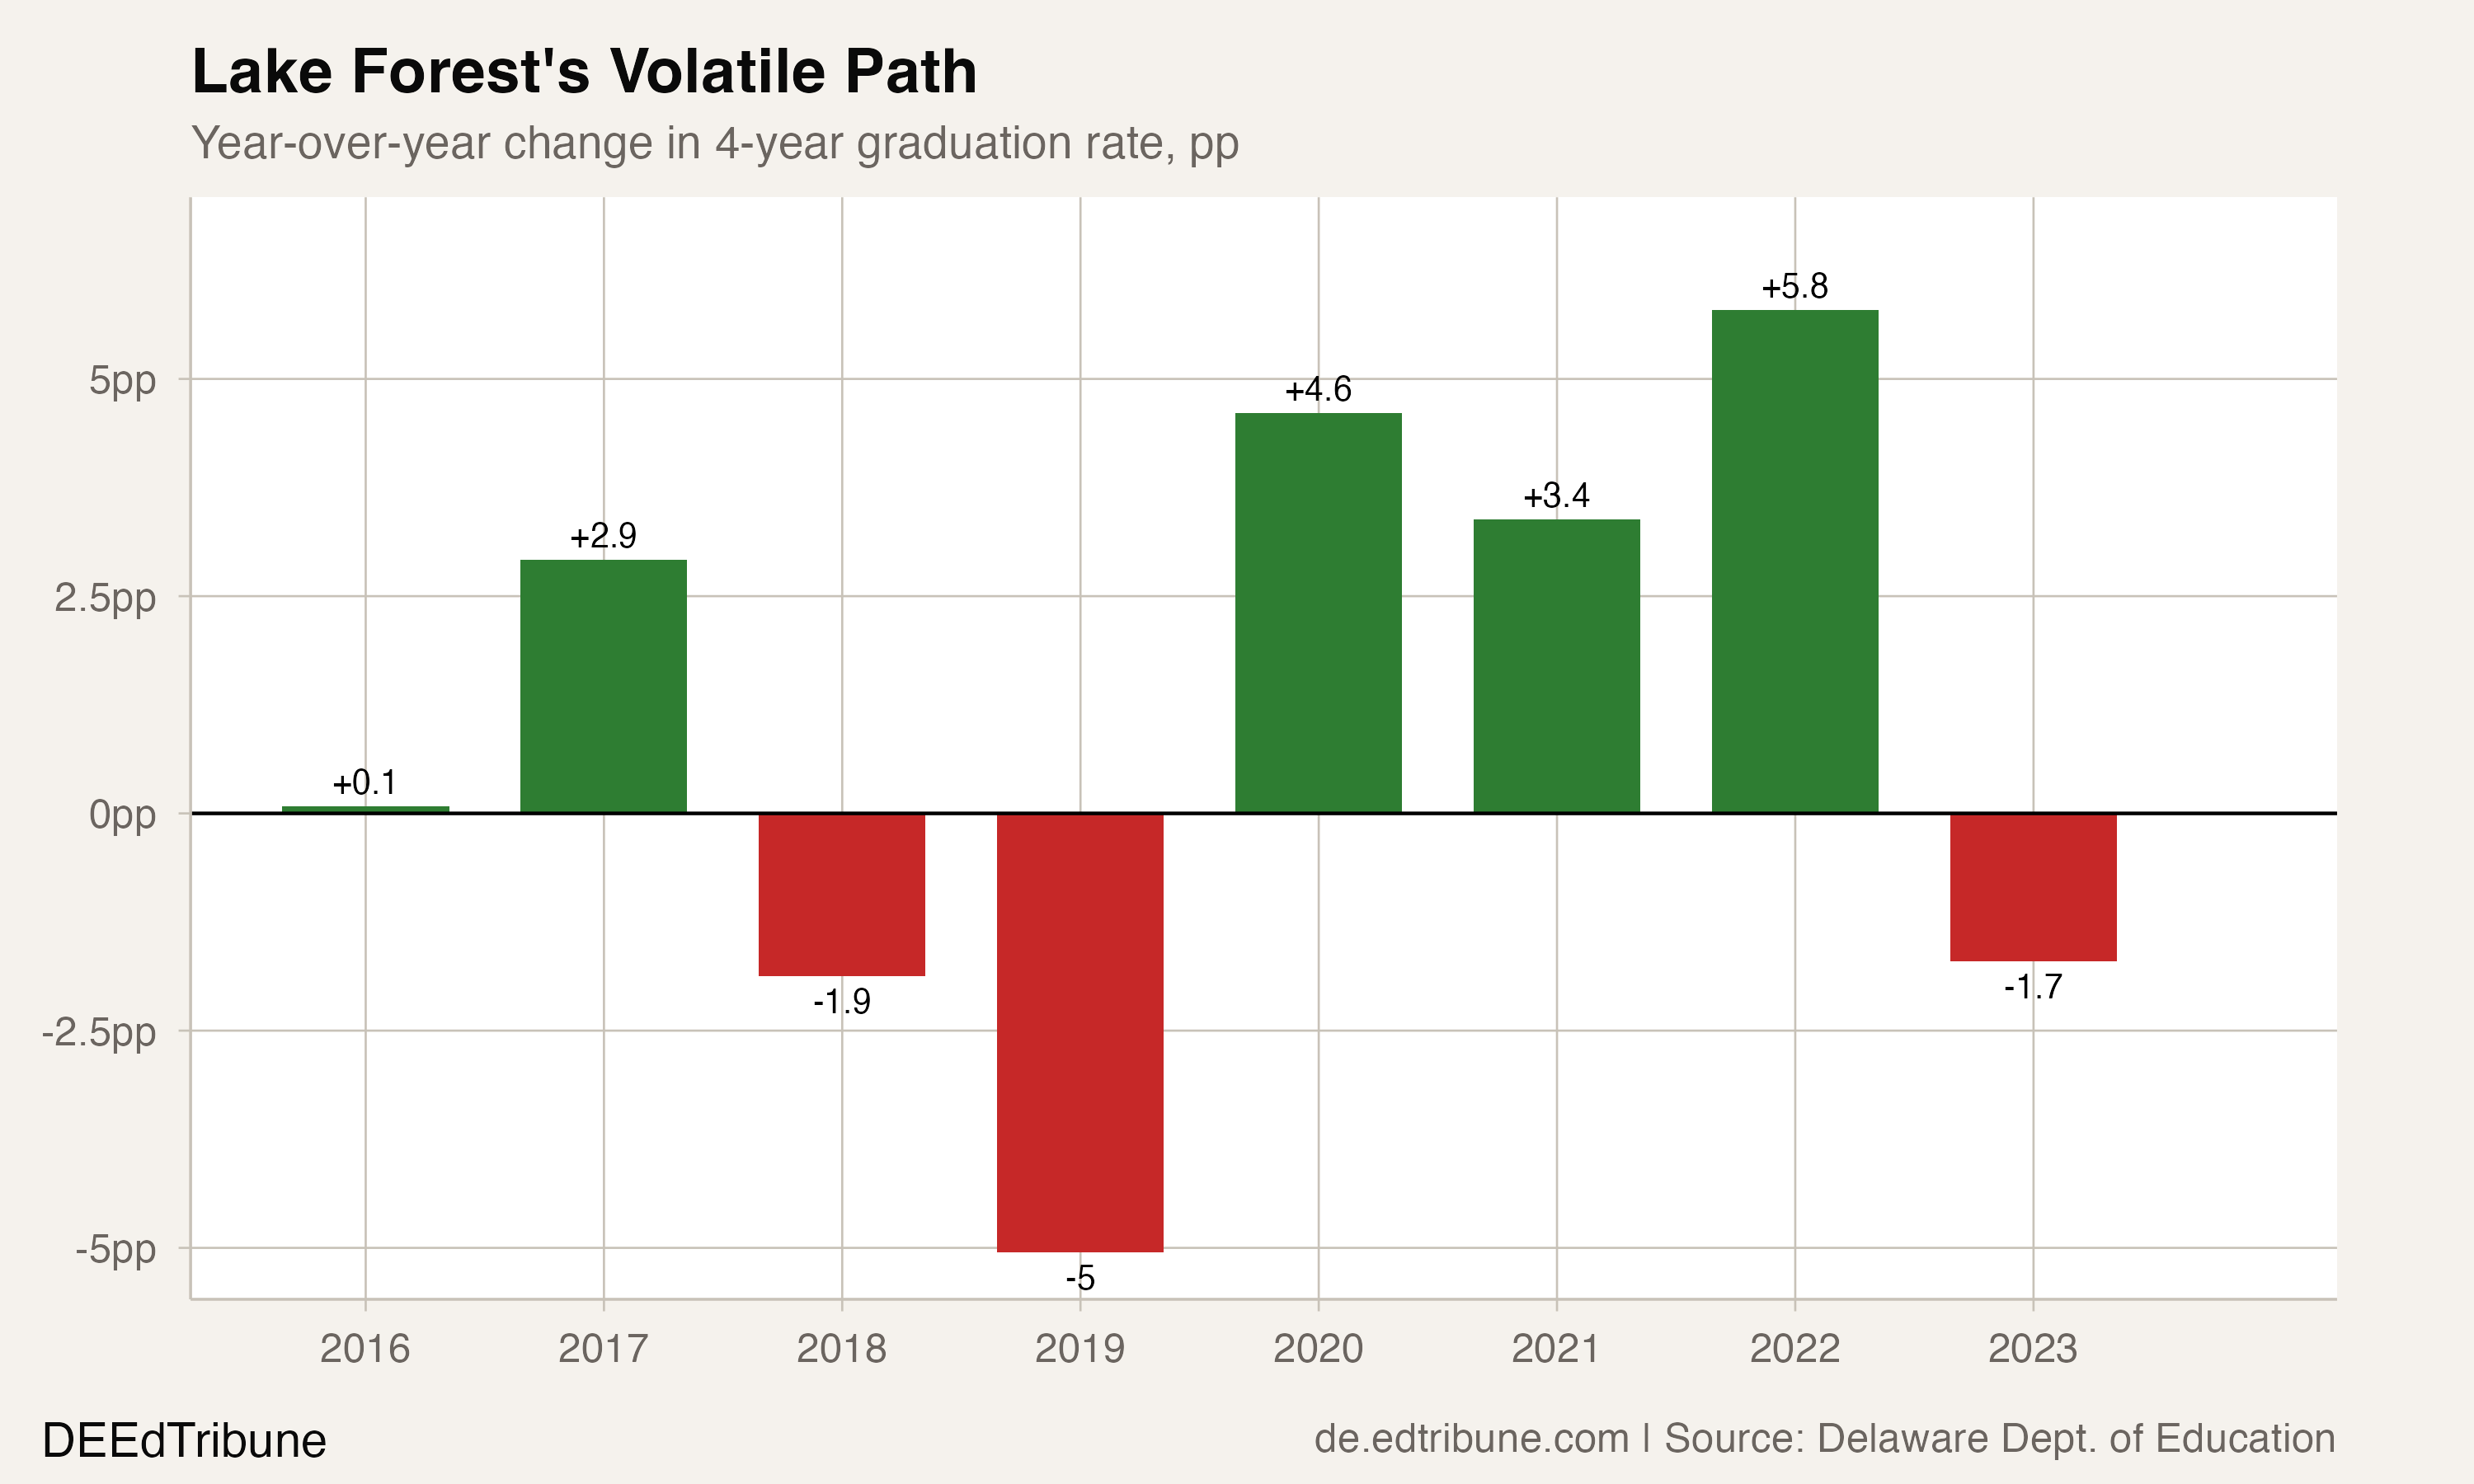
Lake Forest's rate fell from 82.2% in 2015 to 78.3% in 2019, with declines in two of the four annual transitions. Its 2019 decline was 5.0 points.
The rate then rose in three consecutive annual comparisons: 4.6 points in 2020, 3.4 in 2021 and 5.8 in 2022. It reached its window peak of 92.1% in 2022, the first year at or above 90% in these records. In 2023 it declined 1.7 points to 90.4%.
The published cohorts ranged from 197 to 254 students. In 2023, the cohort contained 197 students; one student represented roughly 0.5 percentage points of that published population. This describes the scale of the denominator, rather than explaining the observed annual changes.
Subgroup comparisons
White students made up 57% of the published 2023 cohort. Their reported graduation rate rose from 73.0% in 2019 to 92.0% in 2023, a 19.1-point gain calculated before rounding. The White cohort share uses the district's published all-student cohort as its denominator.
The Black student rate rose from 87.1% to 88.9%. In 2019, the Black rate was 14 percentage points above the White rate. These subgroup comparisons do not isolate the contribution of any group to the district-wide change.
Students in the state's economic-disadvantage reporting category had a rate of 69.2% in 2019 and 85.3% in 2023, a 16.2-point gain before rounding.
Male students' rate rose from 72.0% to 87.6%, a 15.7-point increase before rounding. Female students' rate rose from 85.7% to 93.5%. The female-male gap narrowed from 13.7 points to 5.9 points.
What the records establish
Lake Forest's published cohort fell from 244 students in 2019 to 197 in 2023. The rate comparison describes different graduating cohorts. It does not track the same students or establish whether changes in leadership, programmes or student composition explain the improvement.
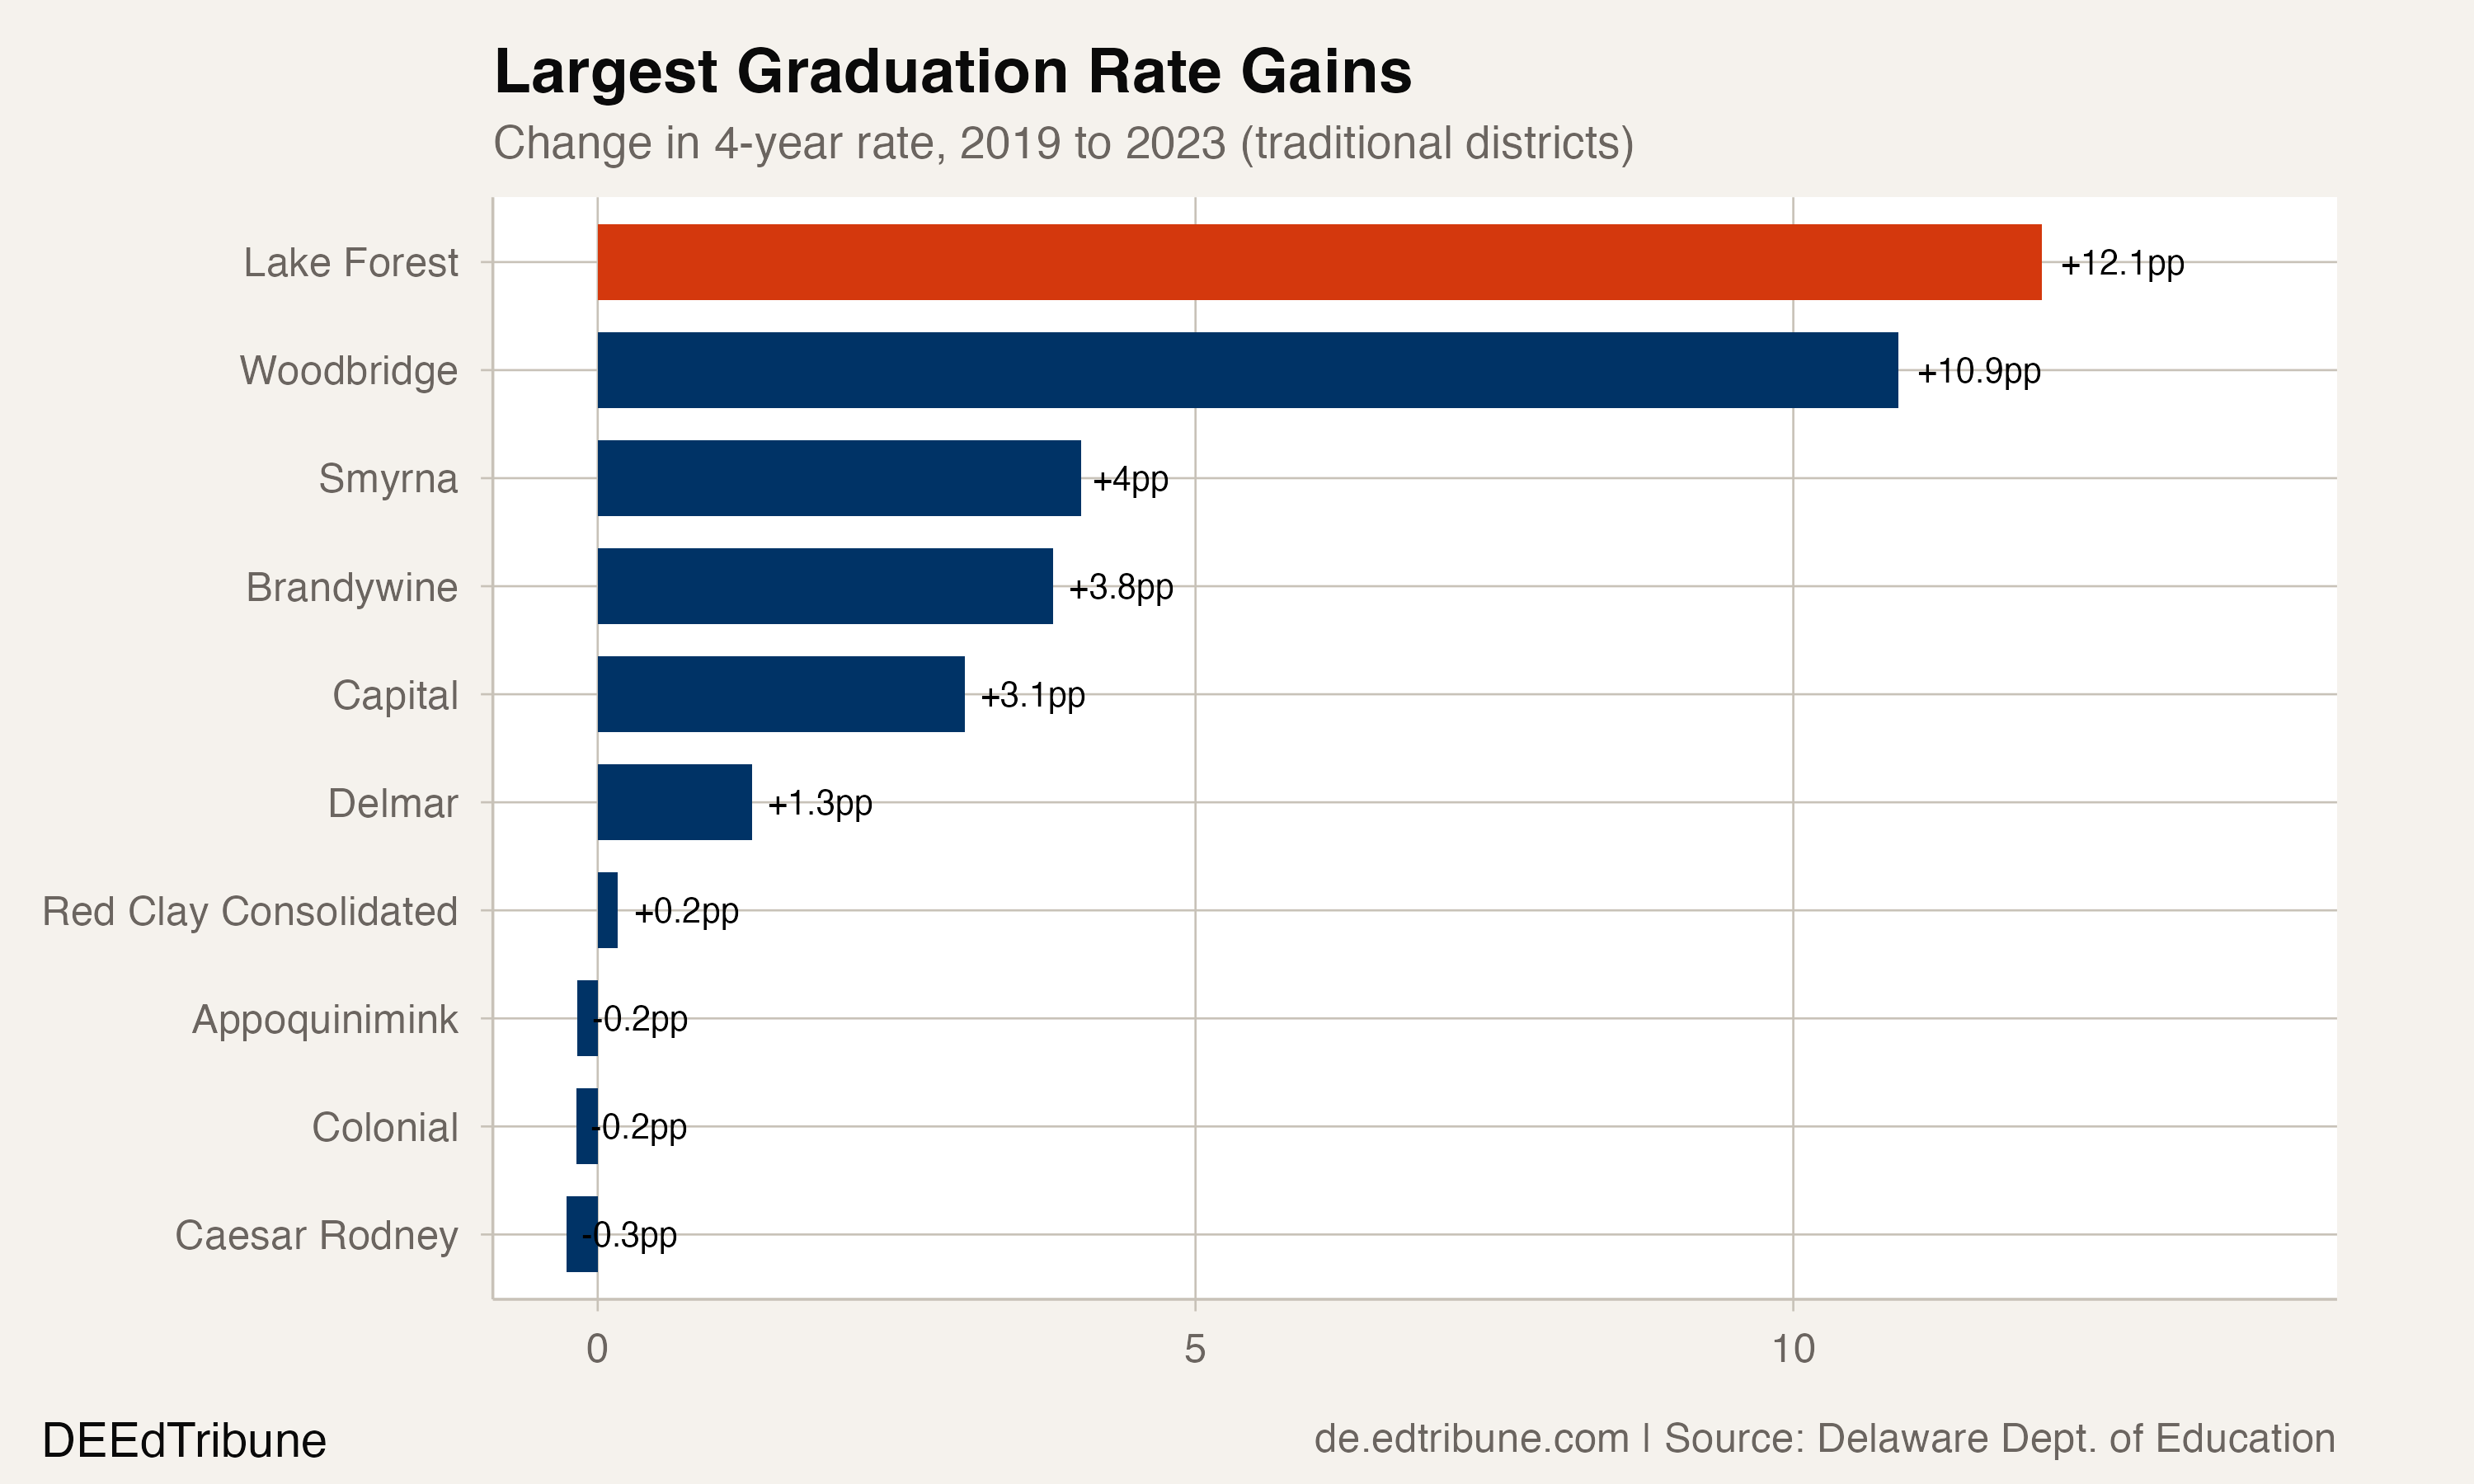
The complete geographic district comparison establishes Lake Forest's leading gain over this historical interval. Its subsequent decline within the window also shows why a large improvement should not be treated as a prediction. These graduation records do not identify what caused the changes or establish whether another district could reproduce them.
Detailed code that reproduces the analysis and figures in this article is available exclusively to EdTribune subscribers.
Discussion
Sign in to join the discussion.
Loading comments...