Delaware tracks graduation rates for 16 student subgroups. Between 2015 and 2023, 14 of them improved. Special education students gained 9.6 percentage points. Economically disadvantaged students gained 8.0. Black students gained 6.7. The state average climbed 4.6 points to an all-time high of 88.9%.
Two groups moved in the opposite direction: students in foster care and students who are currently homeless. They are the only subgroups in Delaware whose four-year graduation rate is lower today than it was nine years ago.
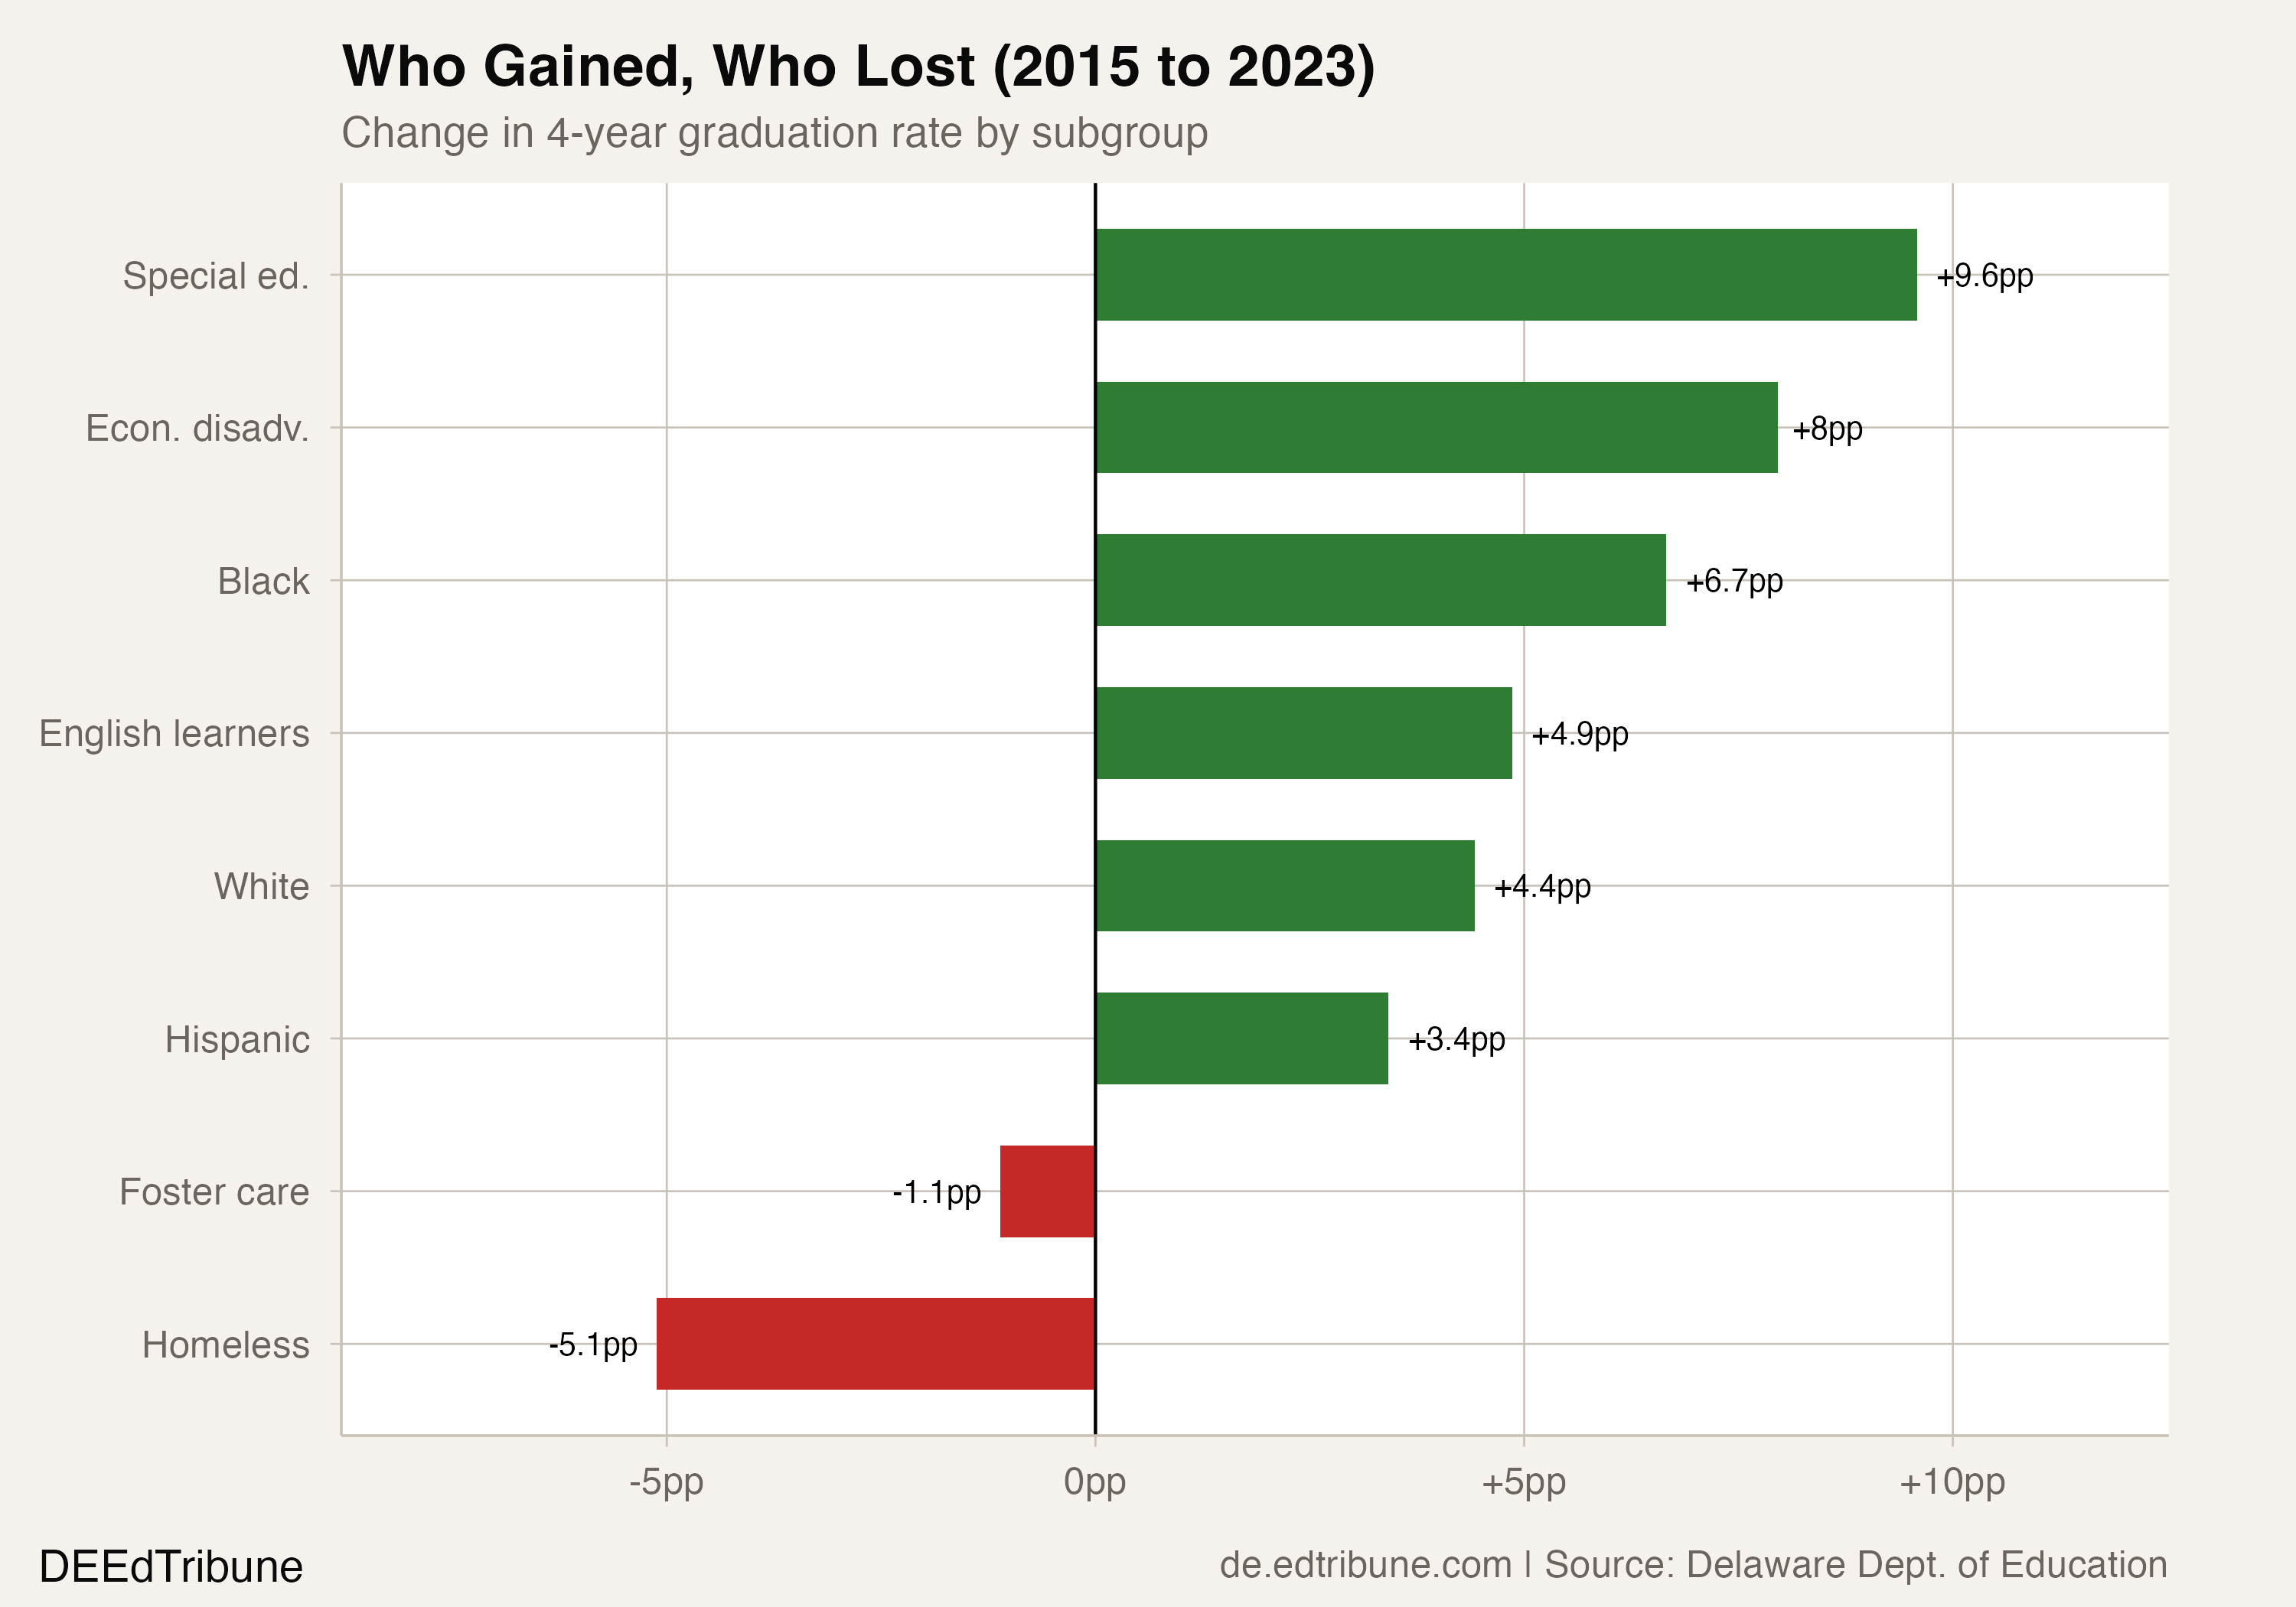
The declines are not large in raw percentage points. Foster care fell 1.1 points, from 71.1% to 70.0%. Students who are currently homeless fell 5.1 points, from 78.0% to 72.8%. But against a backdrop where every other disadvantaged group gained ground, the divergence is striking. Delaware's most unstable students are the only ones the rising tide did not lift.
The foster care arc: crash, stagnation, snap-back
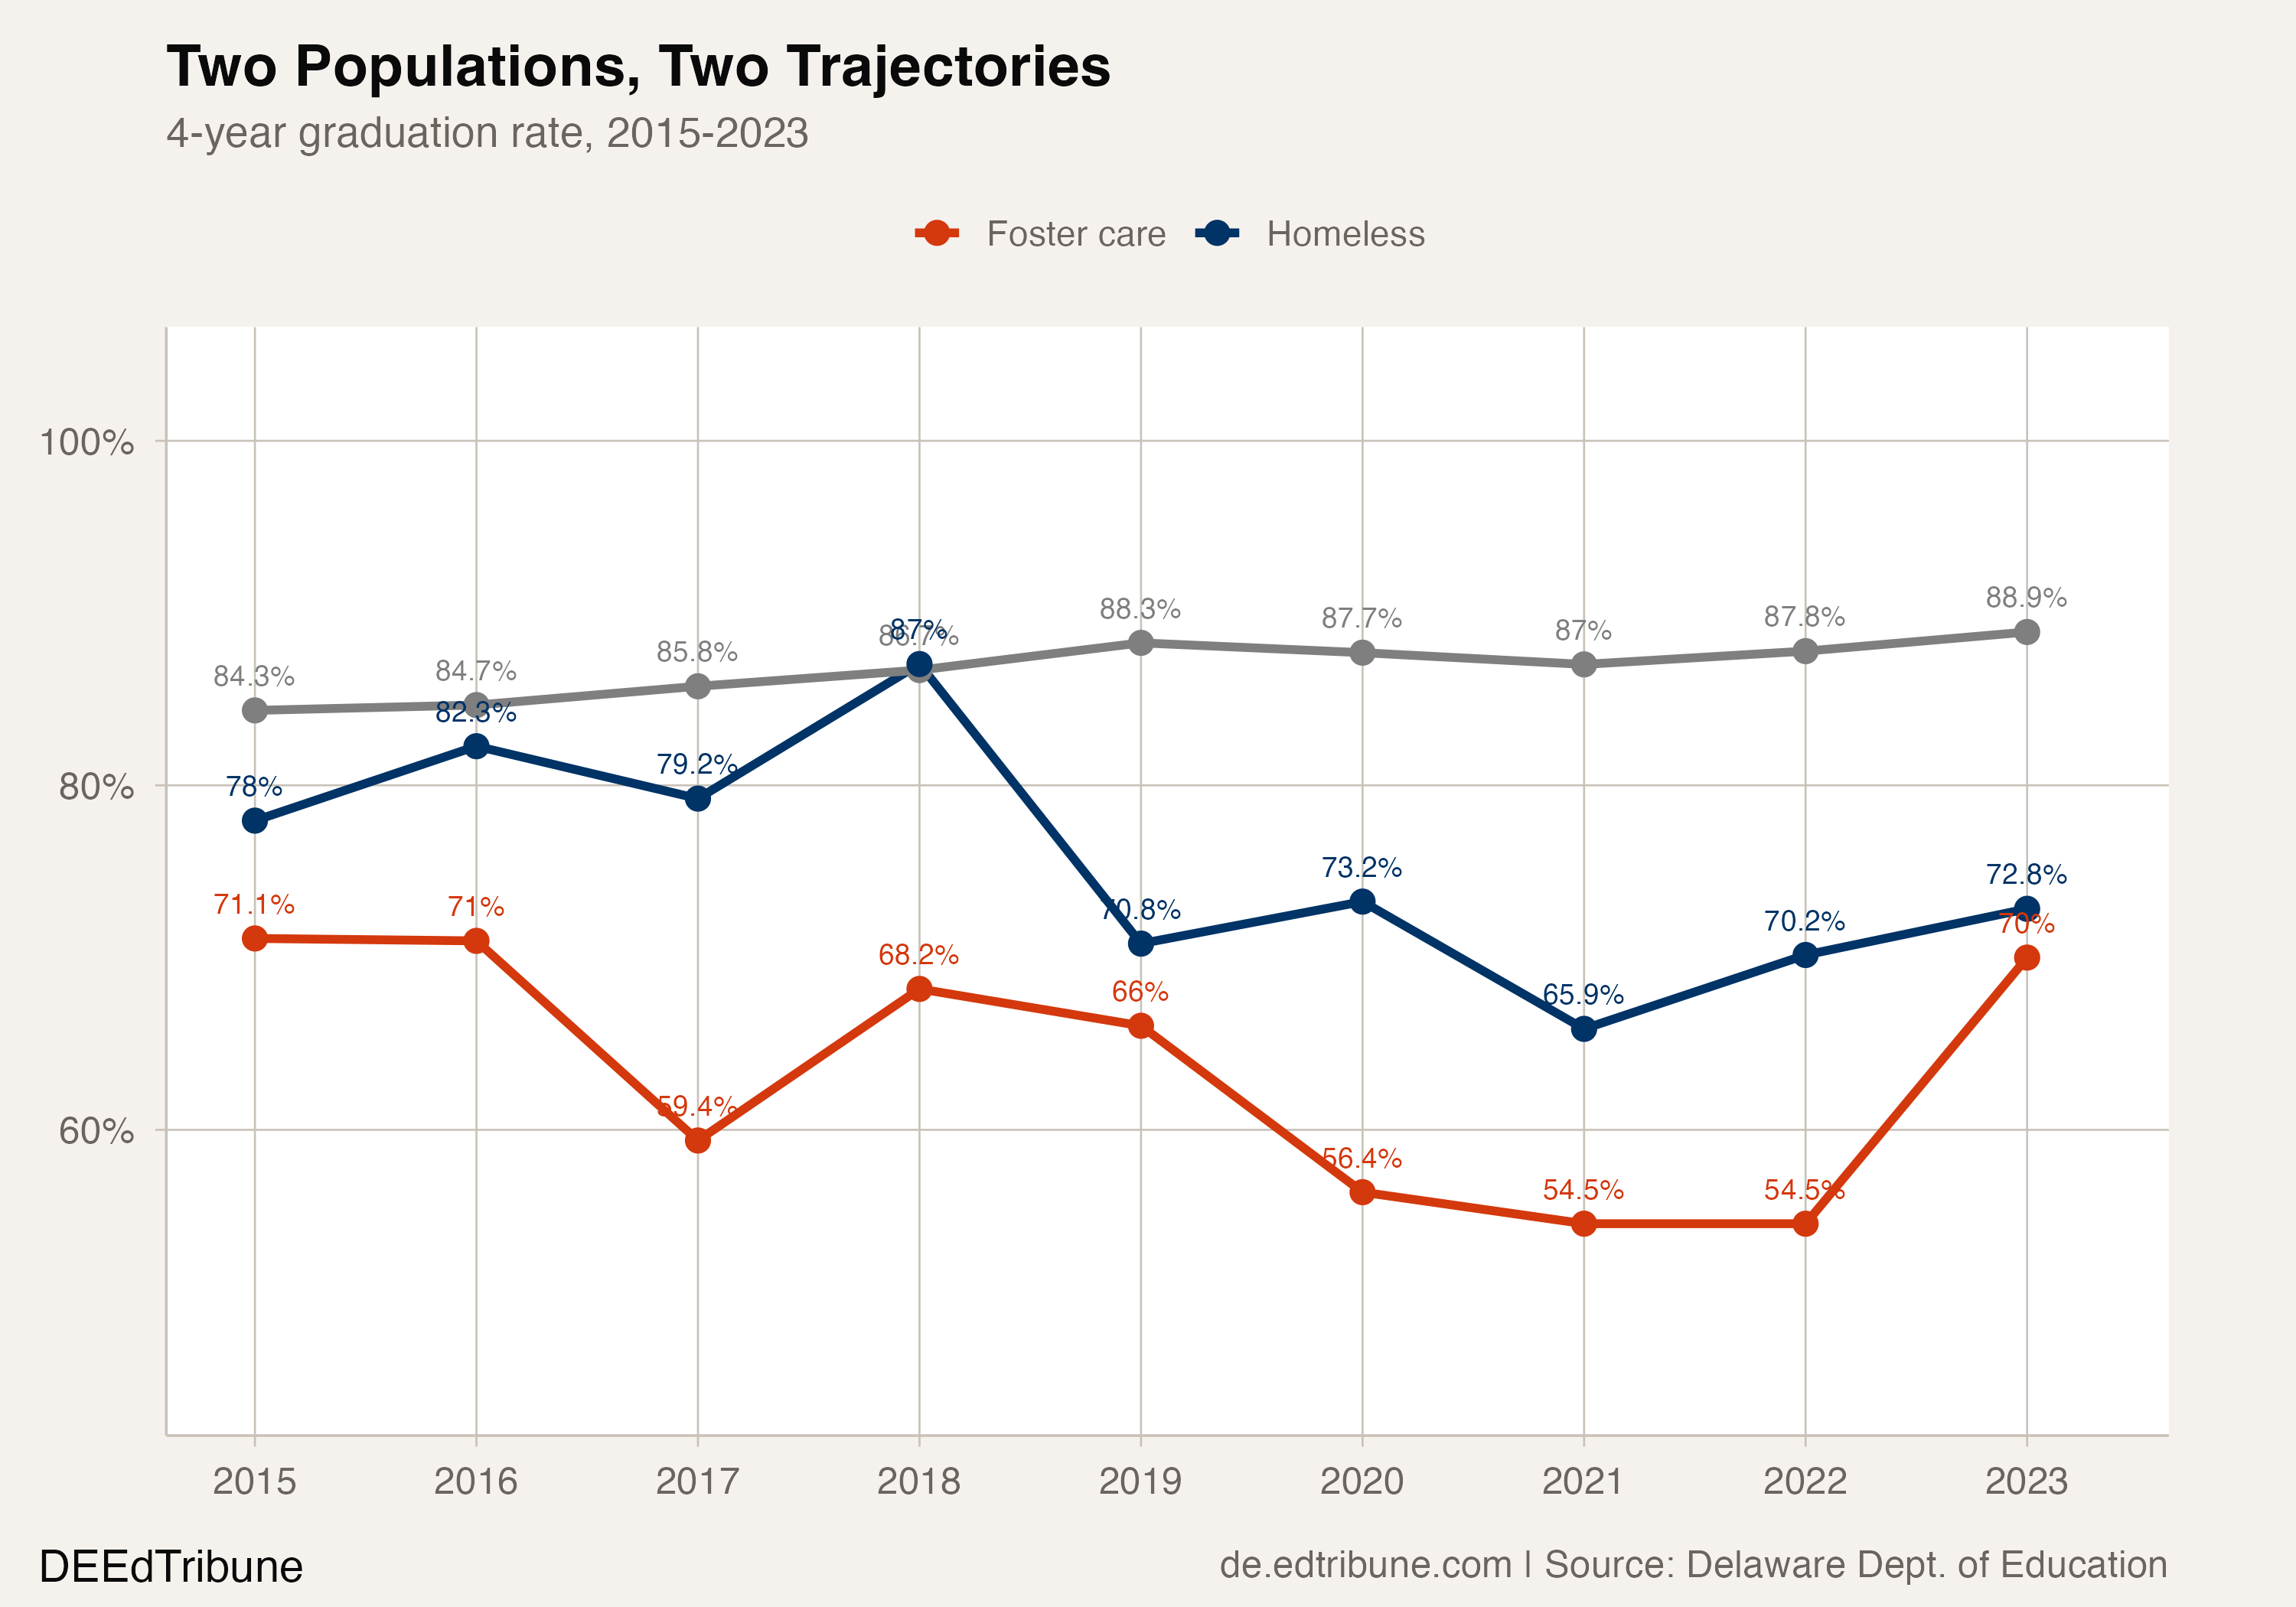
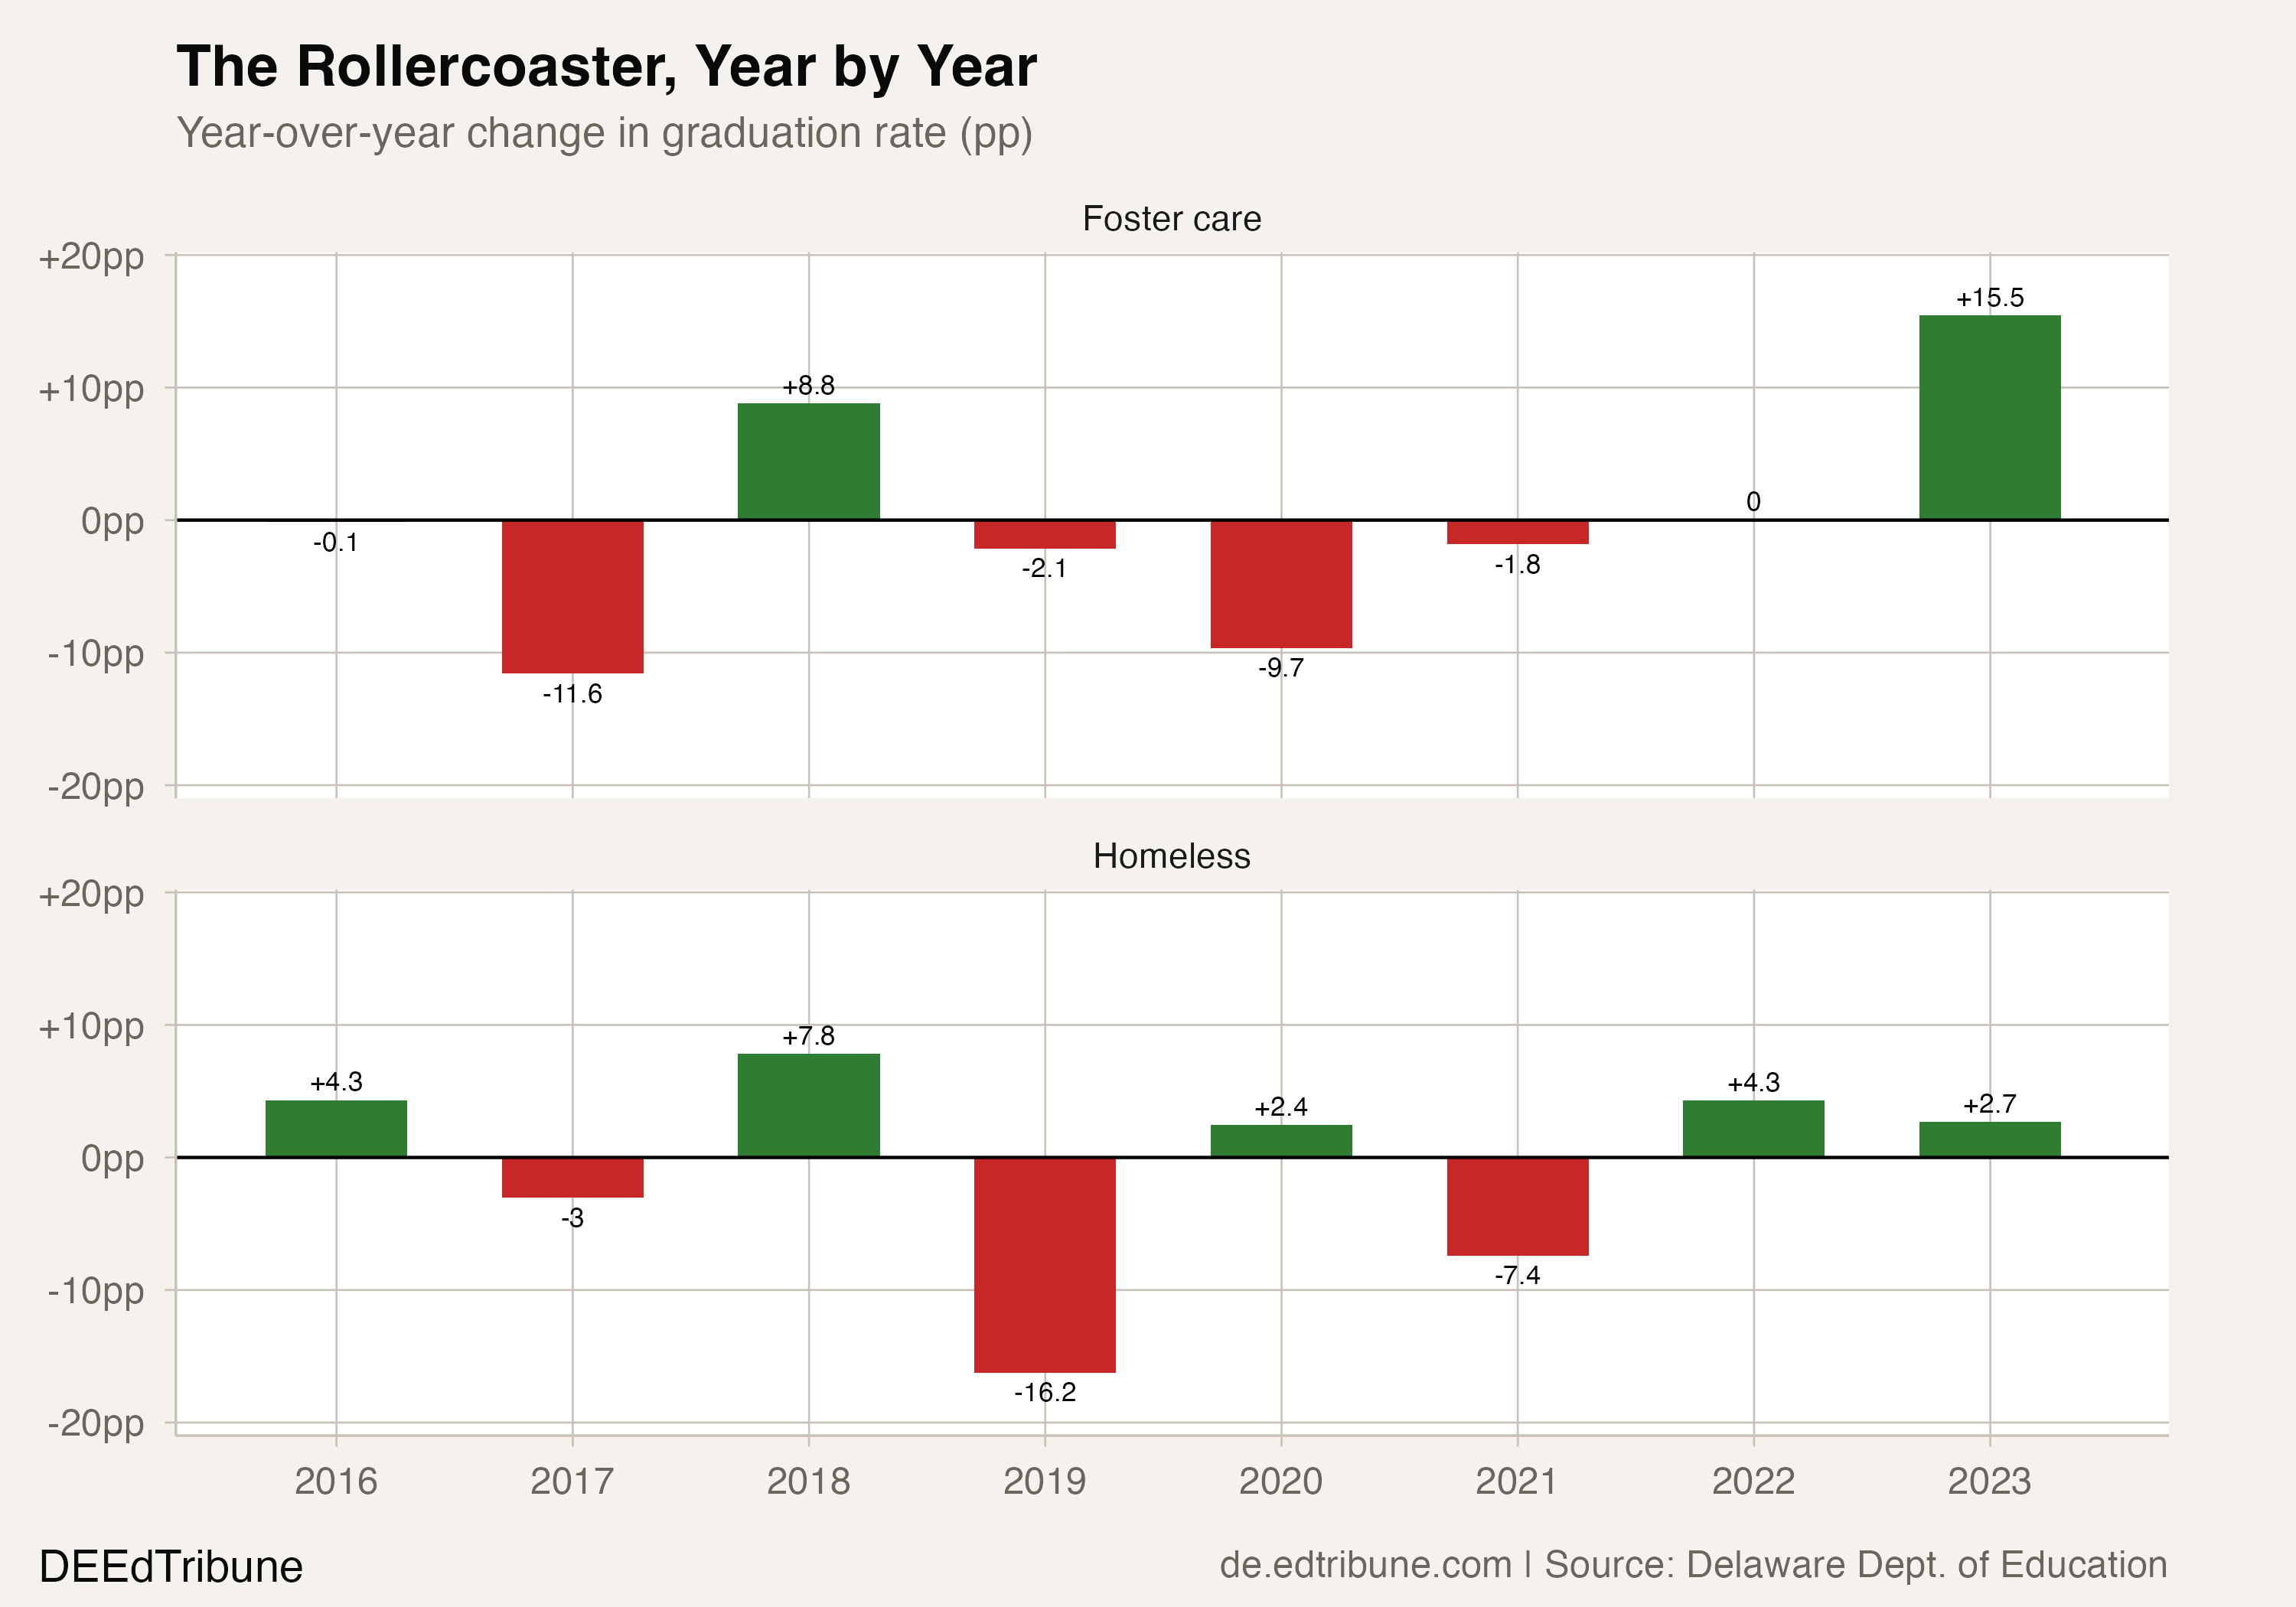
The foster care graduation rate tells the most volatile story in Delaware's data. In 2015, 71.1% of youth in foster care graduated in four years. By 2017, the rate had plunged to 59.4%, an 11.7-point drop in two years. A partial recovery to 68.2% in 2018 gave way to a second, deeper collapse: 56.4% in 2020, then 54.6% in both 2021 and 2022. For three consecutive cohorts, barely half of Delaware's youth in foster care earned a diploma on time.
The 2021 and 2022 figures are identical: 54.6%, 88 students in the cohort, 48 graduates. Whether this reflects a genuine coincidence or a data reporting artifact is unclear from the published numbers alone.
Then came the class of 2023: 70.0%, a 15.5-point rebound from the trough. Nearly back to 2015 levels in a single year.
The swing is real, but the cohort sizes demand caution. Delaware's foster care graduation cohort ranged from 22 students in 2018 to 94 in 2020. At 70 students in 2023, a shift of seven graduates would move the rate by 10 percentage points. The volatility is partly statistical noise layered on top of a genuine structural disadvantage.
Even at its best, the foster care rate has never come within 13 points of the state average. In 2022, the gap peaked at 33.2 percentage points, meaning a youth in foster care was roughly half as likely to graduate on time as the typical Delaware senior.
The homeless arc: a peak that vanished
Students who are currently homeless followed a different trajectory. In 2018, their graduation rate hit 87.0%, slightly above the state average of 86.7%. For one year, housing instability appeared to impose no measurable penalty on degree completion.
That convergence did not survive 2019. The rate fell to 70.8%, then to 65.9% in 2021, a 21.1-point collapse from peak to trough. By 2023, a partial recovery brought the rate to 72.8%, still 5.1 points below where it started in 2015 and 16.1 points below the state average.
The homeless cohort also tells a structural story about identification. In 2015, Delaware counted 263 students in its homeless graduation cohort. By 2019, that number had nearly doubled to 442, and it peaked at 501 in 2020 before settling at 438 in 2023. The rate declined as the cohort expanded, which raises a question the data alone cannot answer: did newly identified students face deeper barriers, or were previously uncounted students always struggling?
Why these two groups, and only these two
Every other subgroup tracked by Delaware's Department of Education improved between 2015 and 2023. English learners gained 4.9 points. Hispanic students gained 3.4 points. Even the subgroups that started lowest, special education at 63.7% and English learners at 68.7%, found a way to climb. Students in foster care and students who are currently homeless did not.
The most plausible explanation is that both groups face a barrier that other disadvantaged subgroups do not: residential instability. A student classified as economically disadvantaged may live in the same house for years. A youth in foster care or student who is currently homeless, by definition, does not have that continuity. School changes disrupt credit accumulation, sever relationships with teachers and counselors, and reset the social structures that keep students engaged.
The federal Every Student Succeeds Act requires states to keep children in foster care in their school of origin when a placement changes, and Delaware's Department of Education and Division of Family Services have a memorandum of understanding to coordinate transportation and enrollment. But educational stability provisions cannot eliminate the underlying instability. A teenager who moves placements three times in a year still experiences three sets of disruptions to sleep, meals, routines, and peer relationships, even if the school stays constant.
What the cohort numbers reveal
The cohort size chart is as informative as the rate chart.
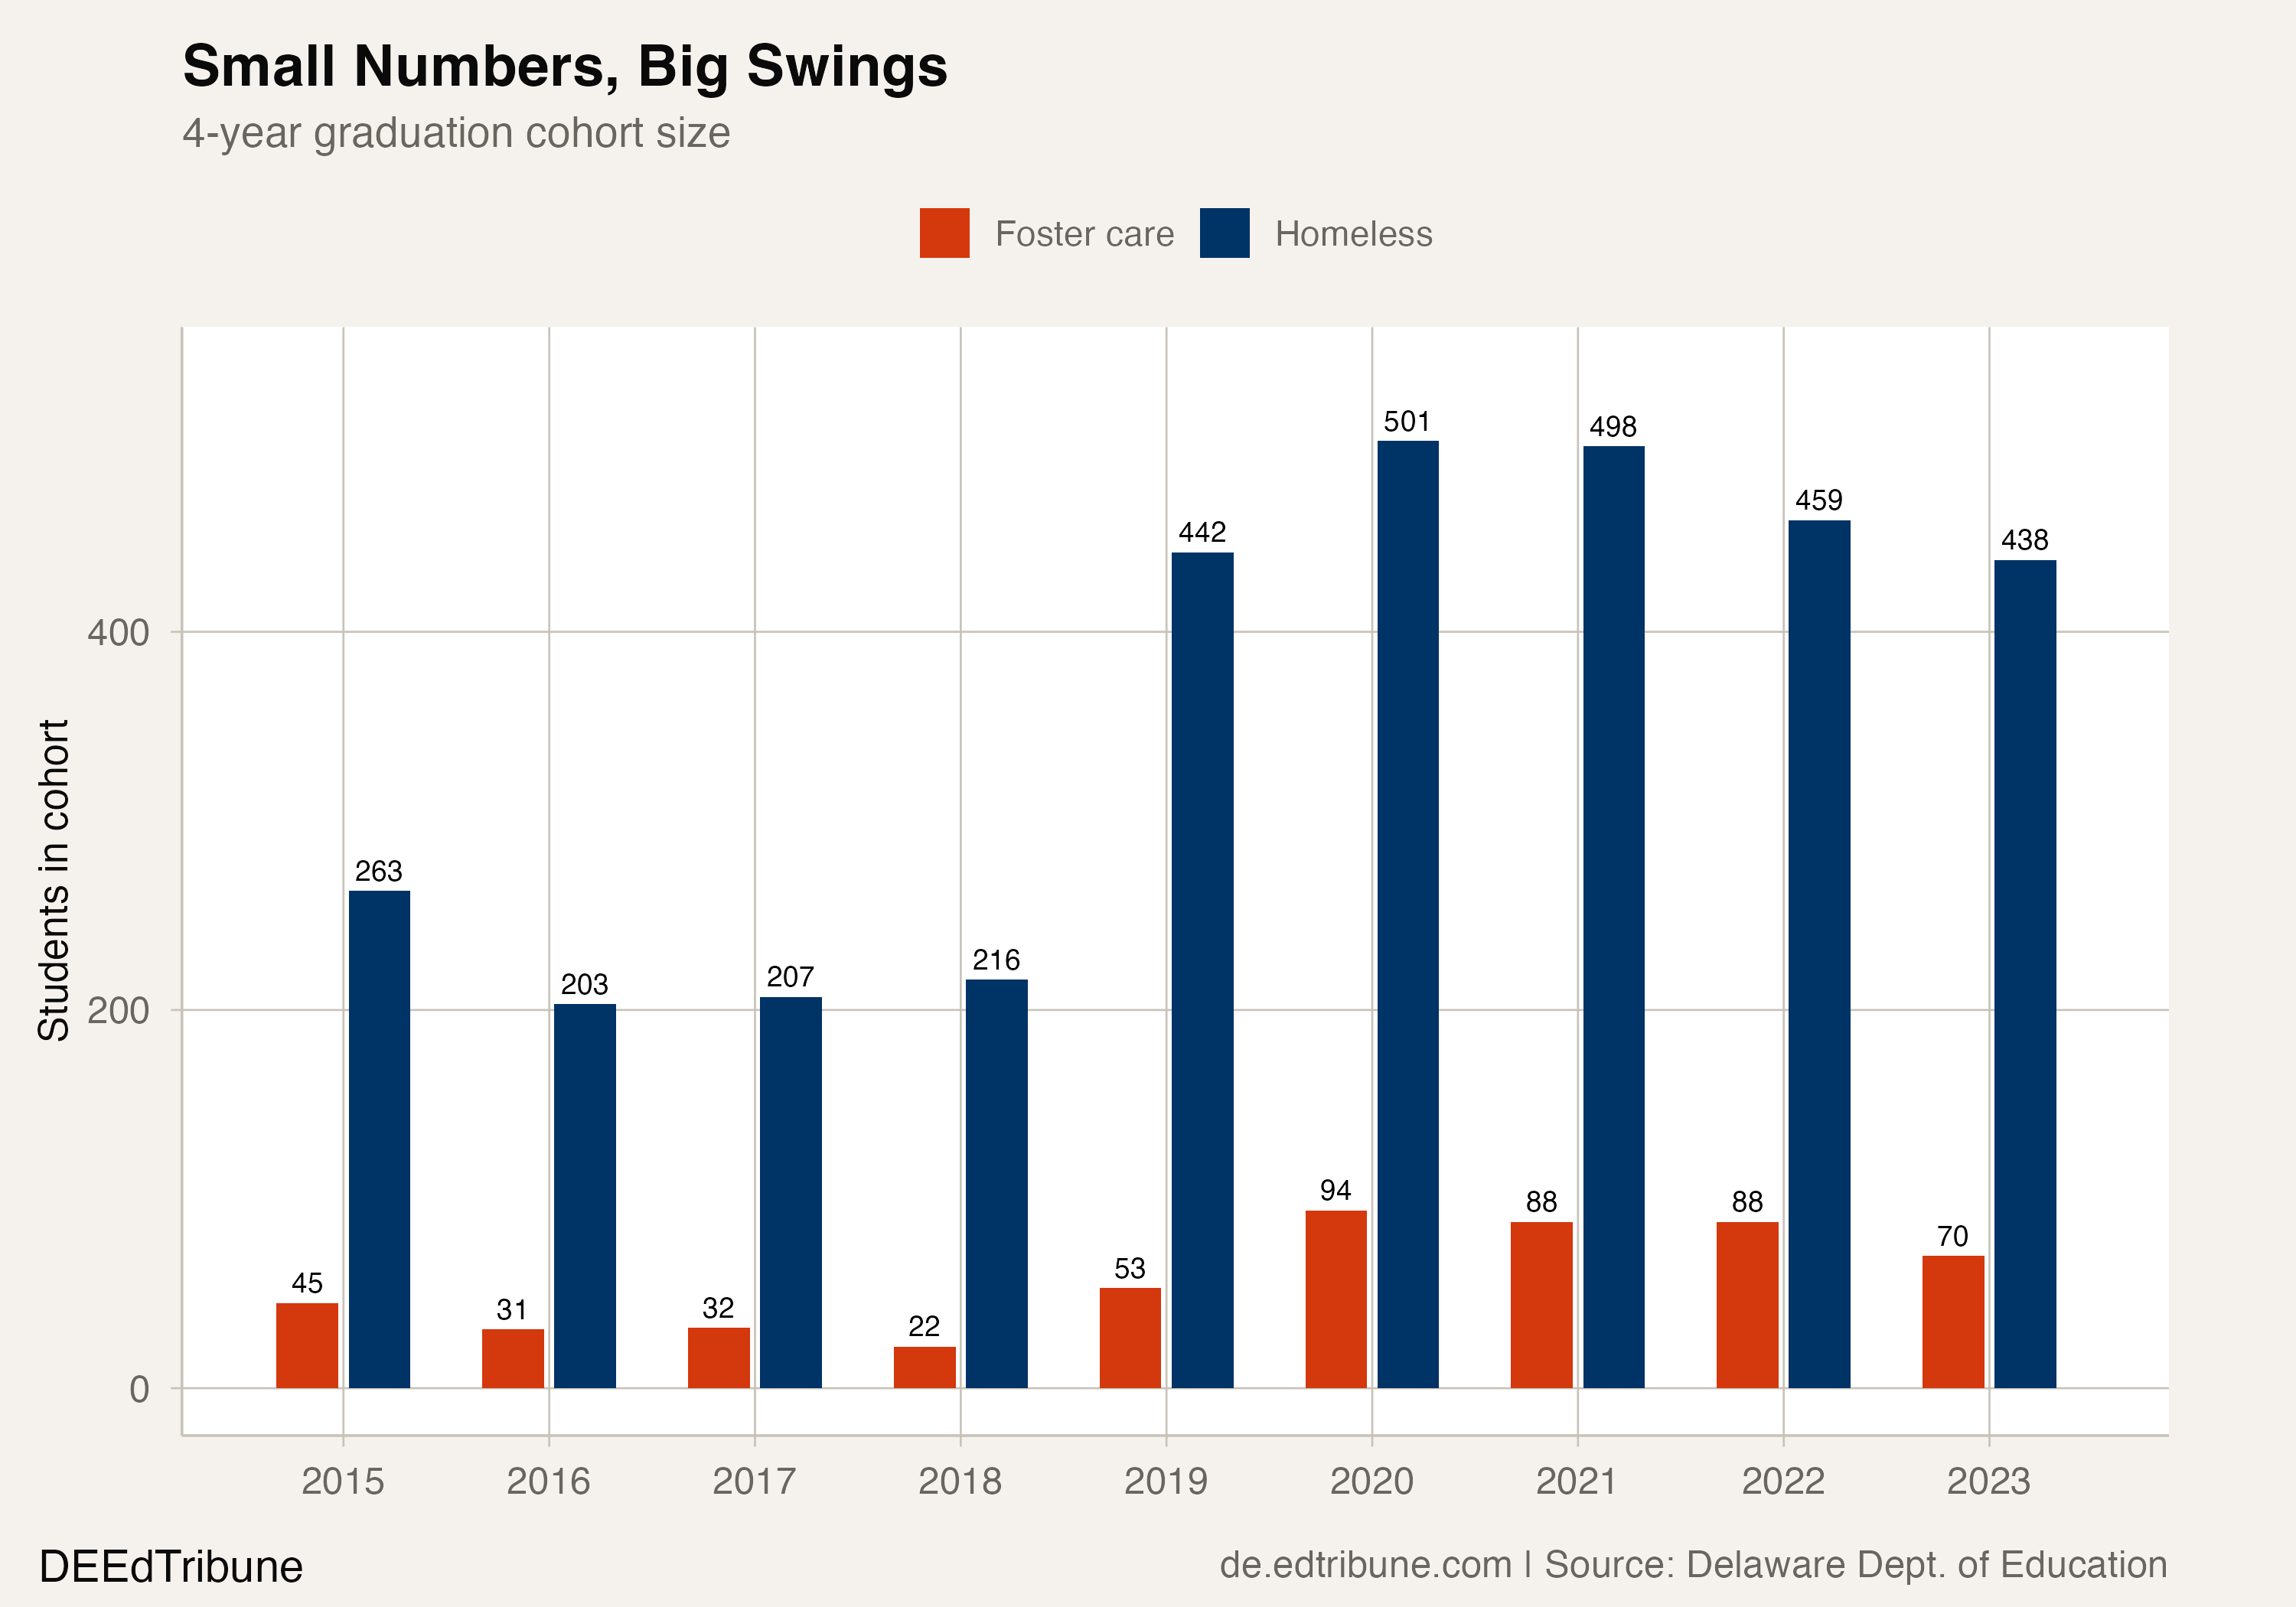
Foster care cohorts roughly doubled from the 2015-2018 period (averaging 33 students) to the 2019-2023 period (averaging 79 students). The homeless cohort nearly doubled as well, from about 222 students in 2015-2018 to 468 in 2019-2023. Both increases likely reflect improved identification under federal reporting requirements rather than a sudden doubling of housing instability.
The timing matters. The graduation rate declines for both groups coincide with the cohort expansions. If newly identified students were, on average, further from graduation than those previously counted, expanding identification would mechanically lower the group average even if no individual student's outcome worsened. This does not make the low rates acceptable. It means the 2015 rates may have been artificially high, measuring only the most visible and best-supported subset of a larger struggling population.
Statewide, about 470 children are currently in foster care, with Black children comprising 63% of the foster population despite making up roughly 30% of Delaware's student body. Thirty-six percent of Delaware's children in foster care are over age 14, well above the national average of 24%, meaning a disproportionate share are navigating high school during the most unstable period of their lives.
The gap that widened while others closed
The gap between these two groups and the state average widened substantially, even as gaps for other historically underserved populations narrowed.
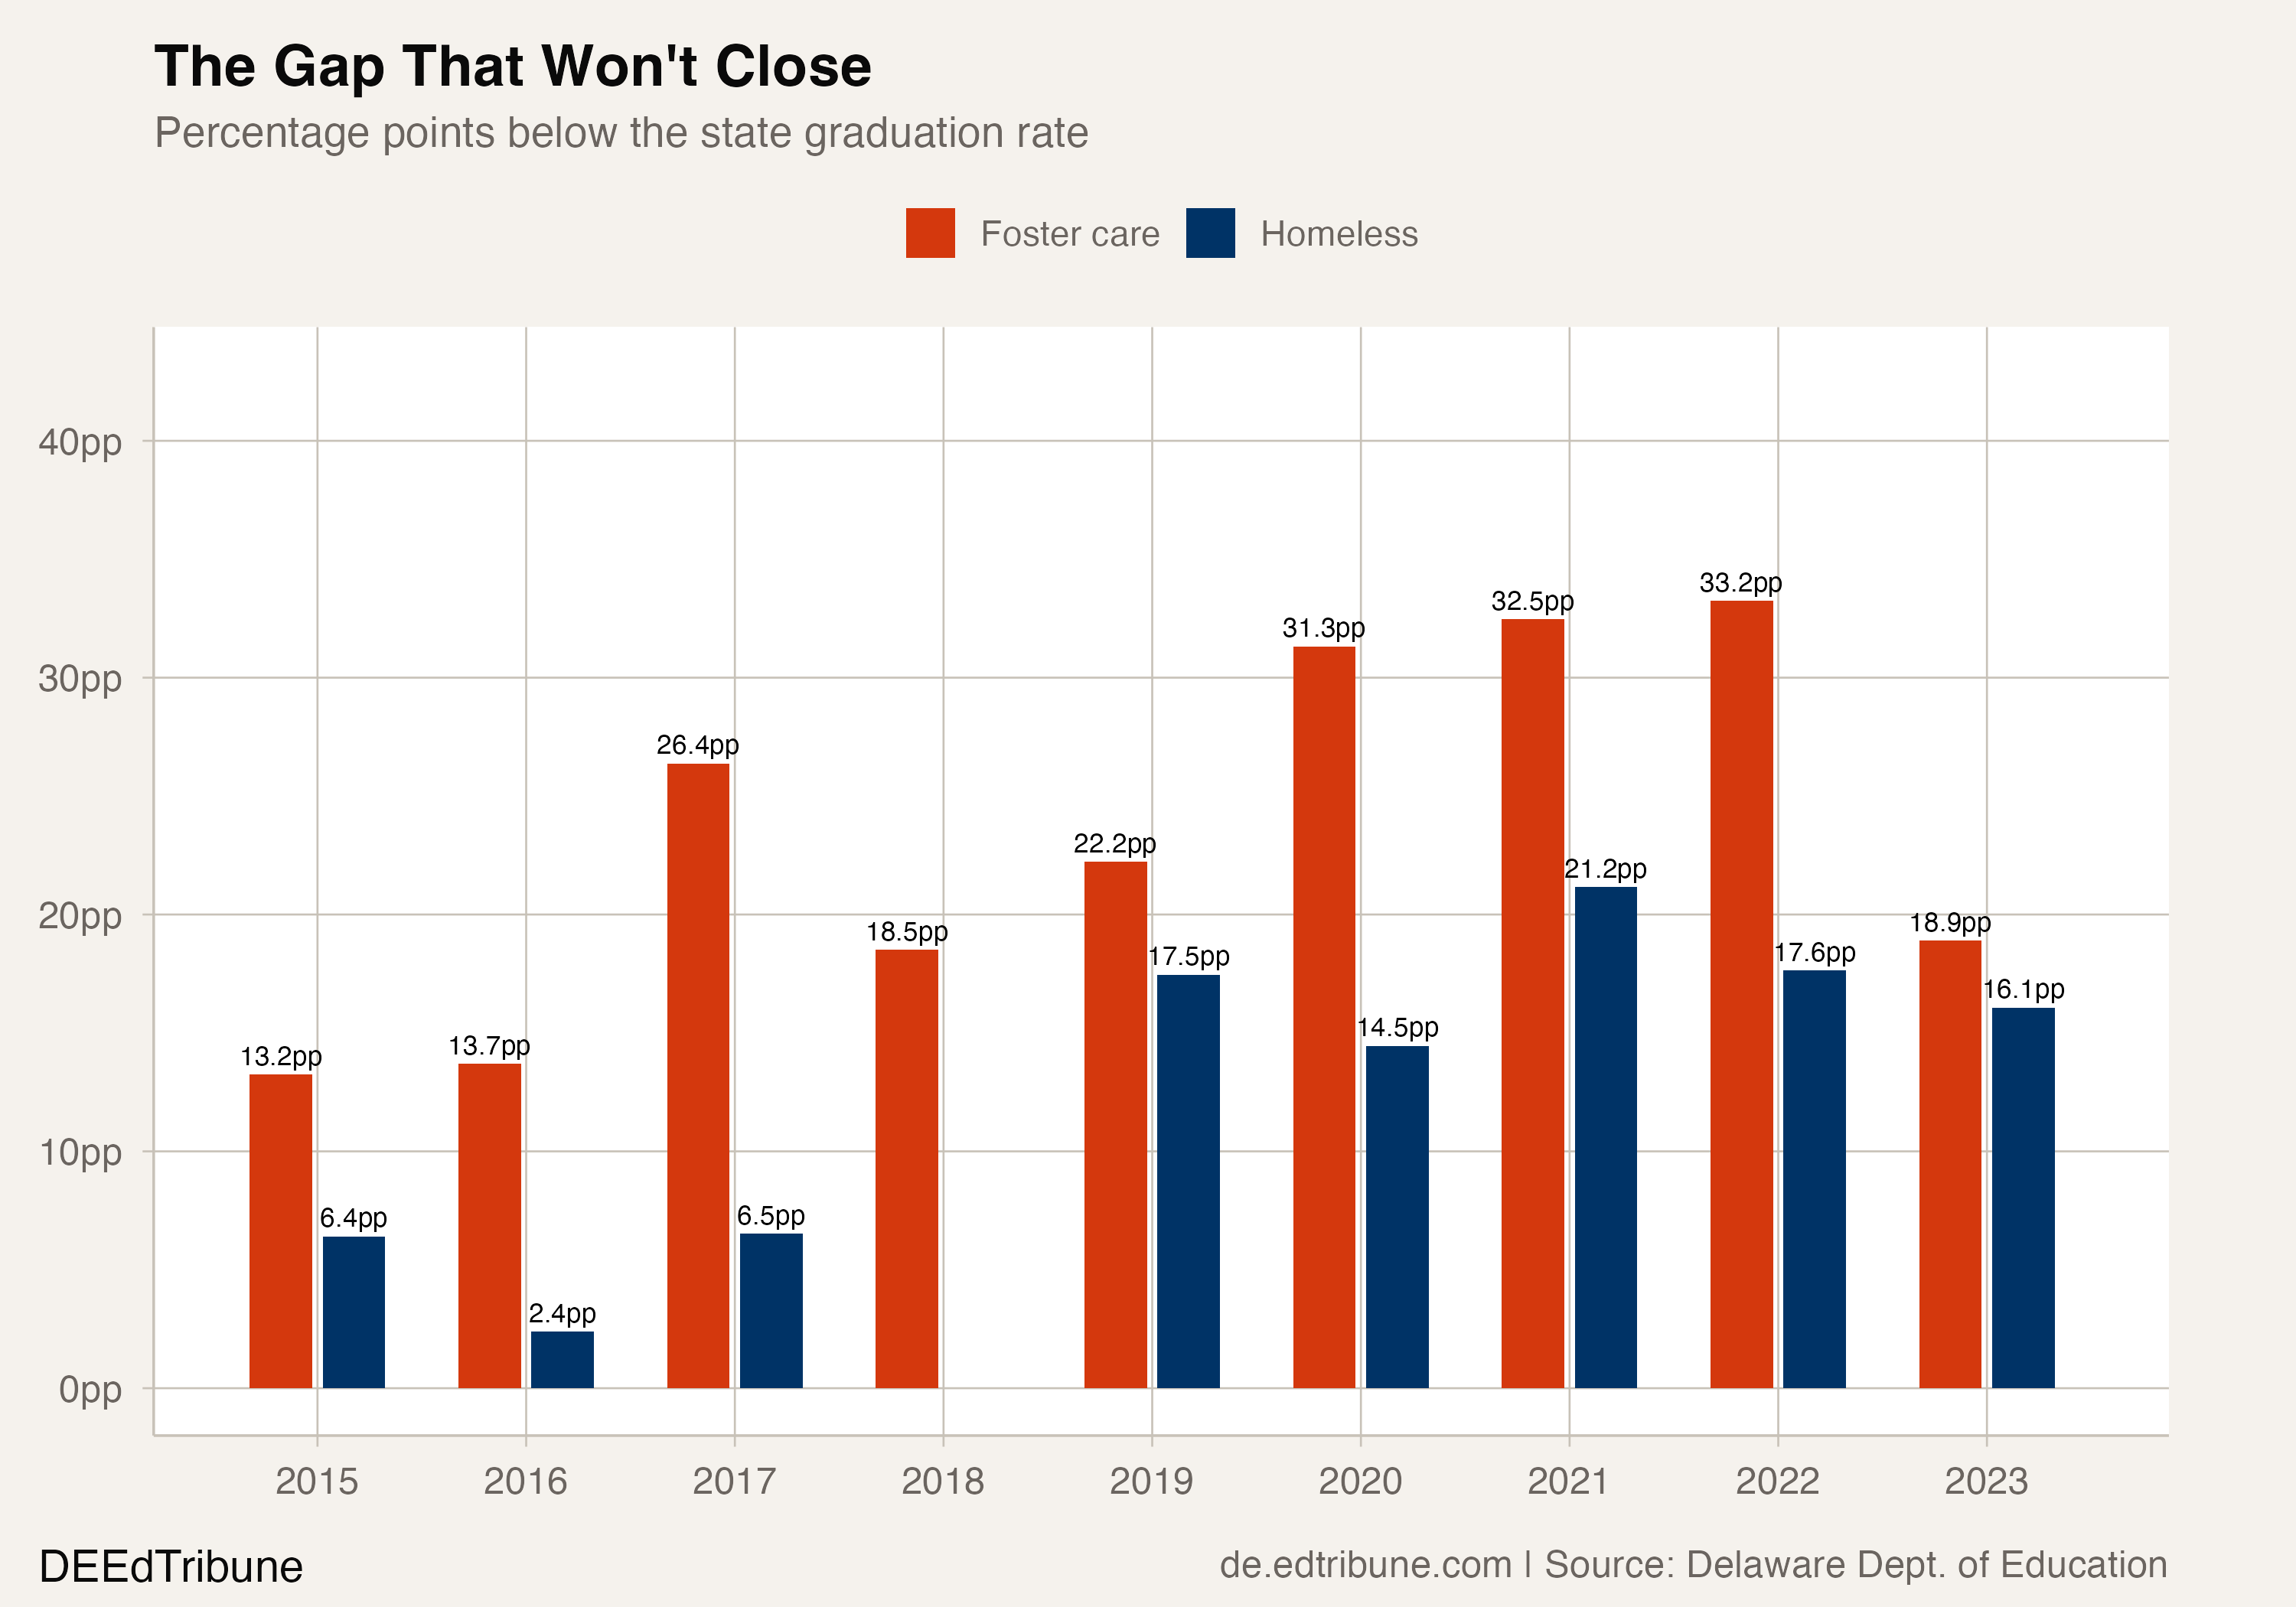
In 2015, students in foster care trailed the state average by 13.2 points. By 2023, the gap was 18.9 points. In 2015, students who are currently homeless trailed by 6.4 points. By 2023, the gap was 16.1 points. For students who are currently homeless, the gap more than doubled.
The asymmetry is notable. Black students closed their gap from 3.2 points to 1.1 points. Economically disadvantaged students closed theirs from 10.7 to 7.3 points. The improvements for race-based and income-based subgroups suggest that whatever Delaware did to raise graduation rates over the past nine years, whether through targeted interventions, attendance monitoring, or credit recovery programs, worked for students who stay in one place. It did not work, or did not reach, students whose living situations change.
Delaware's housing crisis provides an uncomfortable backdrop. The state's 2025 Point-in-Time Count found 1,585 people experiencing homelessness, a 16% increase over 2024. Children under 18 accounted for 27.3% of that total. Governor Matt Meyer signed an executive order in April 2025 establishing the Delaware Interagency Collaborative to End Homelessness, with a goal of cutting homelessness in half and ending youth homelessness within five years.
For youth in foster care, the state's ASPIRE529 program offers $529 awards to help with post-secondary expenses, and a tuition waiver program has supported about 40 former youth in foster care since 2022. But State Treasurer Colleen Davis has acknowledged the scale of the challenge: just over 50% of Delaware's youth in foster care graduate high school, and fewer than 5% pursue four-year degrees.
What a 70-student cohort can and cannot tell us
The honest limitation of this data is sample size. A foster care graduation cohort of 70 students means that the difference between a "crisis" year (54.6%) and a "recovery" year (70.0%) is about 11 additional graduates. The 2023 bounce, while encouraging, could reflect a single district improving its support services, a favorable mix of student needs, or statistical reversion to mean.
The homeless cohort at 438 is large enough for the trend to carry more weight. That group's persistent decline, 5.1 points over nine years while every other subgroup improved, is harder to explain away as noise.
The question Delaware faces is whether the 2023 foster care rebound marks a structural improvement or a one-year fluctuation. The state's graduation data for the class of 2024 has not yet been released. If the foster care rate holds near 70% or climbs further, Delaware can argue that the 2020-2022 trough was a COVID artifact on a tiny cohort. If it drops back toward the mid-50s, the state will need to confront the possibility that its graduation interventions are systematically failing the students with the least stable homes.
Detailed code that reproduces the analysis and figures in this article is available exclusively to EdTribune subscribers.
Discussion
Sign in to join the discussion.
Loading comments...