Christina School District↗ET added 767 special education students over the past decade. It lost 4,773 general education students over the same period.
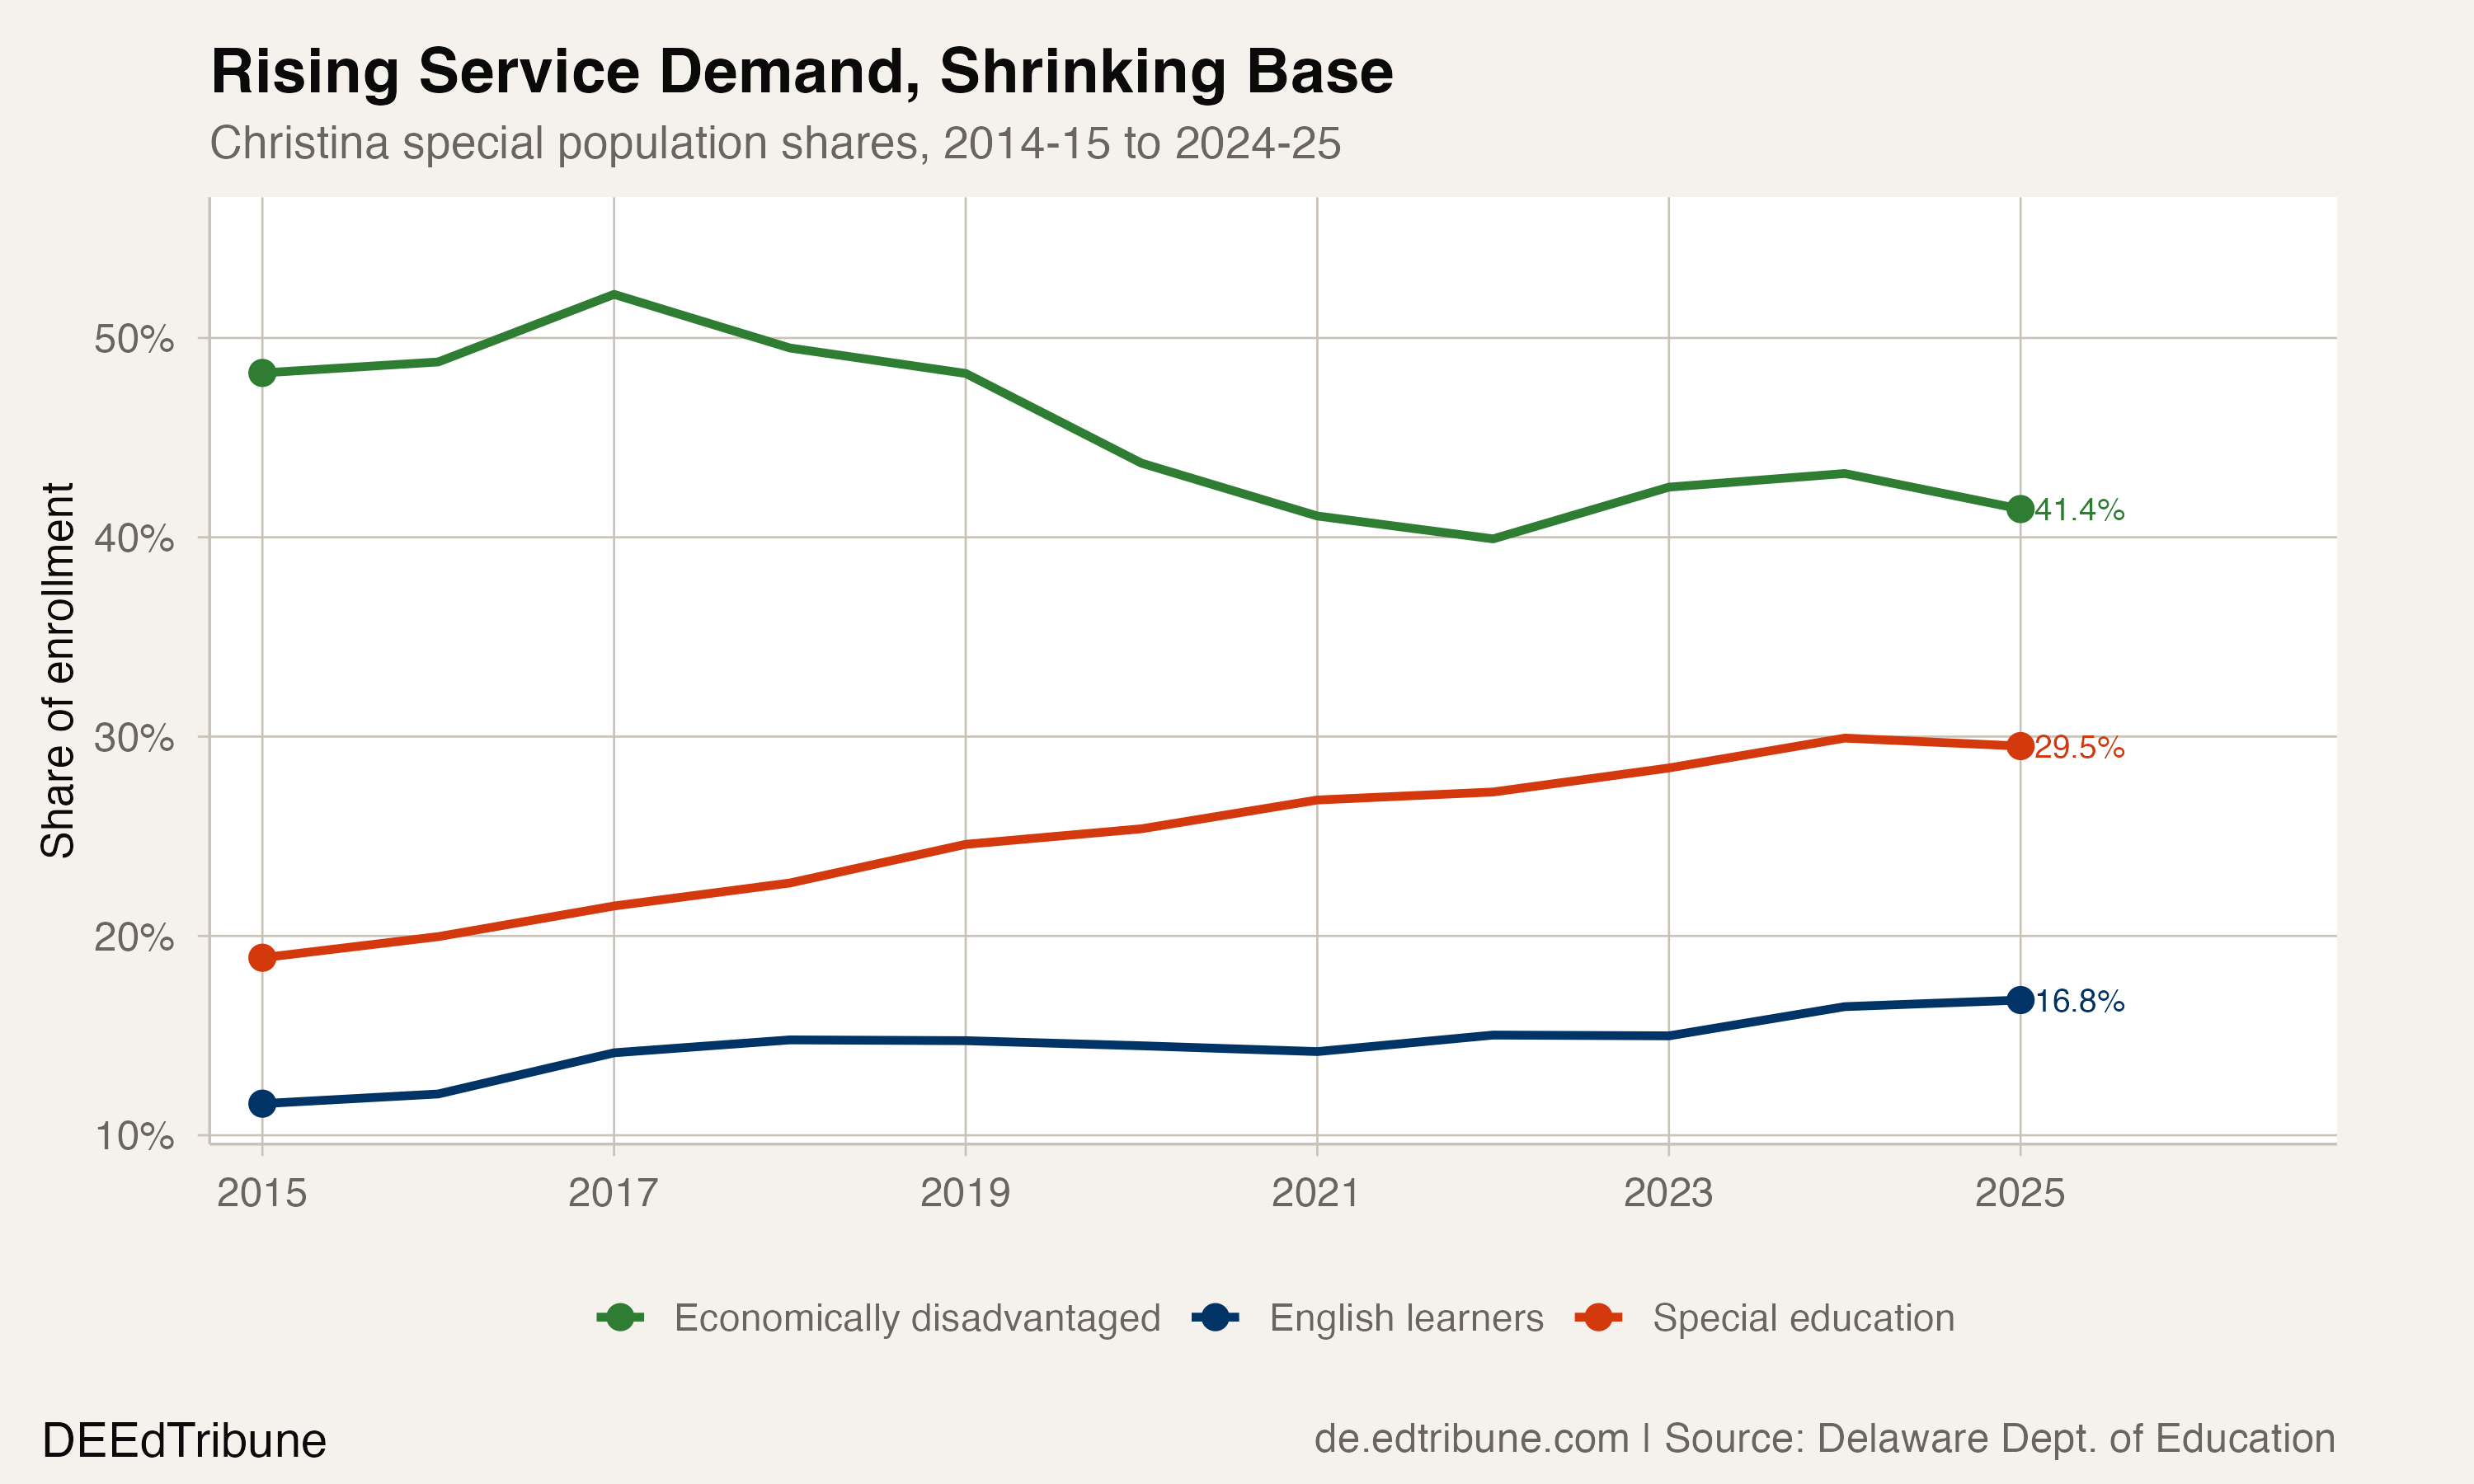
Those two numbers, moving in opposite directions, explain a fiscal reality that enrollment totals alone cannot capture. Christina's special education rate rose from 18.9% to 29.5% between 2014-15 and 2024-25, a 10.6 percentage-point increase that brought the district from modestly above the state average to 7.5 points above it. The rate did not rise because Christina dramatically expanded identification. It rose because the students leaving the district were disproportionately not receiving special education services, while the students who stayed, or arrived, were.
Two lines, one district
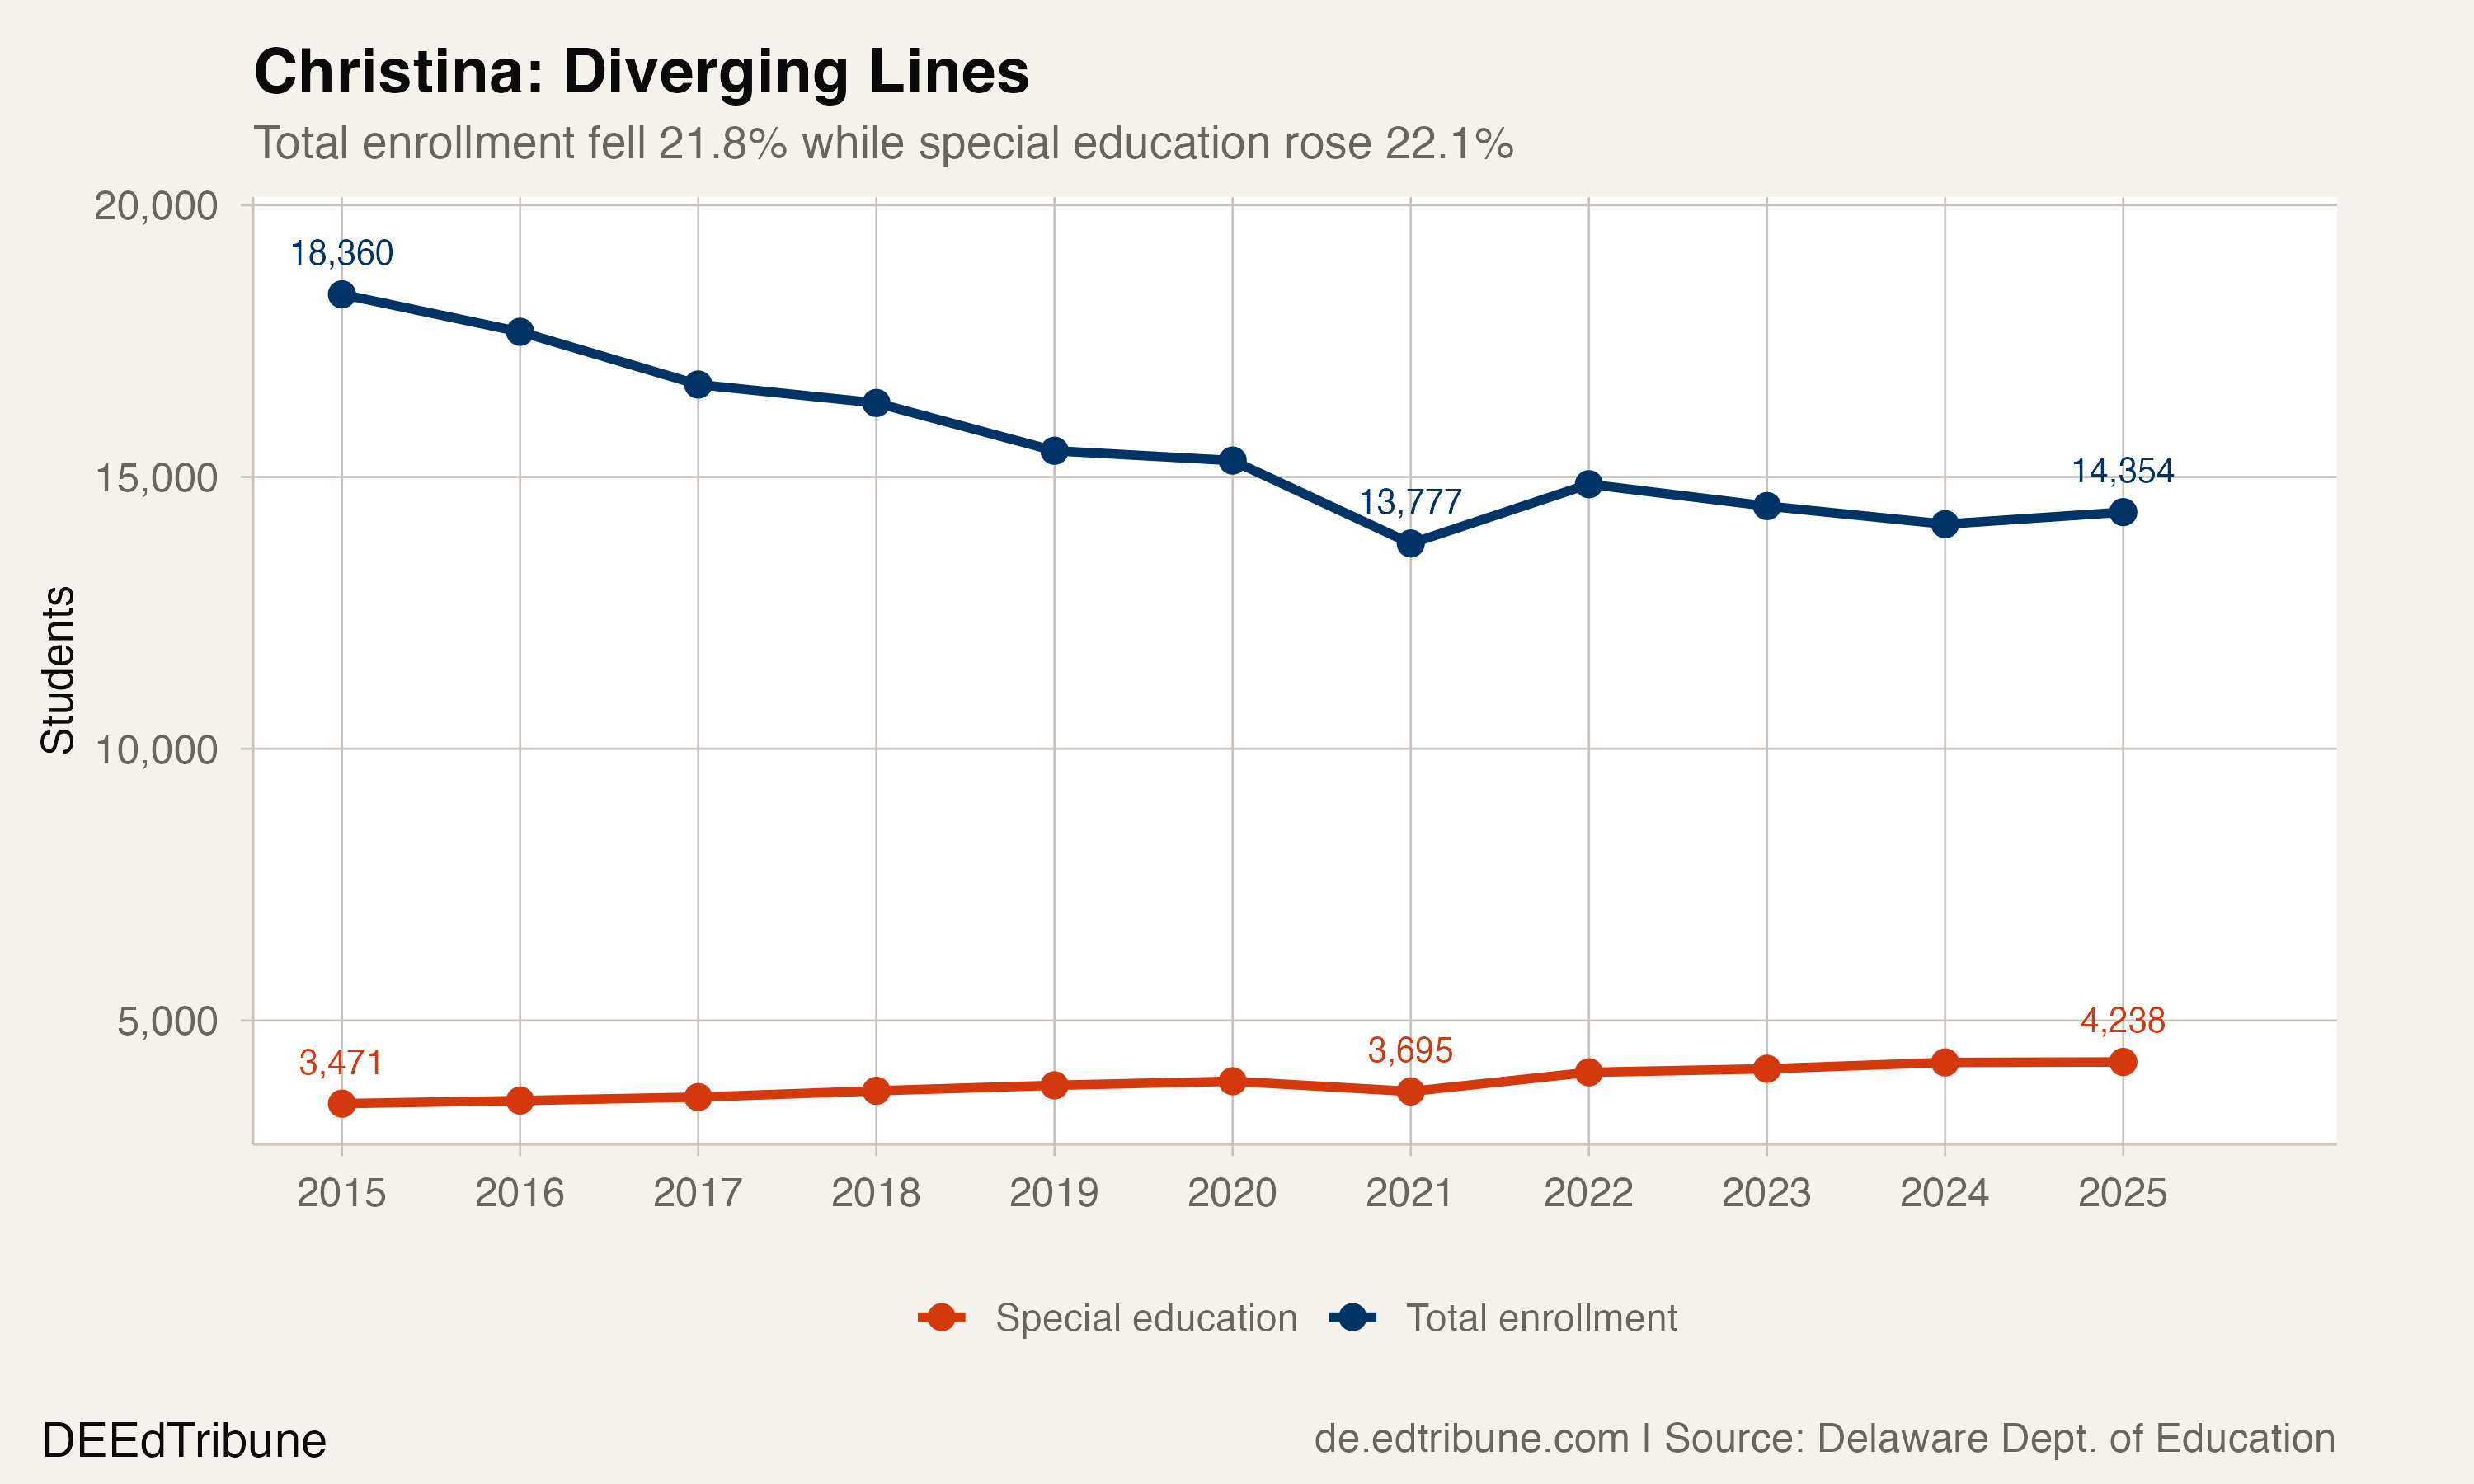
Christina's total enrollment fell from 18,360 to 14,354 between 2014-15 and 2024-25, a 21.8% decline. Over the same period, the number of students receiving special education services grew from 3,471 to 4,238, a 22.1% increase. The lines crossed in opposite directions: every year except 2020-21, when the pandemic compressed both totals, Christina served more special education students than the year before.
The general education population absorbed the full impact. Students not receiving special education services fell from 14,889 to 10,116, a 32.1% decline. That is roughly 1.5 times the rate of total enrollment loss, because the students who left were disproportionately general education students.
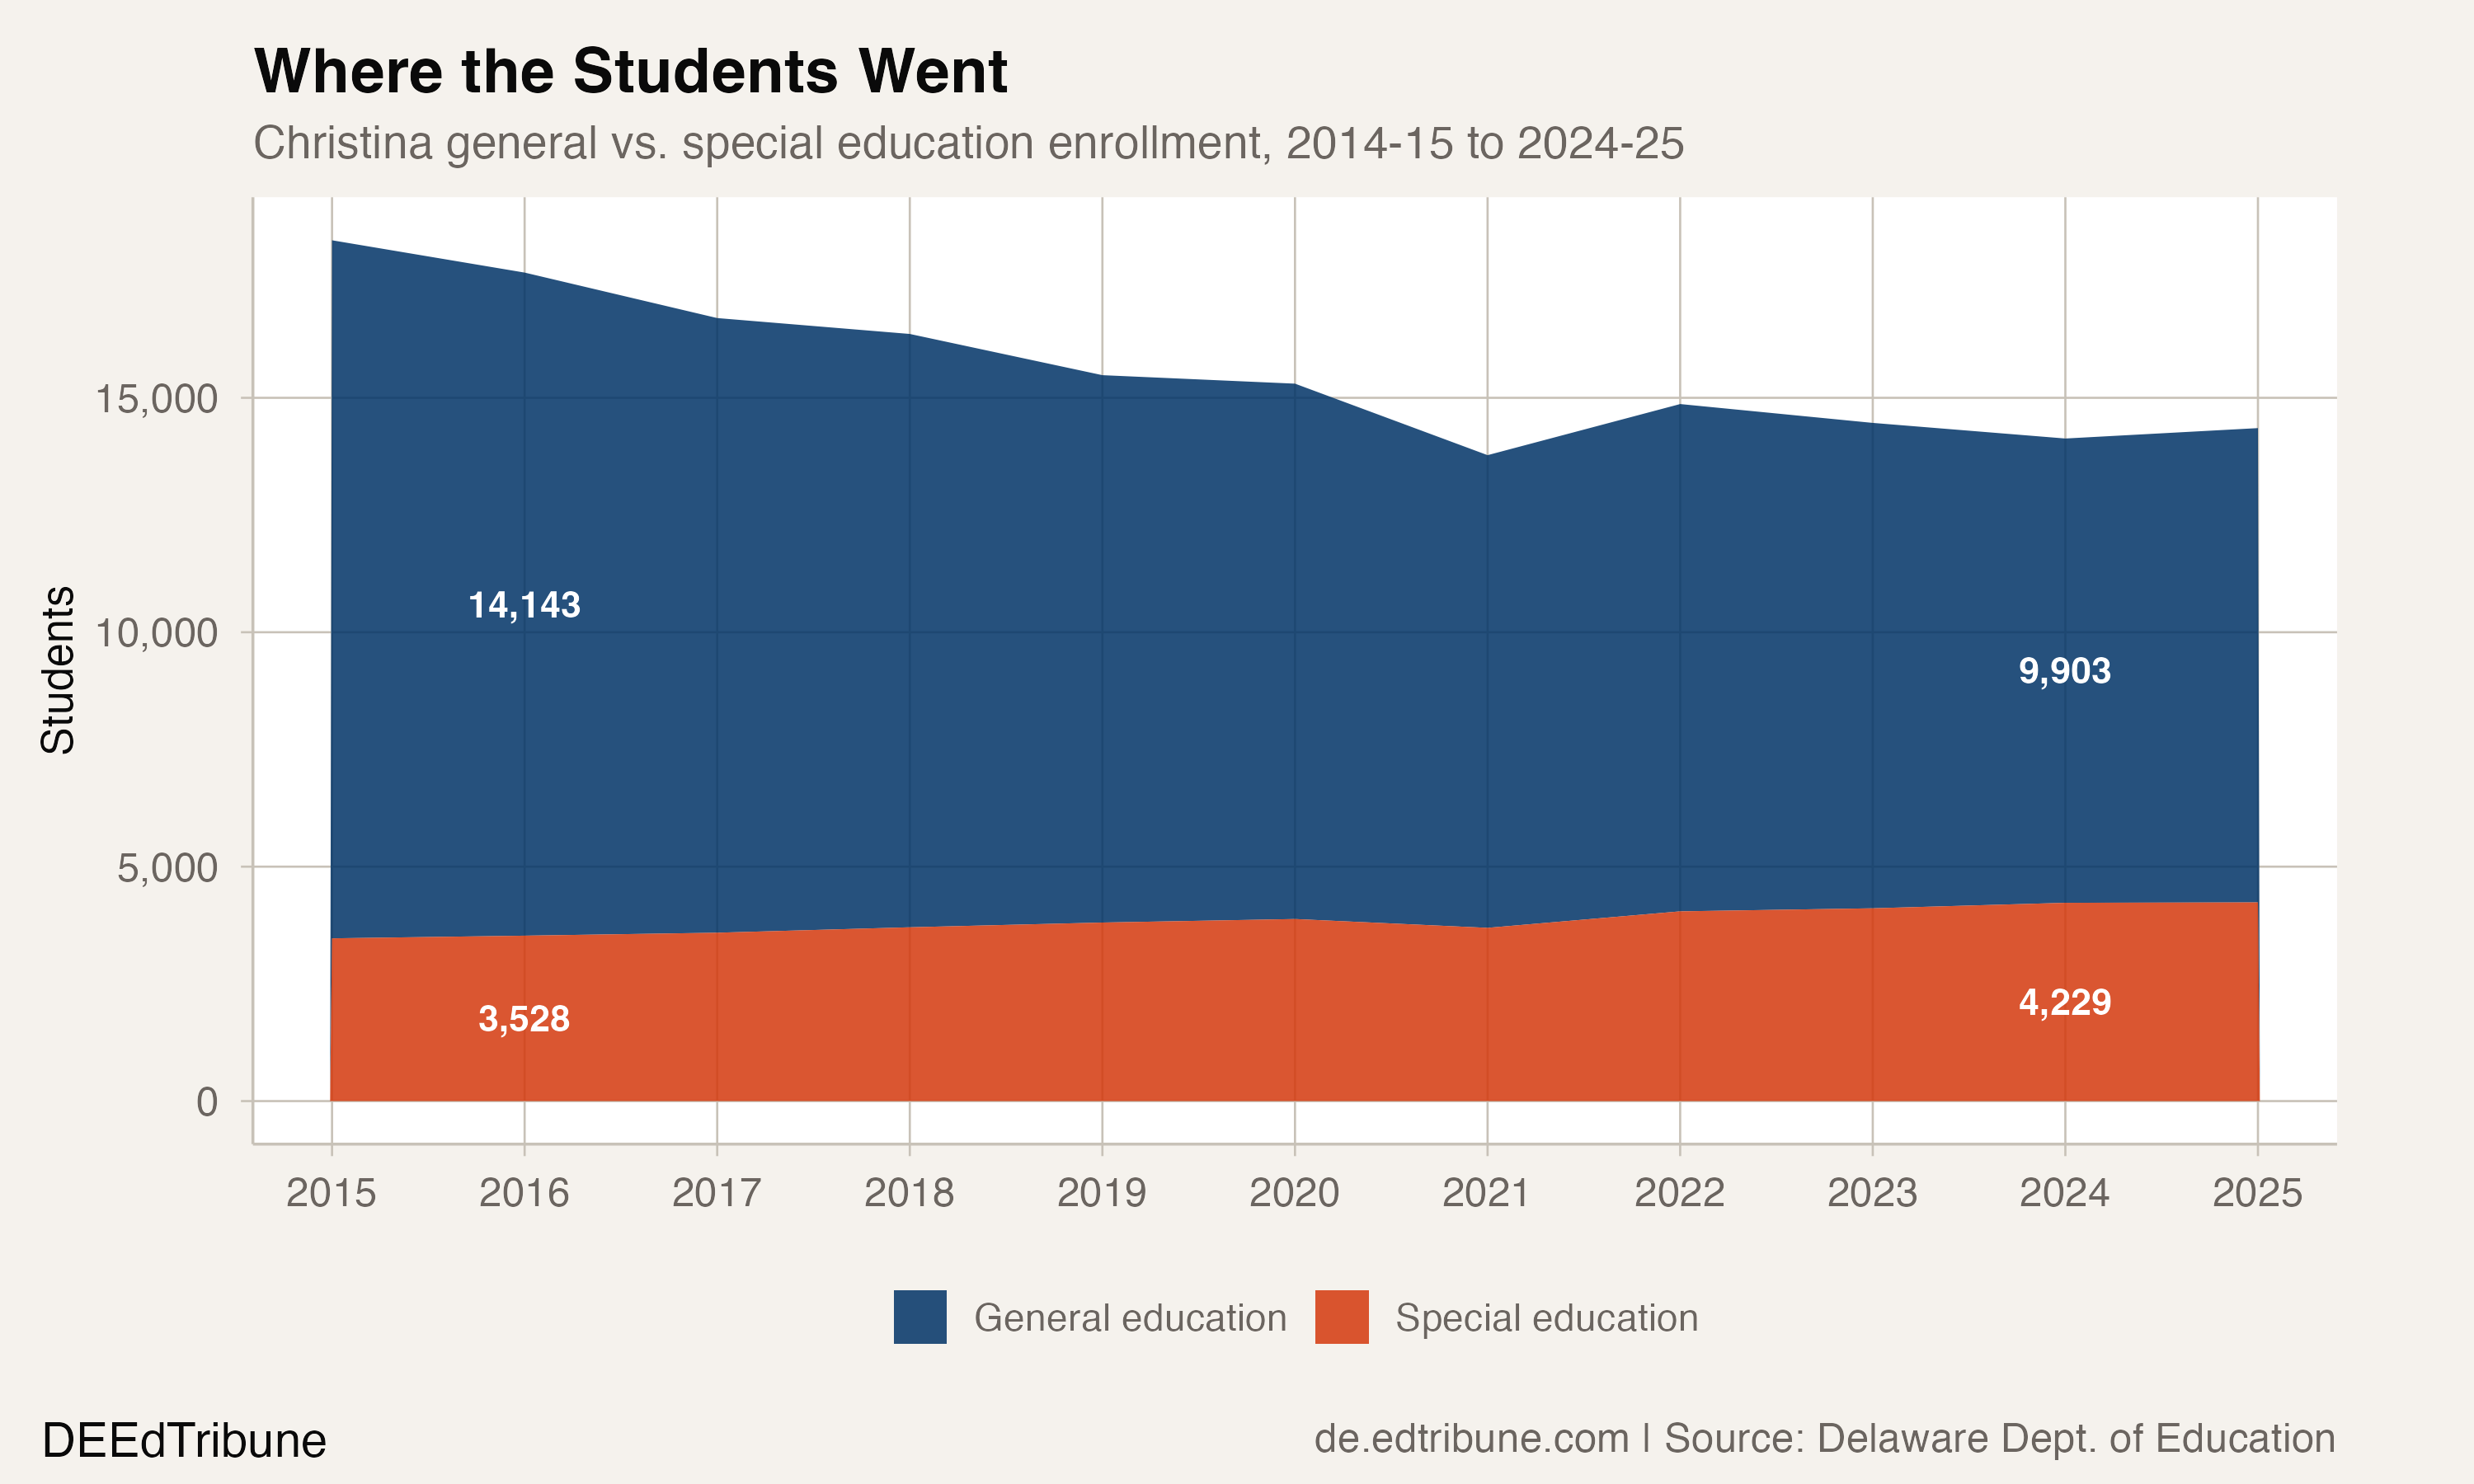
The effect is a district that looks fundamentally different than it did a decade ago. In 2014-15, roughly one in five Christina students received special education. In 2024-25, it is closer to one in three.
A statewide pattern, concentrated in Christina
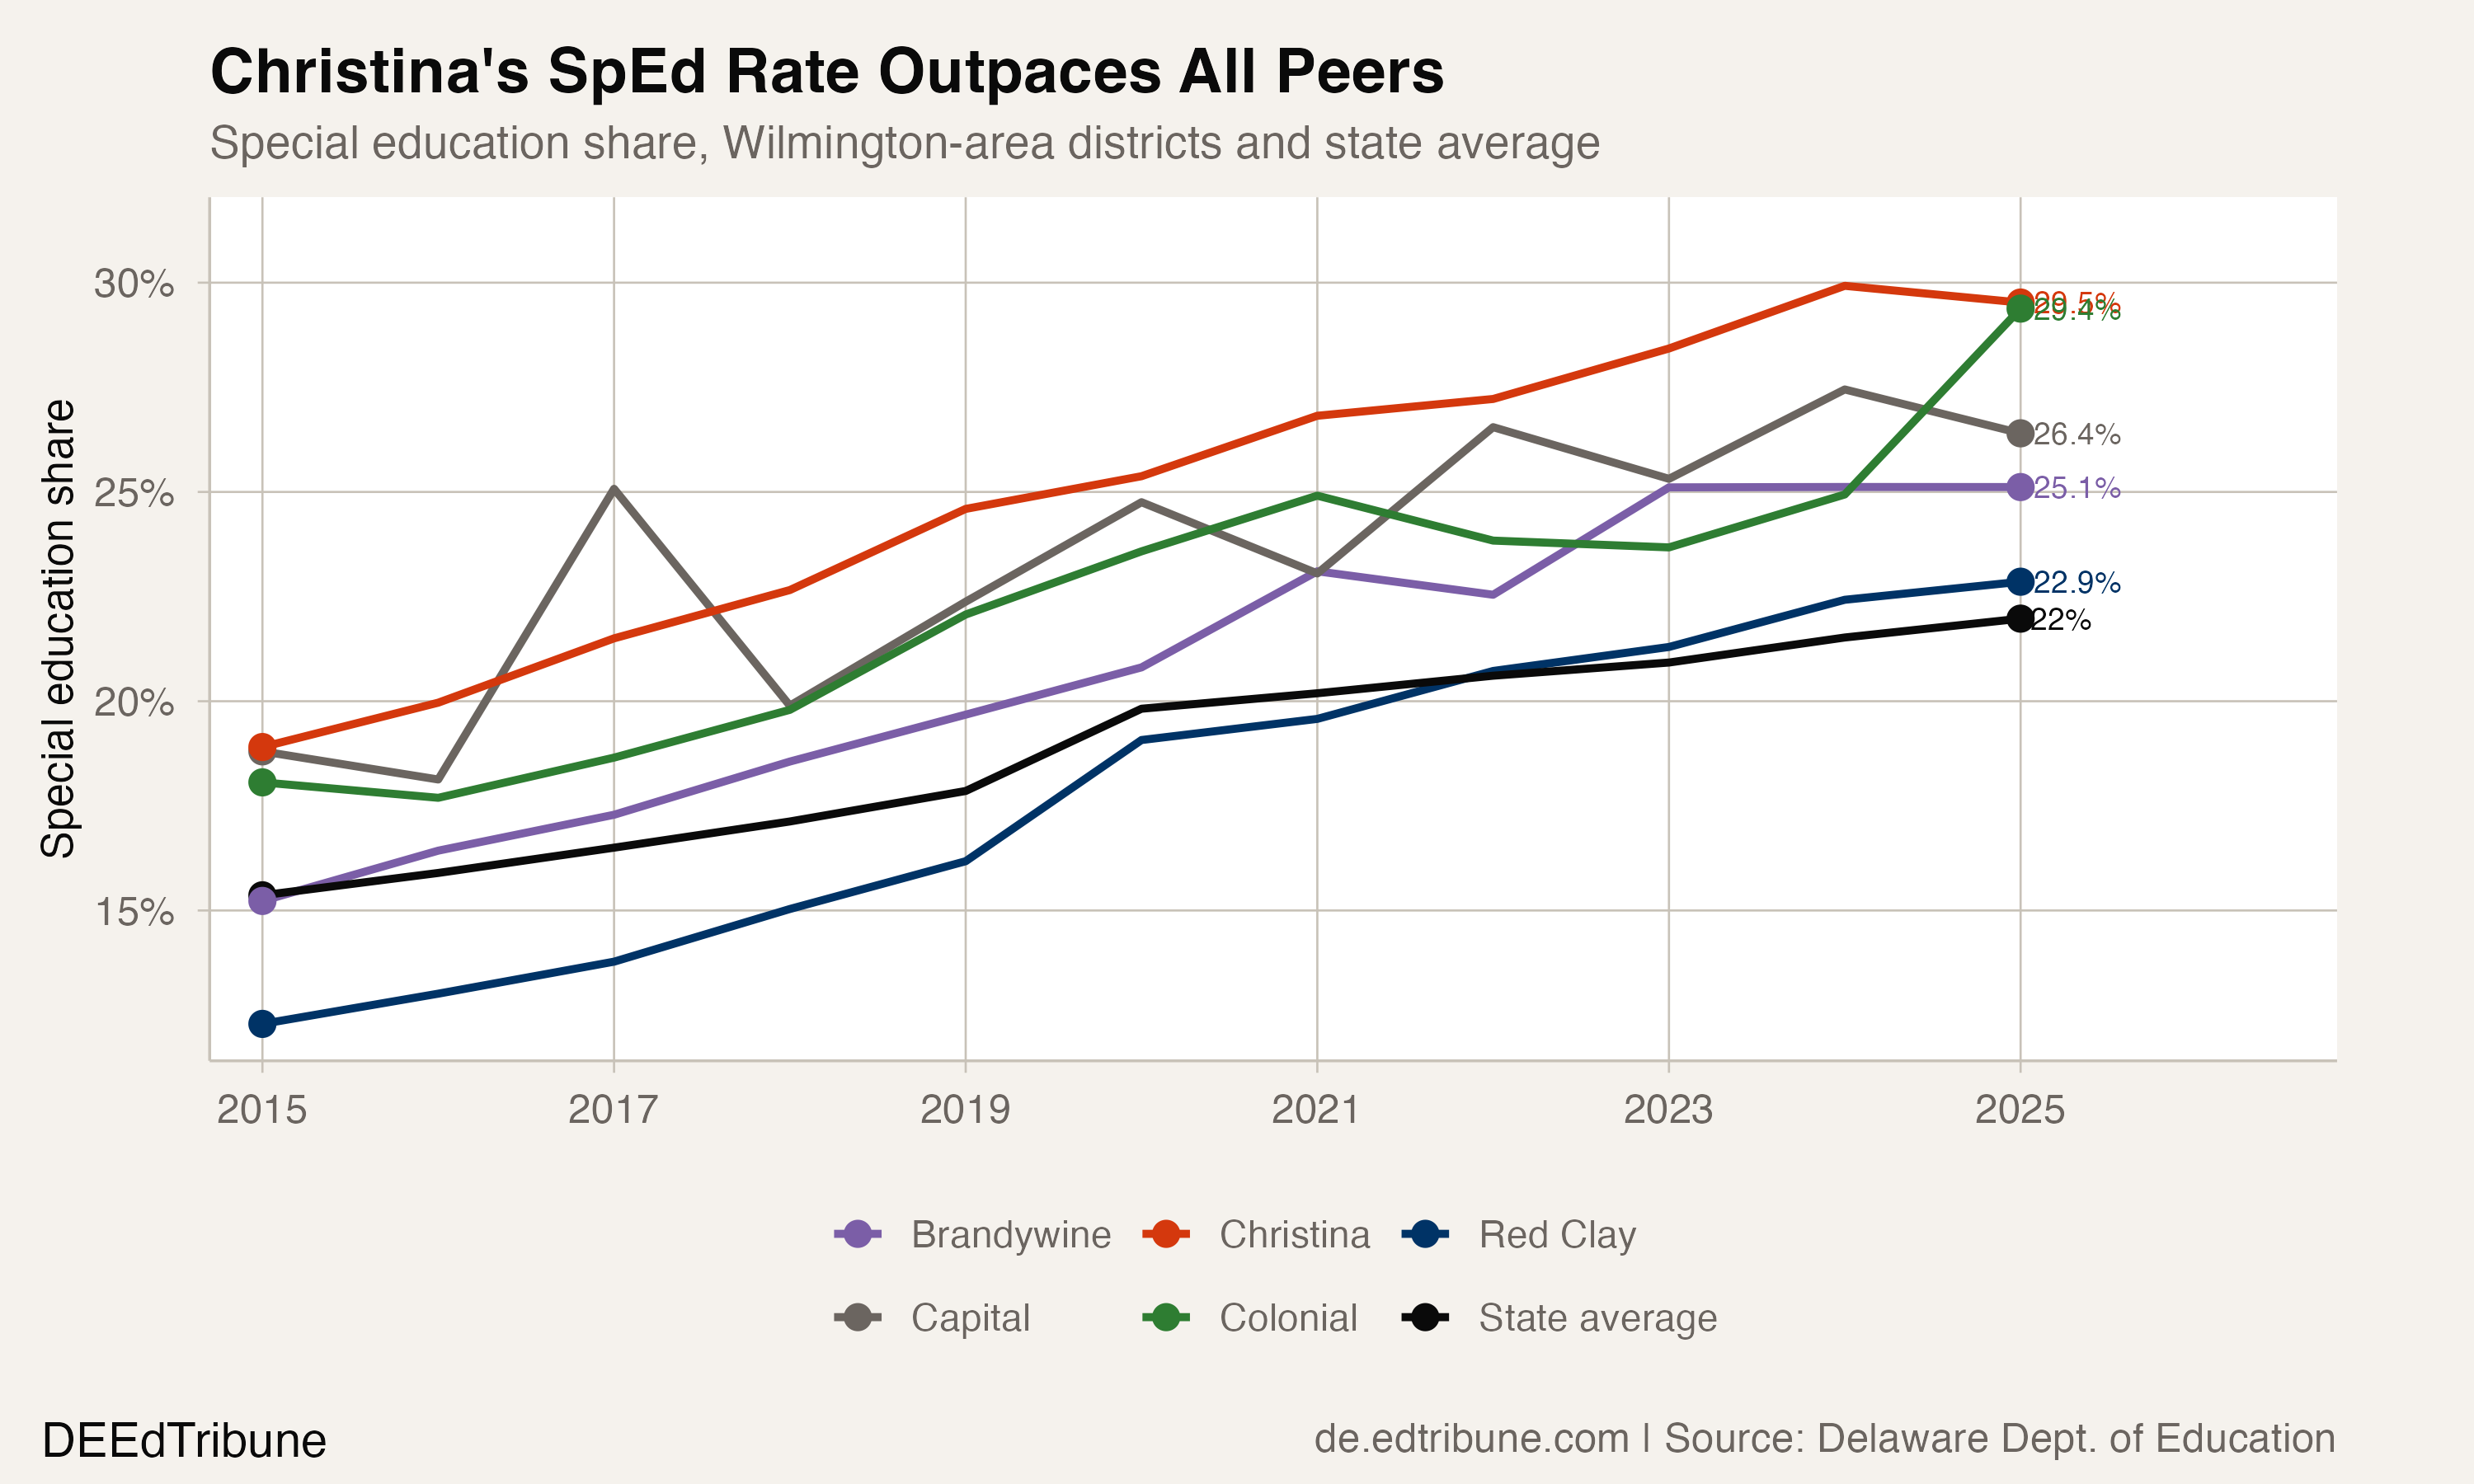
Special education rates are rising across Delaware. The statewide rate climbed from 15.4% to 22.0% over the decade, a 6.6 percentage-point increase that national data confirms is part of a broader trend. The number of school-age IDEA-eligible students nationwide increased 3.9% between 2023 and 2024, reaching 7.6 million.
Christina's peers in the Wilmington area experienced similar increases in percentage-point terms. Colonial↗ET rose 11.3 points (18.1% to 29.4%), Red Clay↗ET rose 10.6 points (12.3% to 22.9%), and Brandywine↗ET rose 9.9 points (15.2% to 25.1%). But Christina started higher than all of them except Capital↗ET, and the combination of a high starting point with a large increase pushed it to the top of the traditional-district rankings.
The question is why Christina's baseline was already elevated in 2014-15 and why it stayed above peers throughout the decade. Part of the answer is structural. Christina hosts the Delaware School for the Deaf and operates Delaware's statewide programs for deaf, hard-of-hearing, and deaf-blind students. It also runs the Brennen School/Delaware Autism Program, Networks School for Employability Skills, and several other specialized programs that draw students from across the state. These state-designated programs inflate Christina's special education count beyond what its geographic enrollment would produce.
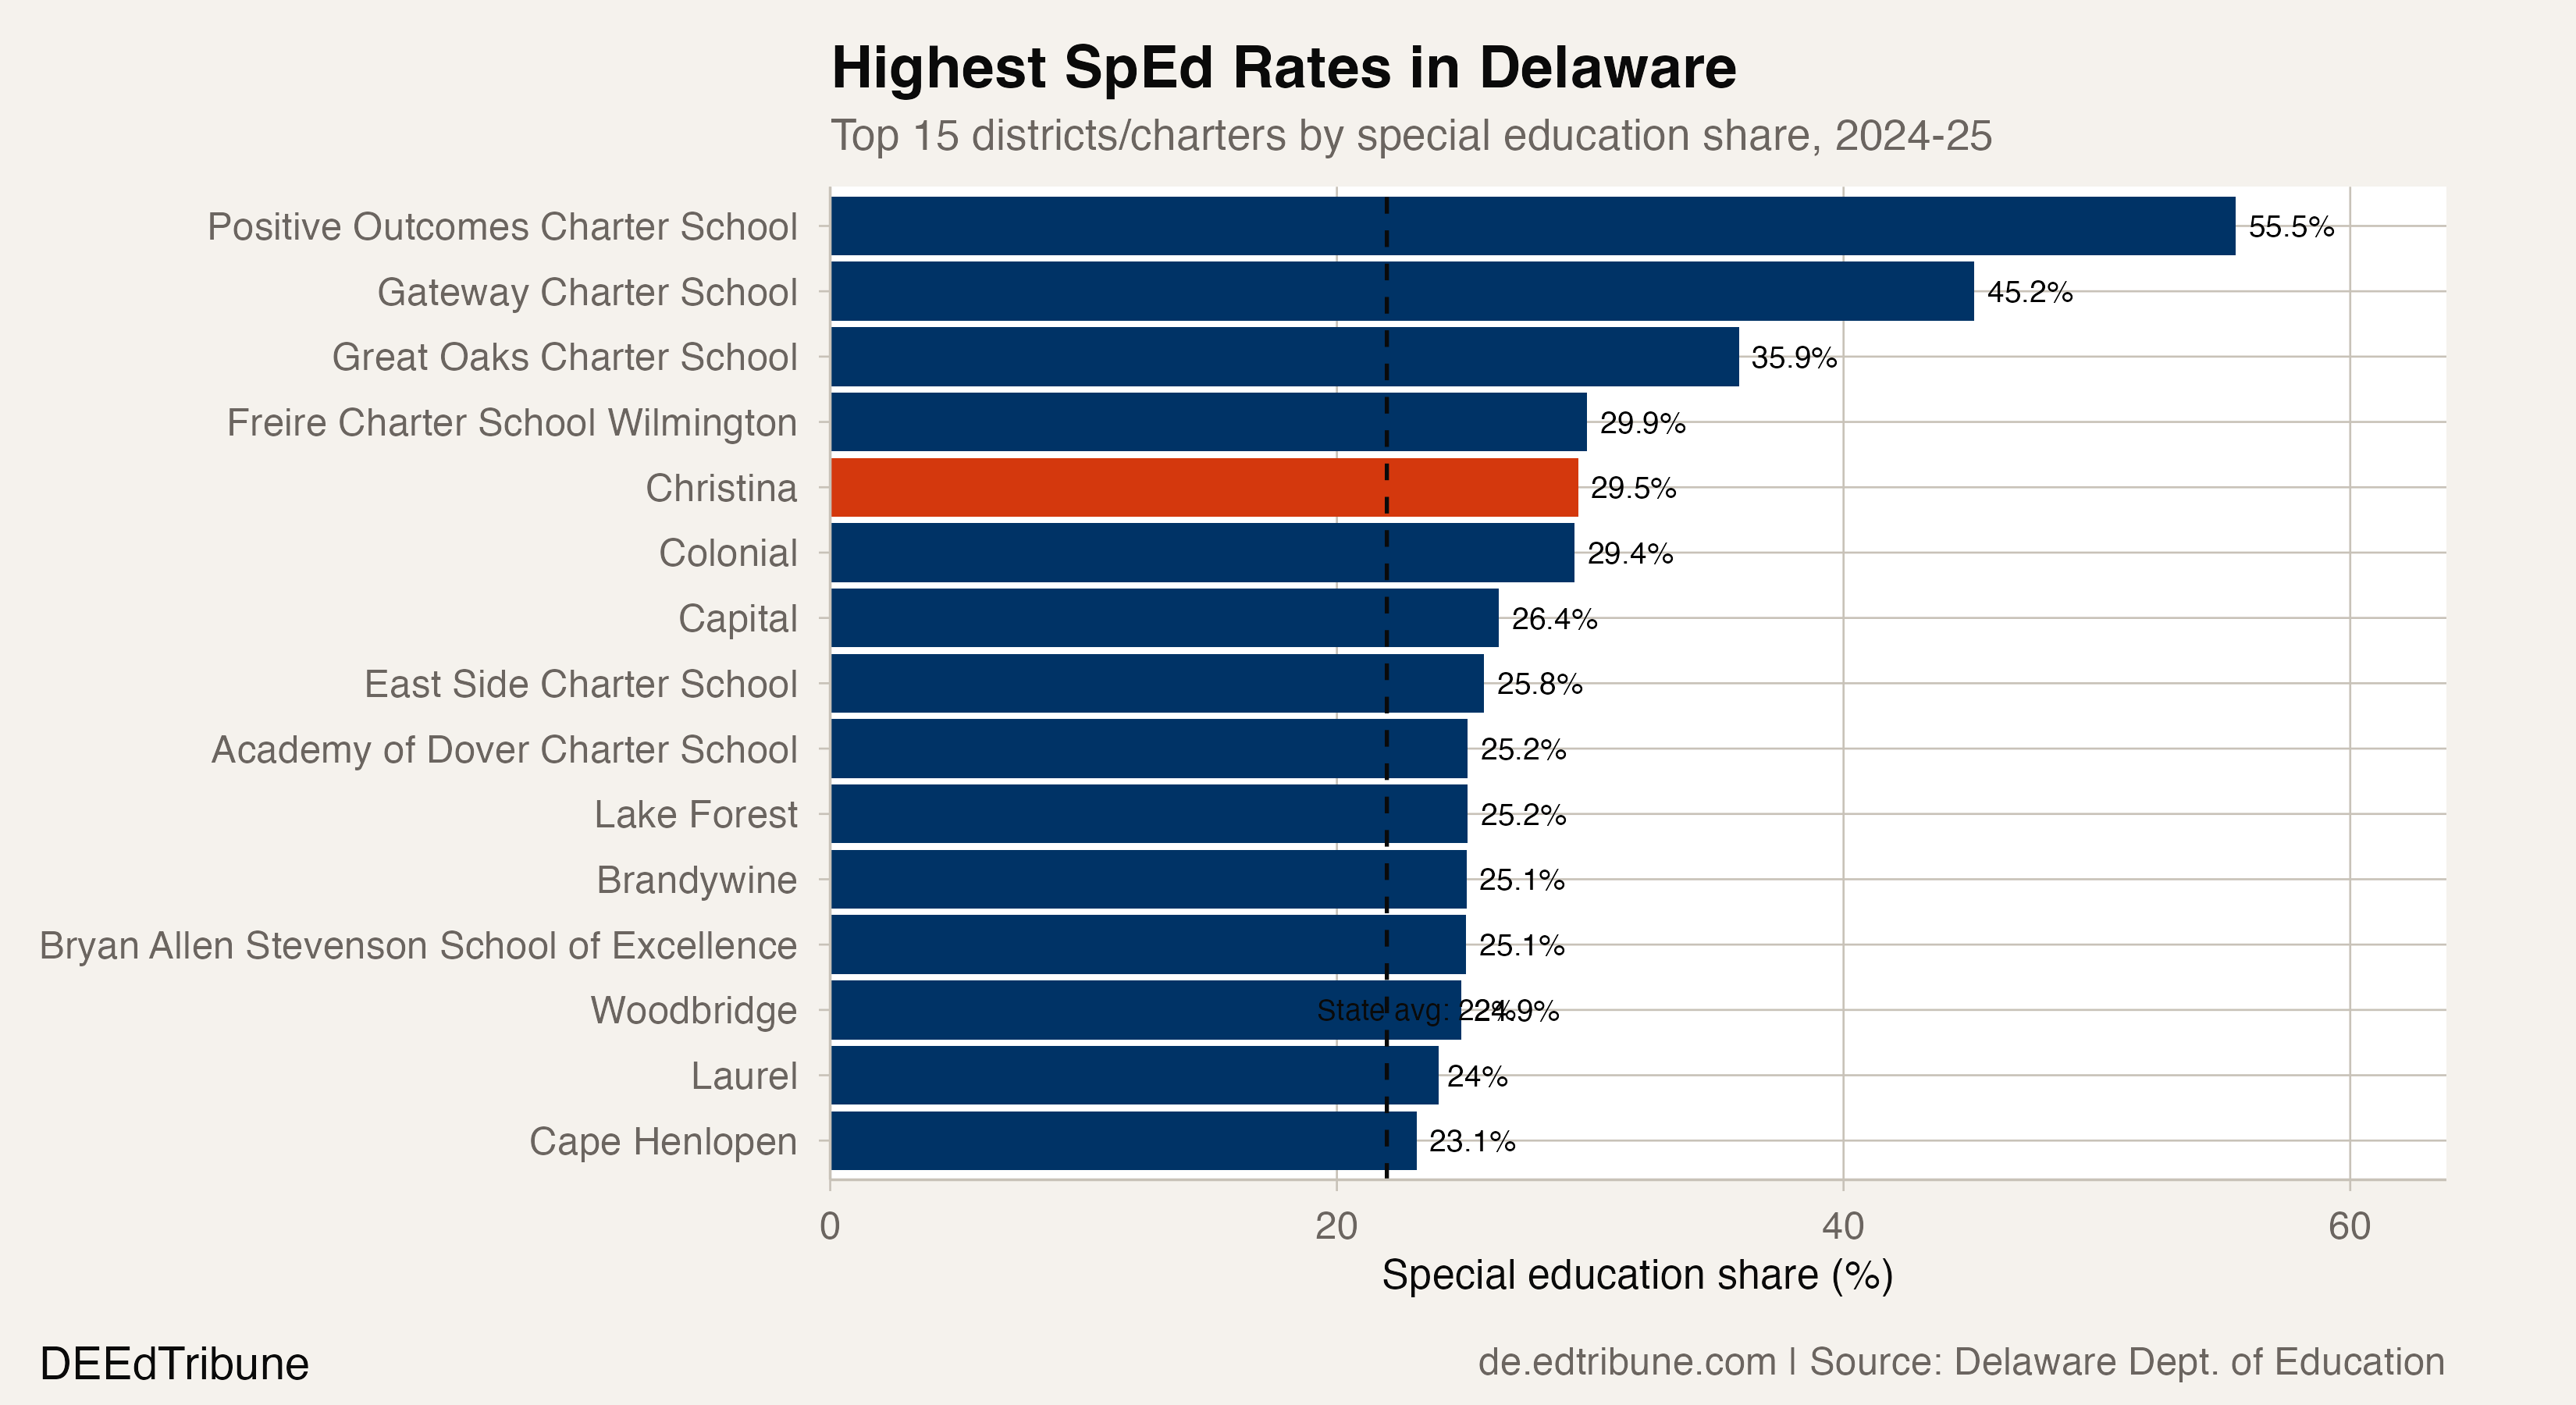
Among all Delaware entities, Christina ranks fifth in special education share at 29.5%, behind four charter schools with smaller total enrollments: Positive Outcomes (55.5%), Gateway (45.2%), Great Oaks (35.9%), and Freire Wilmington (29.9%). Among traditional districts, Christina leads the state.
The mechanism behind the shift
Two forces drive a rising special education rate: more students being identified, and fewer non-identified students remaining. In Christina's case, both forces operated simultaneously.
The identification question is the harder one to untangle. Delaware's IDEA Part B determination has been "Needs Assistance" for both 2024 and 2025, indicating the state itself is grappling with how identification practices interact with service delivery. Nationally, improved screening tools, broader autism spectrum identification criteria, and post-pandemic recognition of learning disabilities have all contributed to rising rates. Whether Christina's 10.6-point increase reflects genuine identification improvements, compositional change from enrollment loss, or some combination is not determinable from enrollment data alone.
The enrollment-loss effect, by contrast, is straightforward arithmetic. When 4,773 general education students leave a district and 767 special education students arrive, the rate rises mechanically even if identification practices do not change. Delaware's open-enrollment system, which allows families to apply to any public school or charter statewide, facilitates precisely this kind of sorting. Newark Charter School↗ET grew from 1,952 to 3,115 students over the decade. Its special education rate in 2024-25 was 12.3%, less than half of Christina's. Odyssey Charter School↗ET, which more than doubled to 2,375 students, had a rate of 15.6%.
The pattern is consistent with a selection dynamic in which families of students not receiving specialized services are more mobile. They can choice into charters or neighboring districts without disrupting an IEP, specialized placement, or related services. Families of students with disabilities may be less likely to leave a district that already provides the services their children are entitled to, particularly when those services include state-designated programs that do not exist elsewhere.
The funding gap behind the gap
The fiscal consequences of serving a higher-need population while losing enrollment are compounded by Delaware's funding structure. The state's unit-count system allocates teaching positions based on enrollment tiers rather than student need. A 2023 assessment by the American Institutes for Research found that Delaware would need to invest an additional $600 million to $1 billion to meet recommended adequacy standards, with the current system providing "fewer financial resources and experienced teachers" to schools with higher concentrations of low-income and multilingual learners.
"Delaware's current formula does not do enough to support low-income students and multilingual learners." -- AIR Assessment of Delaware Public School Funding, Rodel Foundation summary, 2023
Christina sits at the intersection of every dimension AIR identified as underfunded. Its economically disadvantaged rate, while it has declined from 48.2% to 41.4% over the decade, remains well above the state's traditional-district median. Its English learner share rose from 11.6% to 16.8%. These service populations overlap substantially with each other and with special education enrollment, but each carries distinct instructional costs: bilingual staff, specialized curricula, compliance documentation, and individualized planning.
Delaware's Opportunity Funding program, which allocates roughly $66 million statewide in fiscal year 2026, provides $616 per English learner and $616 per low-income student. That per-student supplement was designed to partially address the gap AIR documented, but it does not adjust for the compounding effect of multiple high-need categories in a single district with a shrinking enrollment base.
The merger variable
The Redding Consortium's December 2025 vote to study merging Christina, Brandywine, Colonial, and Red Clay into a single Northern New Castle County district would redistribute Christina's special education concentration across a broader enrollment base and a larger tax base. A Delaware legislative issue brief on special education teacher workloads found that 36 states, including Delaware, reported statewide shortages of special education teachers for the 2024-25 school year. In a district where nearly one in three students has an IEP, those shortages hit hardest. Whether spreading 4,238 IEPs across a 52,641-student consolidated district would improve services is the question the merger must eventually answer.
Detailed code that reproduces the analysis and figures in this article is available exclusively to EdTribune subscribers.
Discussion
Sign in to join the discussion.
Loading comments...