In Capital↗ET School District in Dover, 35.0% of students who are economically disadvantaged were chronically absent in 2024-25. That means roughly one in three of these students in the district missed at least 18 school days, enough to fall a full month behind in instruction. Capital's overall chronic absenteeism rate, 26.1%, is already the highest among Delaware's 19 traditional districts. But for the 3,398 students the state classifies as economically disadvantaged, nearly half the district's enrollment, the rate runs nine percentage points higher still.
Capital is not an outlier in the direction of its income gap. It is an outlier in degree. Across Delaware, students who are economically disadvantaged were chronically absent at a rate of 27.6% in 2024-25, compared with 12.9% for students not classified as economically disadvantaged. The gap: 14.7 percentage points. The ratio: 2.14 to 1. For every 100 students not classified as economically disadvantaged who miss too much school, 214 students who are economically disadvantaged do the same.
A gap that COVID widened and recovery has not closed
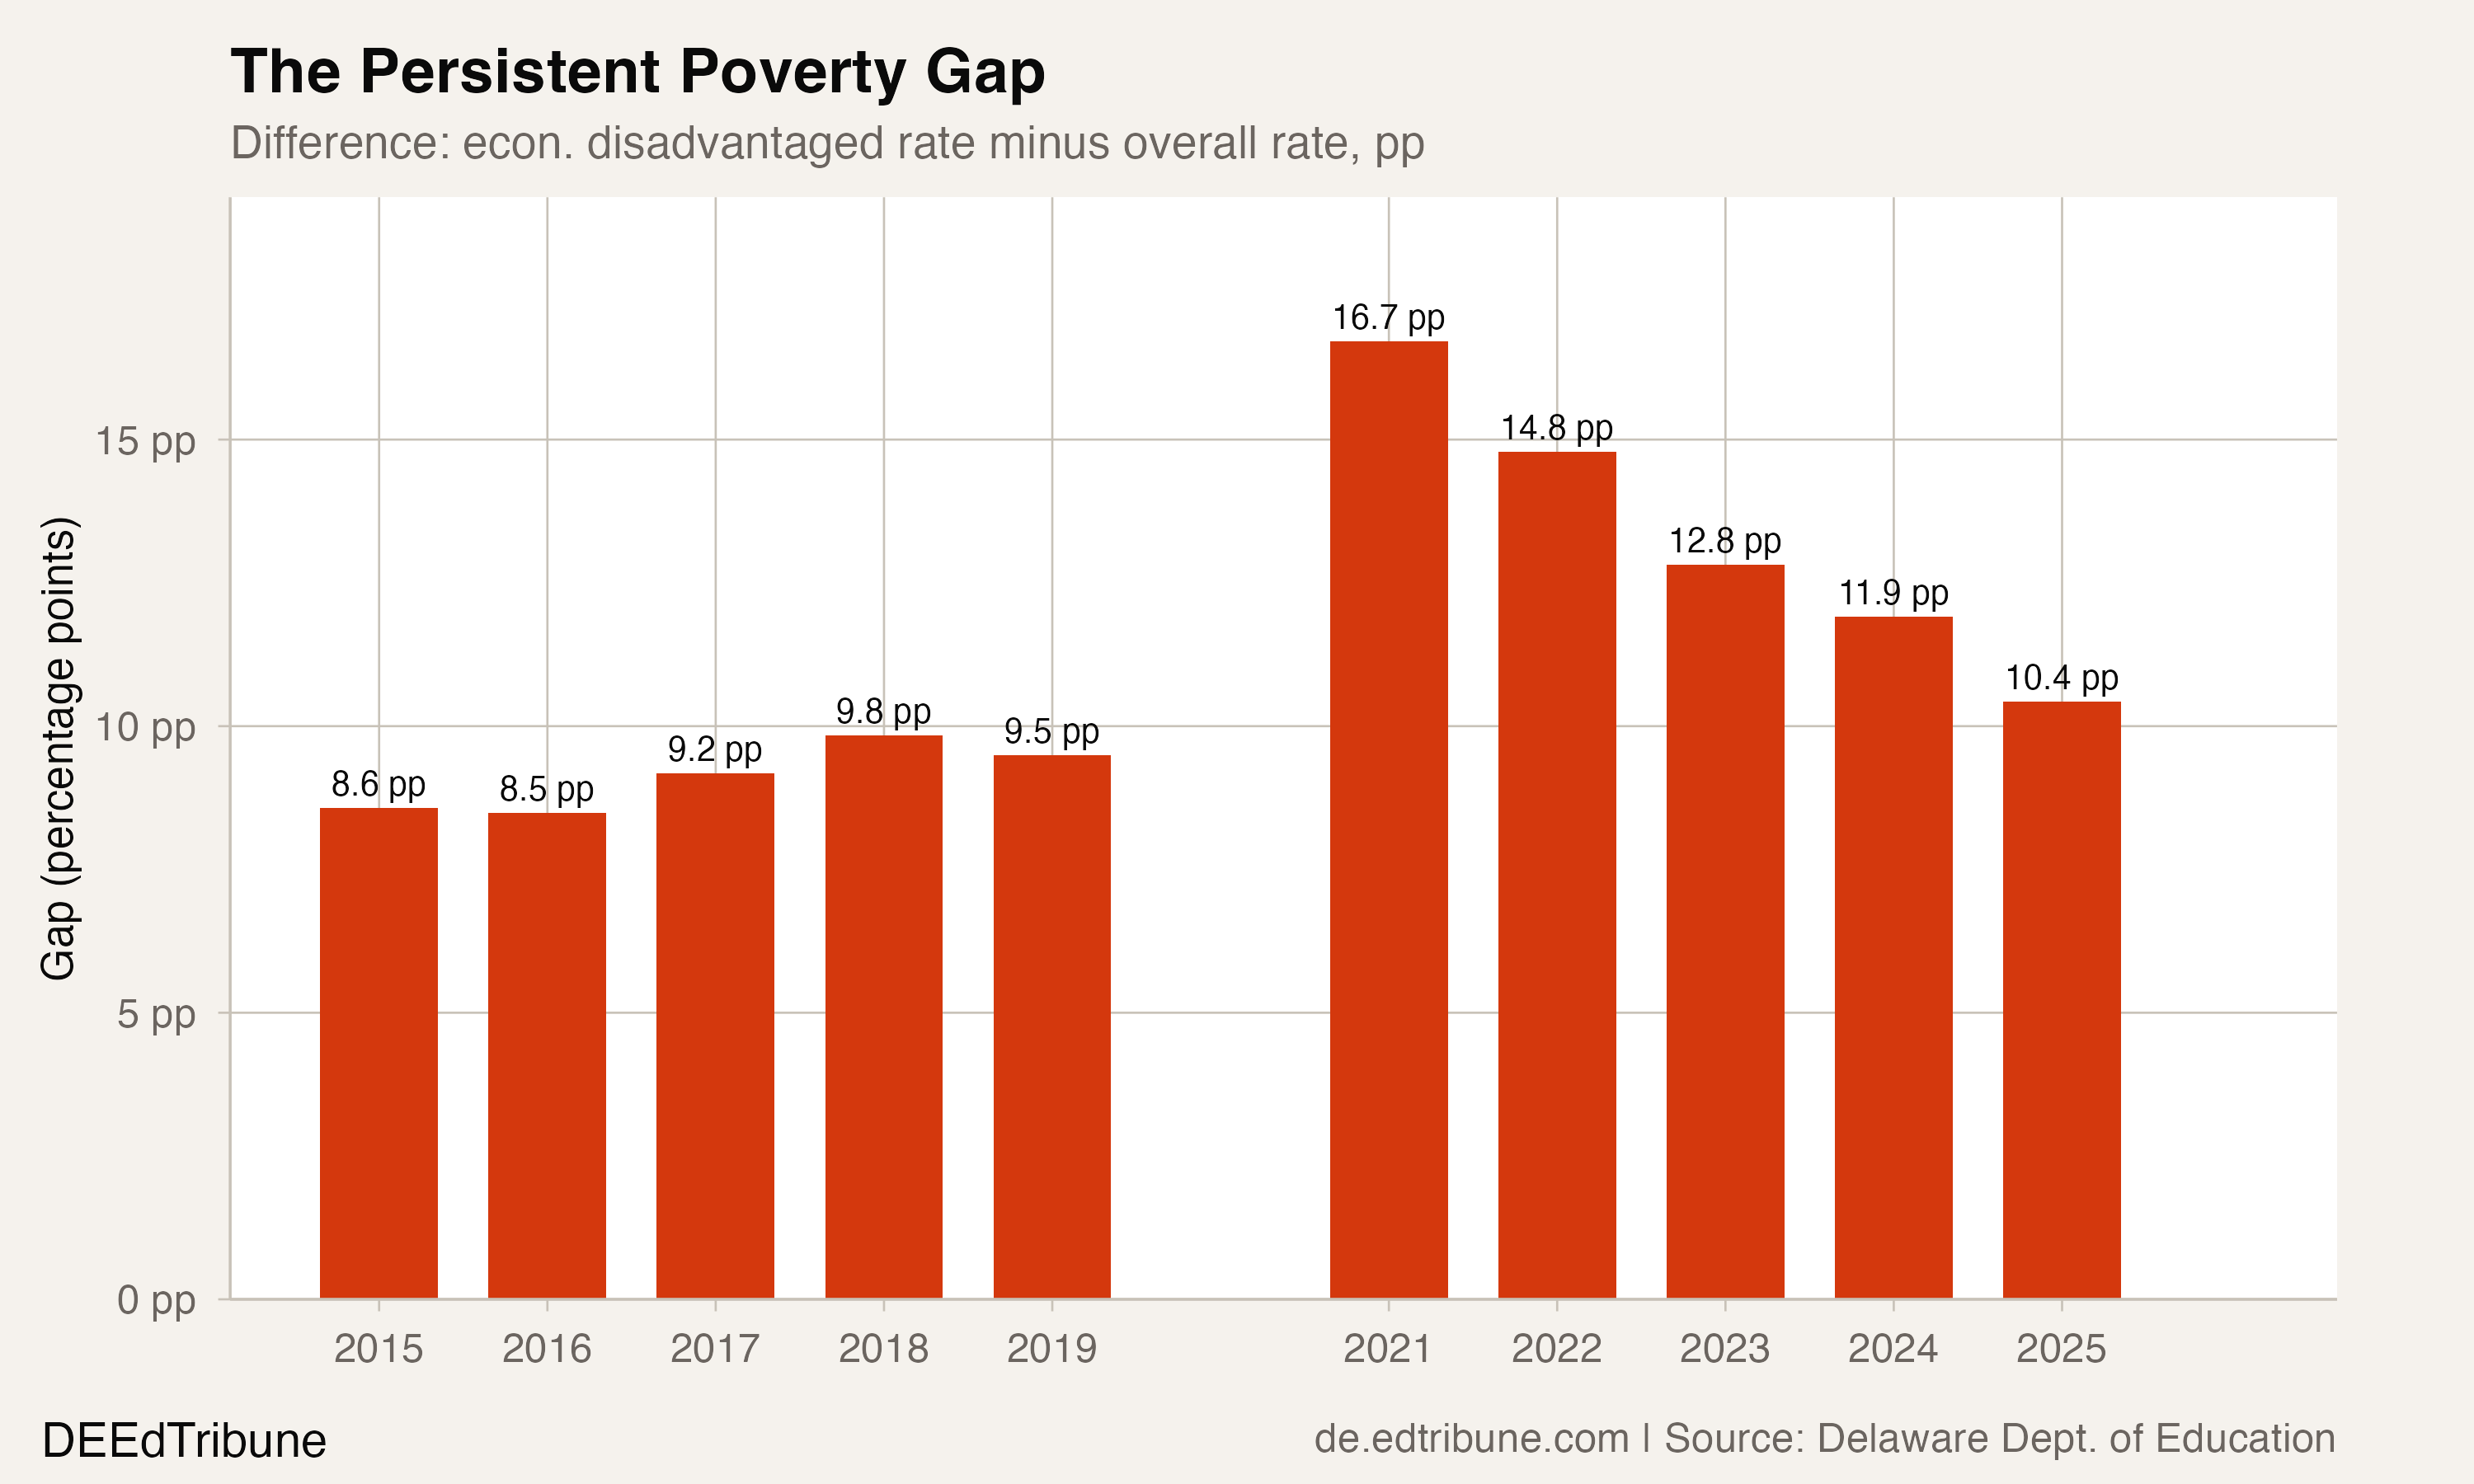
The income-based attendance gap existed well before the pandemic. In 2015, the first year of Delaware's chronic absenteeism data, 24.1% of students who are economically disadvantaged were chronically absent, compared with 15.5% overall, a gap of 8.6 percentage points. That gap hovered between 8.5 and 9.8 points through 2019.
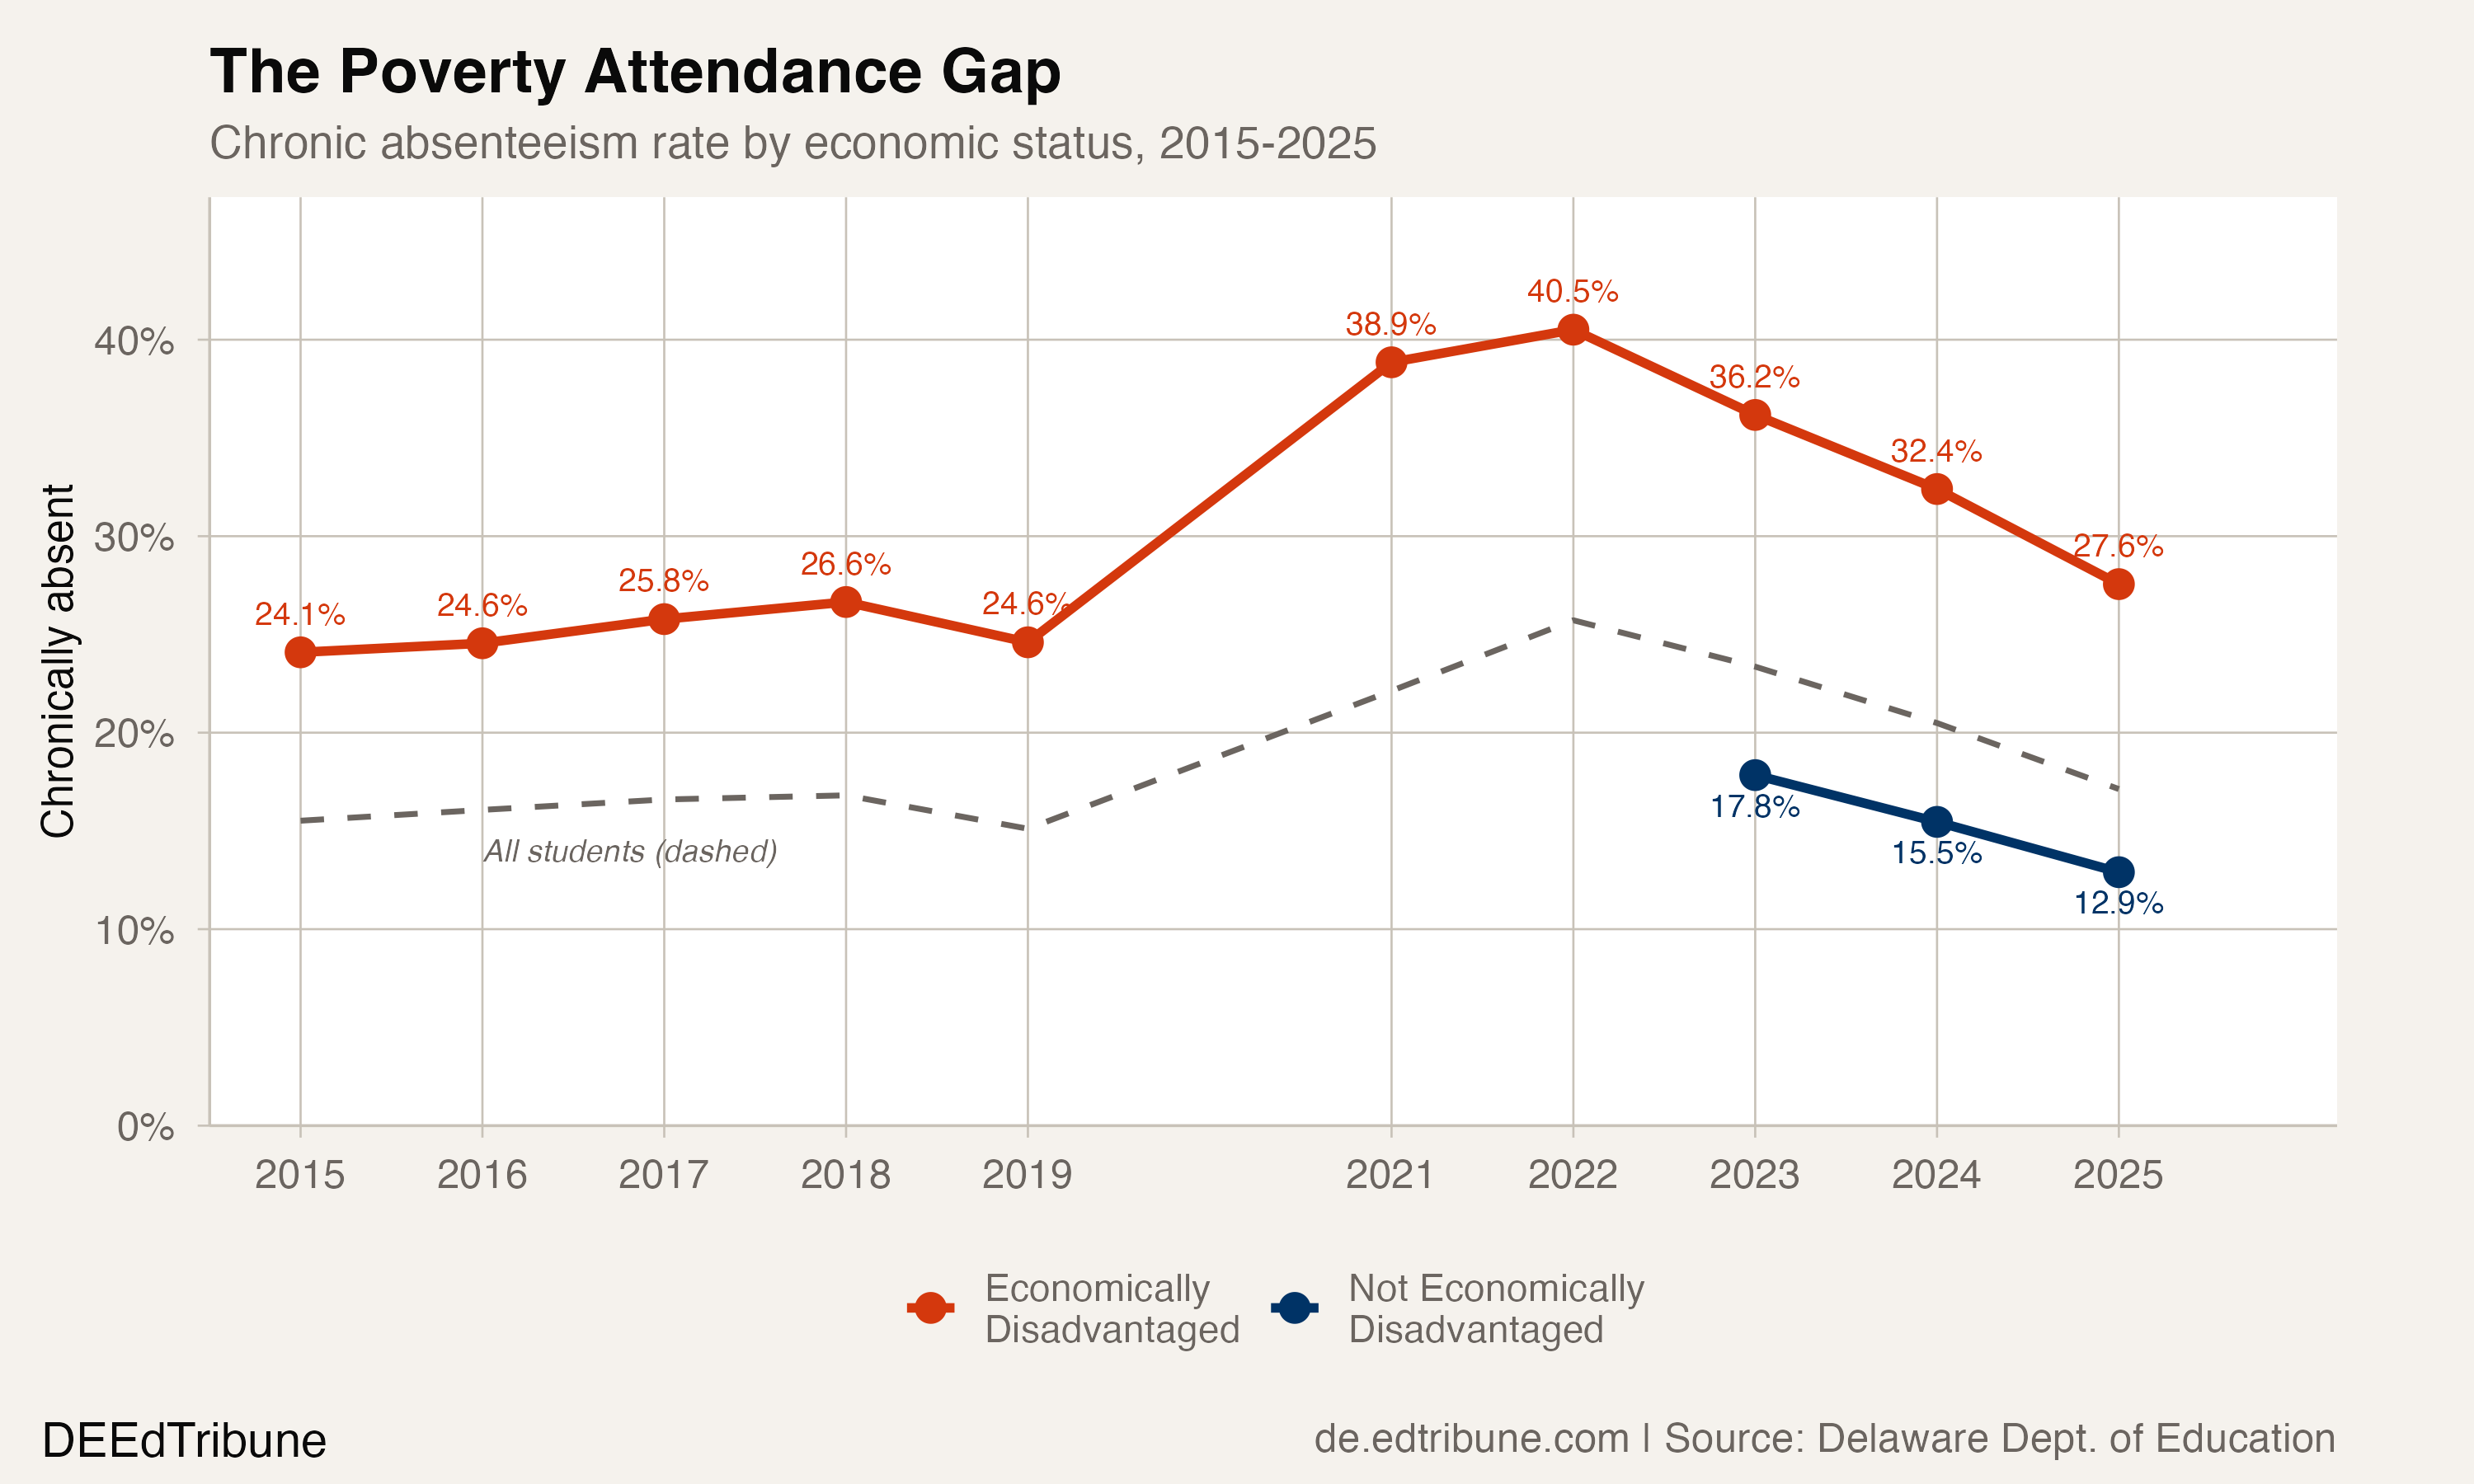
COVID blew it open. In 2021, the first post-shutdown year, 38.8% of students who are economically disadvantaged were chronically absent. By 2022, the rate hit 40.5%, meaning two in five of these students were missing at least 10% of the school year. The gap between students who are economically disadvantaged and the overall rate peaked at 16.7 points in 2021.
Three years of recovery have brought the economically disadvantaged rate down 12.9 percentage points from that peak, a larger absolute drop than any other subgroup. That is real progress, and faster in absolute terms than any other student group in Delaware. But the gap itself, while narrowing, remains 10.4 percentage points as of 2025, still wider than its pre-COVID range of 8.5 to 9.8 points.
That persistence matters more than the peak. Crises eventually recede. Structural gaps do not, unless something structural changes.
9th grade: where the income gap is widest
The grade-level data reveals where the income gap is most concentrated. At every grade from kindergarten through 12th, students who are economically disadvantaged are chronically absent at higher rates than their peers. But the gap is not uniform.
In elementary school, the gap runs 8 to 10 percentage points: 26.8% versus 17.0% in kindergarten, 22.1% versus 13.4% in second grade. Serious, but the rates for students who are economically disadvantaged remain below 30%.
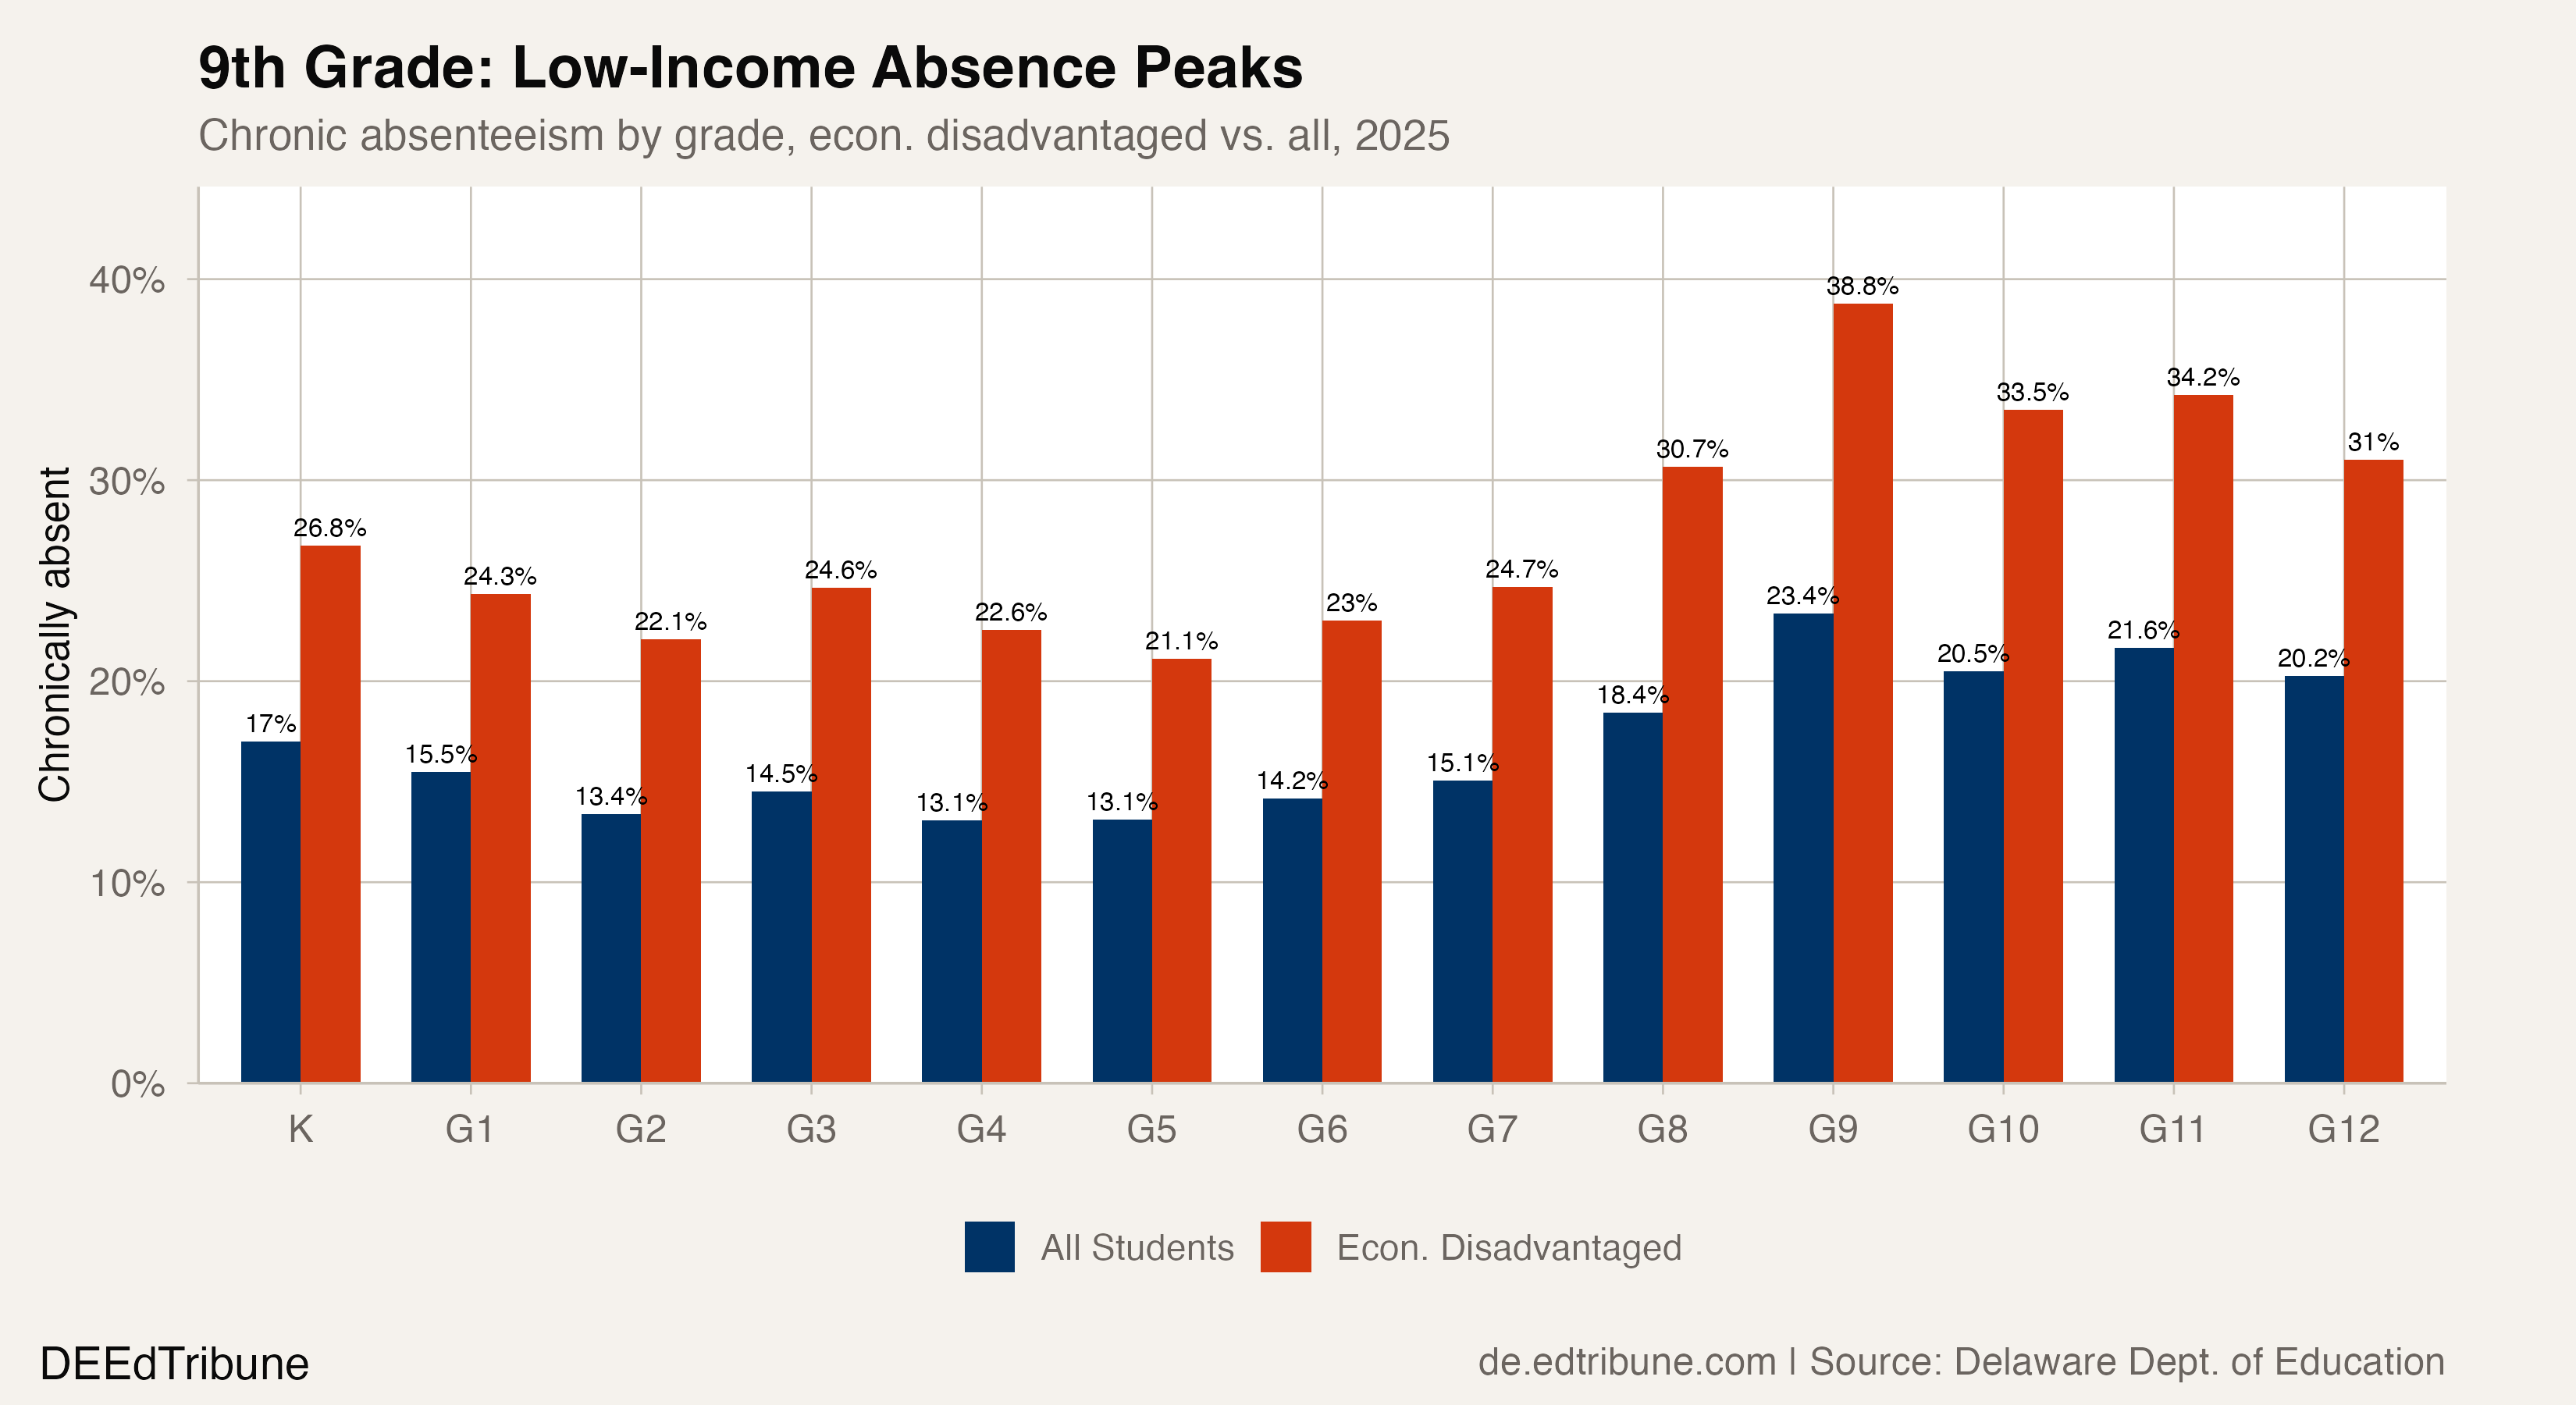
Then comes 9th grade. Among 9th graders who are economically disadvantaged, 38.8% were chronically absent in 2024-25, nearly four in ten. The gap with all students widens to 15.4 percentage points at 9th grade, the largest of any grade level. For context, 9th grade chronic absence is one of the strongest predictors of dropping out, according to Attendance Works. In Delaware, 4,095 students who are economically disadvantaged sat in 9th grade classrooms in 2024-25. More than 1,500 of them were chronically absent.
The pattern is not a 9th-grade-only phenomenon. Rates remain elevated through high school: 33.5% in 10th, 34.2% in 11th, 31.0% in 12th. But 9th grade is the inflection point, the grade where the rate jumps from 30.7% in 8th grade to 38.8%, an 8.1-point spike in a single transition.
The districts where the gap is widest
At the district level, the income gap varies from negligible to staggering. The widest direct gaps between students who are and are not economically disadvantaged in 2025 appear in districts that are, on the surface, quite different from each other.
Cape Henlopen↗ET School District, a beach community in Sussex County where only 20.1% of students qualify as economically disadvantaged, has a gap of 19.3 percentage points: 31.0% for students who are economically disadvantaged versus 11.7% for their peers. Red Clay↗ET Consolidated School District in Wilmington shows a 17.2-point gap: 28.8% versus 11.6%. Brandywine↗ET School District is similar at 17.0 points: 27.9% versus 10.9%.
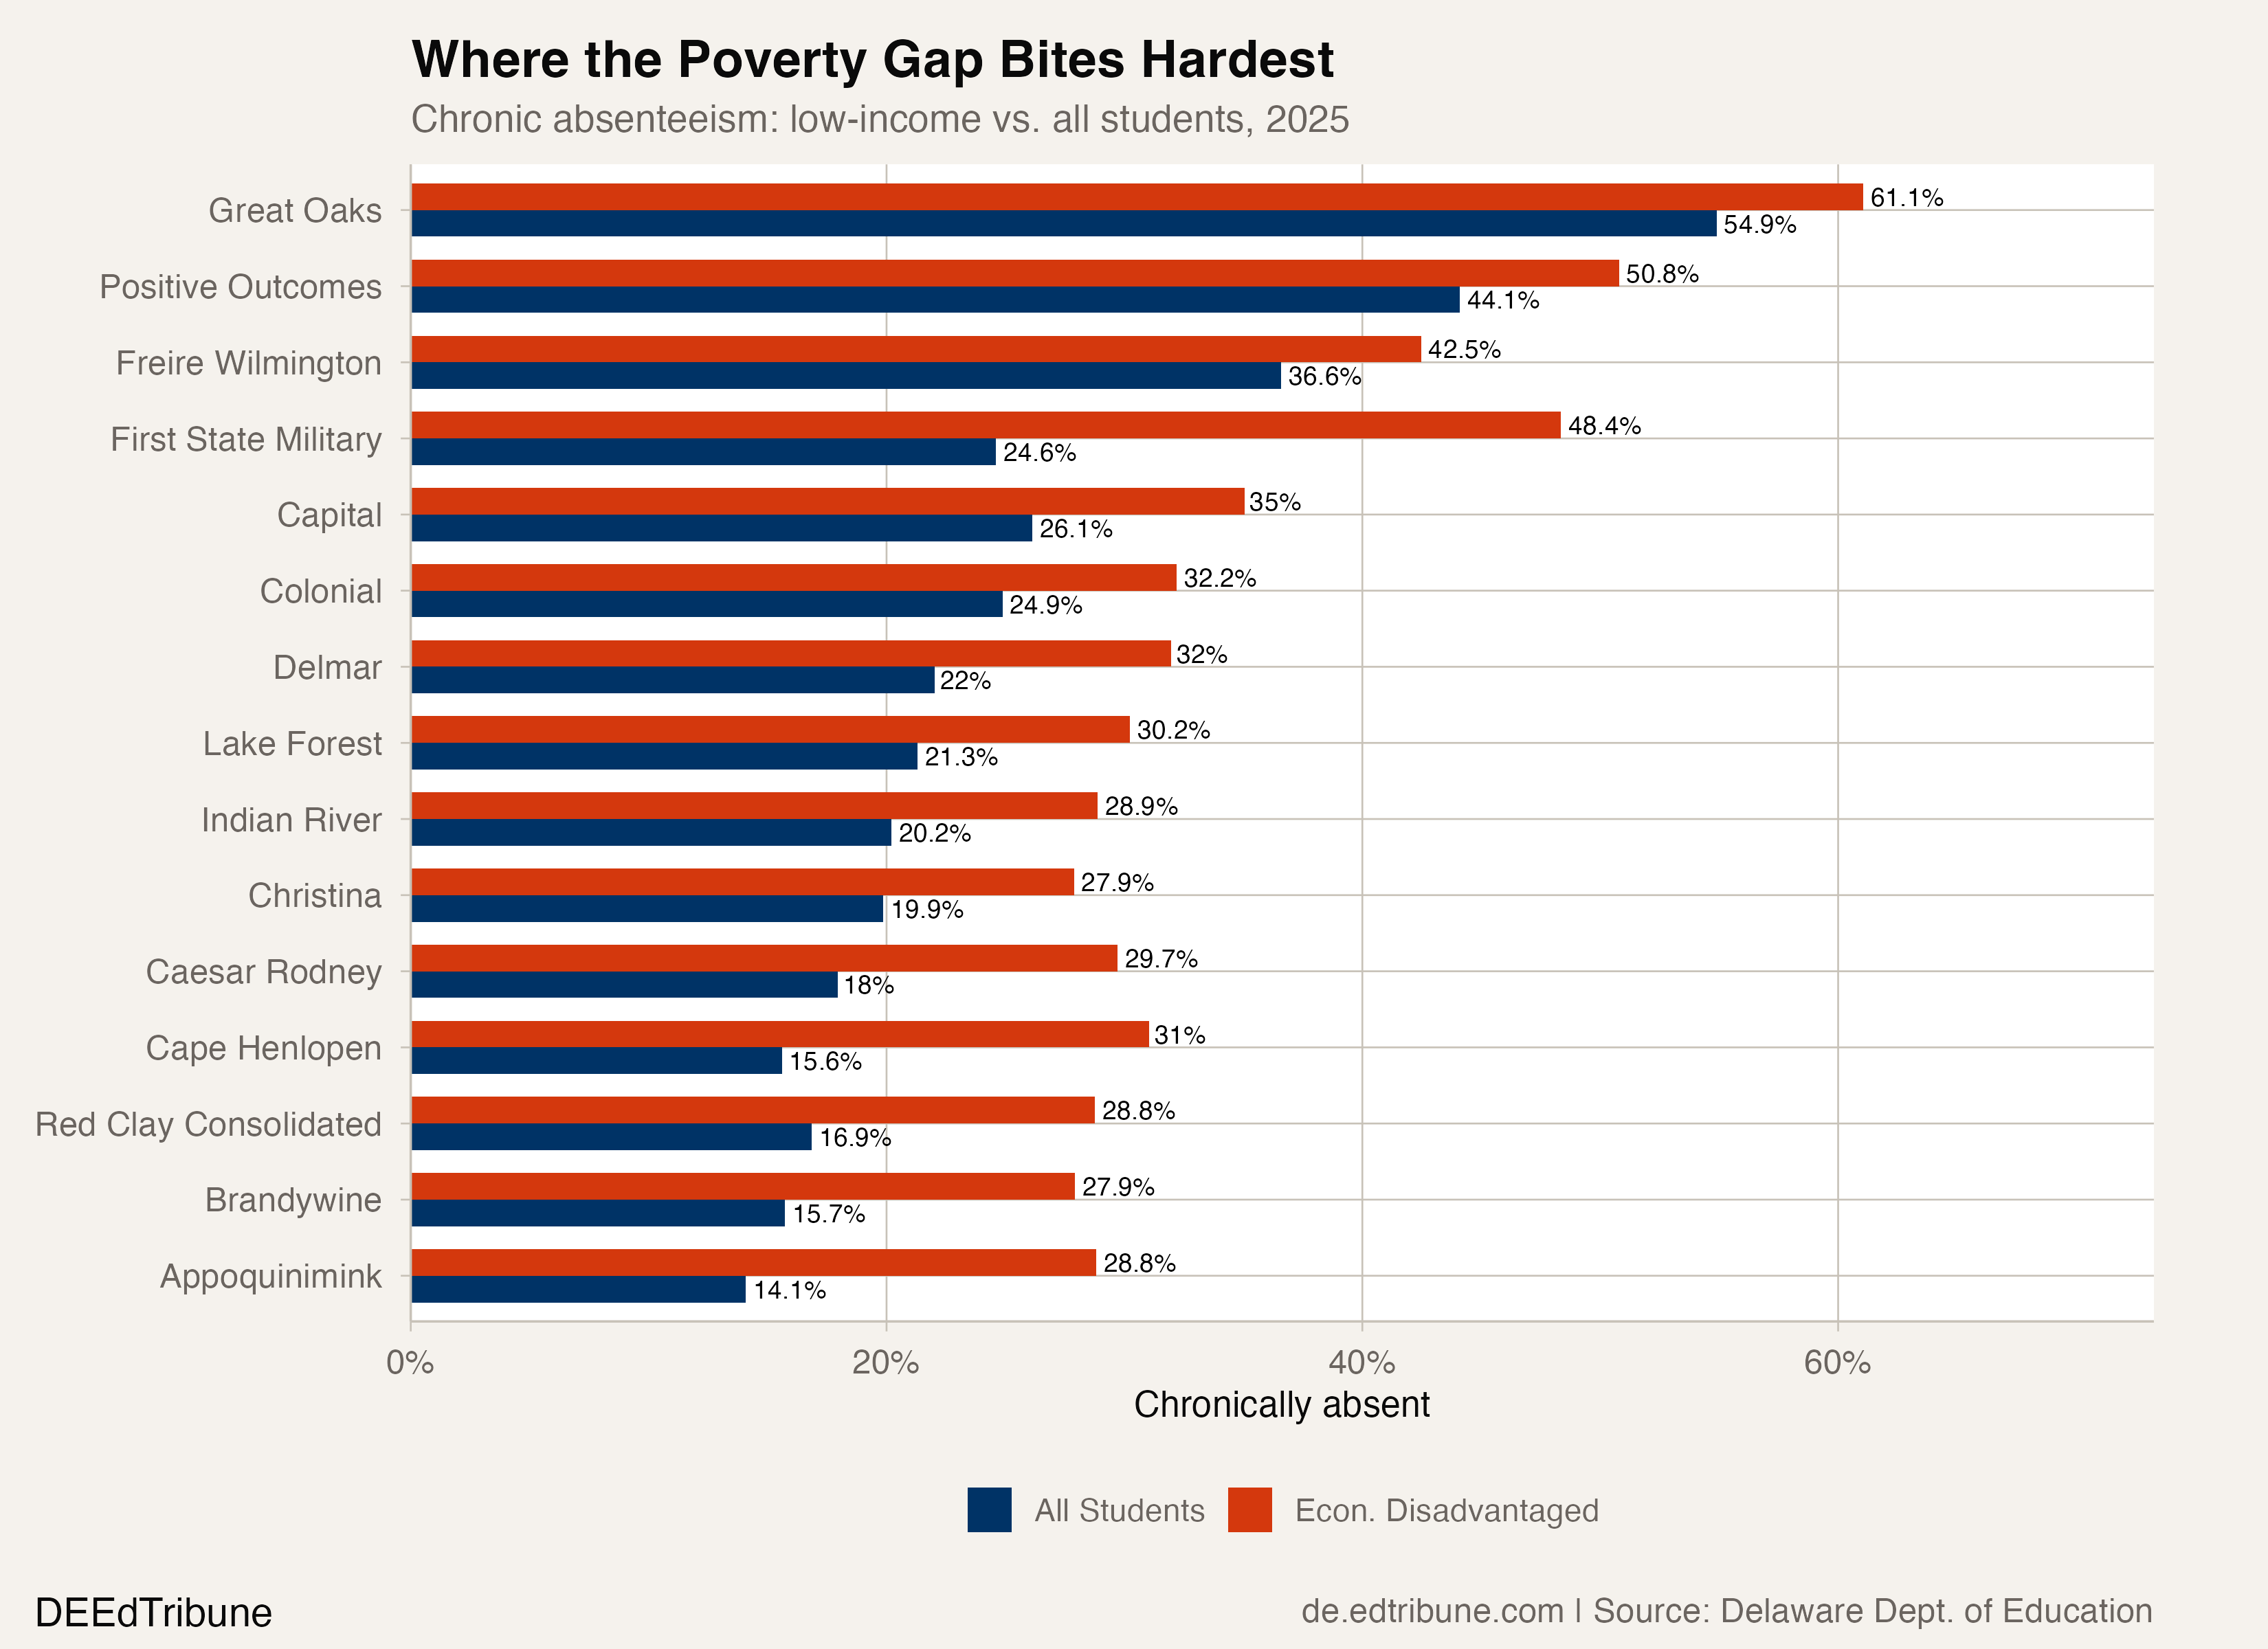
Colonial↗ET School District, where the D.A.S.H. collaborative links student attendance data with Nemours Children's Health primary care records, has a gap of 11.5 points. That is actually among the narrower gaps for a high-poverty traditional district, though it sits on a high base: 32.2% for students who are economically disadvantaged, 20.7% for those who are not. Colonial's overall rate of 24.9% remains the highest among large traditional districts. Jon Cooper, Colonial's director of the initiative, has described the goal plainly: "Keep kids in school...it's a conversation that hopefully leads to a solution."
The broadest gaps tend to appear in districts where a relatively affluent majority coexists with a smaller population of students who are economically disadvantaged. In those settings, the overall chronic absenteeism rate looks manageable, because the majority pulls it down. The economically disadvantaged rate tells a different story.
What the data cannot separate
The mechanisms that connect poverty to absence are well documented in general terms: health problems, especially asthma, dental emergencies, and untreated mental health conditions; transportation barriers; housing instability; caregiving responsibilities that fall on older siblings in single-parent households. The Rodel Foundation, which tracks Delaware education data, has flagged chronic absenteeism as one of the state's most persistent equity challenges, noting that students from low-income families are four times more likely to be chronically absent nationally.
What the data cannot do is disaggregate these causes at scale. Delaware's attendance records show who is absent. They do not show why.
One partial window comes from the DASH collaborative at Colonial, which routes attendance alerts to pediatricians when a student misses three consecutive days or 10 days total in a year. Dr. Kara Odom Walker, Nemours' chief population health officer, has called the approach an effort to "redefine children's health beyond medicine." The premise is that a doctor who knows a child is missing school can ask questions a teacher cannot: about a home environment, a chronic condition, a parent working two jobs.
The broader poverty context in Delaware adds urgency. According to United Way of Delaware, 38% of the state's population, over 153,000 people, either lives below the federal poverty line or falls below the ALICE (Asset Limited, Income Constrained, Employed) threshold, a survival budget. The number of struggling households grew by more than 1,250 between 2021 and 2022, even as wages for the lowest-paid jobs rose at the fastest rate in four decades. The cost of living outran the wage gains.
Child poverty data sharpens the geographic picture. Wilmington's child poverty rate stands at 41%. Dover, home of Capital School District, sits at 27%. Seaford and Laurel-Delmar, in Sussex County, range from 27% to 33%. These are the same communities where district-level chronic absenteeism rates for students who are economically disadvantaged consistently exceed 30%.
The gap that persists inside recovery
Delaware's overall attendance recovery is real and meaningful. The state has cut its chronic absenteeism rate from 25.7% in 2022 to 17.1% in 2025, an 8.6-point improvement that ranks among the best in the country. The economically disadvantaged rate has fallen by 12.9 points from its peak, even faster in absolute terms.
But the gap between students who are and are not economically disadvantaged has not returned to its pre-COVID baseline. Before the pandemic, the difference between students who are economically disadvantaged and the overall rate ran 8.5 to 9.8 points. In 2025, it is 10.4 points. Measured against the non-economically-disadvantaged rate, available only from 2023 onward, the gap is even wider: 14.7 points. And the ratio has actually been climbing: 2.03x in 2023, 2.10x in 2024, 2.14x in 2025.
The pattern suggests that recovery has been faster for students who were not chronically absent before the pandemic and who returned to pre-pandemic patterns more easily. The students who struggle most, those navigating poverty's compound barriers, are recovering more slowly in relative terms, even as their absolute numbers improve.
The 11,719 students who are economically disadvantaged and were chronically absent in 2024-25 represent 46.4% of all chronically absent students in Delaware, despite this group making up only 28.9% of total enrollment. That disproportionality is the clearest distillation of the gap: students who are economically disadvantaged account for less than three in ten Delaware students, but nearly half of those missing too much school.
The Delaware Department of Education's 2025-2028 strategic plan set a target of reducing chronic absenteeism from 15% to 13% by June 2028. For the state to hit that number, the economically disadvantaged rate would need to fall roughly another 10 points. Whether the interventions now running, D.A.S.H. health-data linkages at Colonial, the Wilmington Learning Collaborative's Digital Promise partnership, the statewide truancy needs assessment the state commissioned in 2024, can bend a structural gap that predates the pandemic is the open question.
Detailed code that reproduces the analysis and figures in this article is available exclusively to EdTribune subscribers.
Discussion
Sign in to join the discussion.
Loading comments...