In a district of 2,698 students tucked into the farmland between Bridgeville and Greenwood, something changed between 2024 and 2025. Woodbridge School District↗ET went from a chronic absenteeism rate of 18.4% to 5.2%, a 13.2 percentage-point drop that is the largest single-year improvement among Delaware's traditional districts in 2025. The average Woodbridge student missed just 4.2 days of school last year, less than half the state average of 9.6 days.
For a district that had never posted a chronic absenteeism rate below 18% in any year on record, this is not a marginal improvement. It is a structural break from a decade of data.
From mid-pack to second-best
Before 2025, Woodbridge's attendance record was unremarkable. The district's chronic absenteeism rate hovered around 20-22% from 2015 through 2017, dipped to 18.3% in 2019, then climbed to a peak of 24.2% in 2022 as the COVID attendance crisis swept Delaware. The state itself peaked at 25.7% that year. As recently as 2024, Woodbridge ranked 11th of 22 traditional districts on chronic absenteeism, right in the middle.
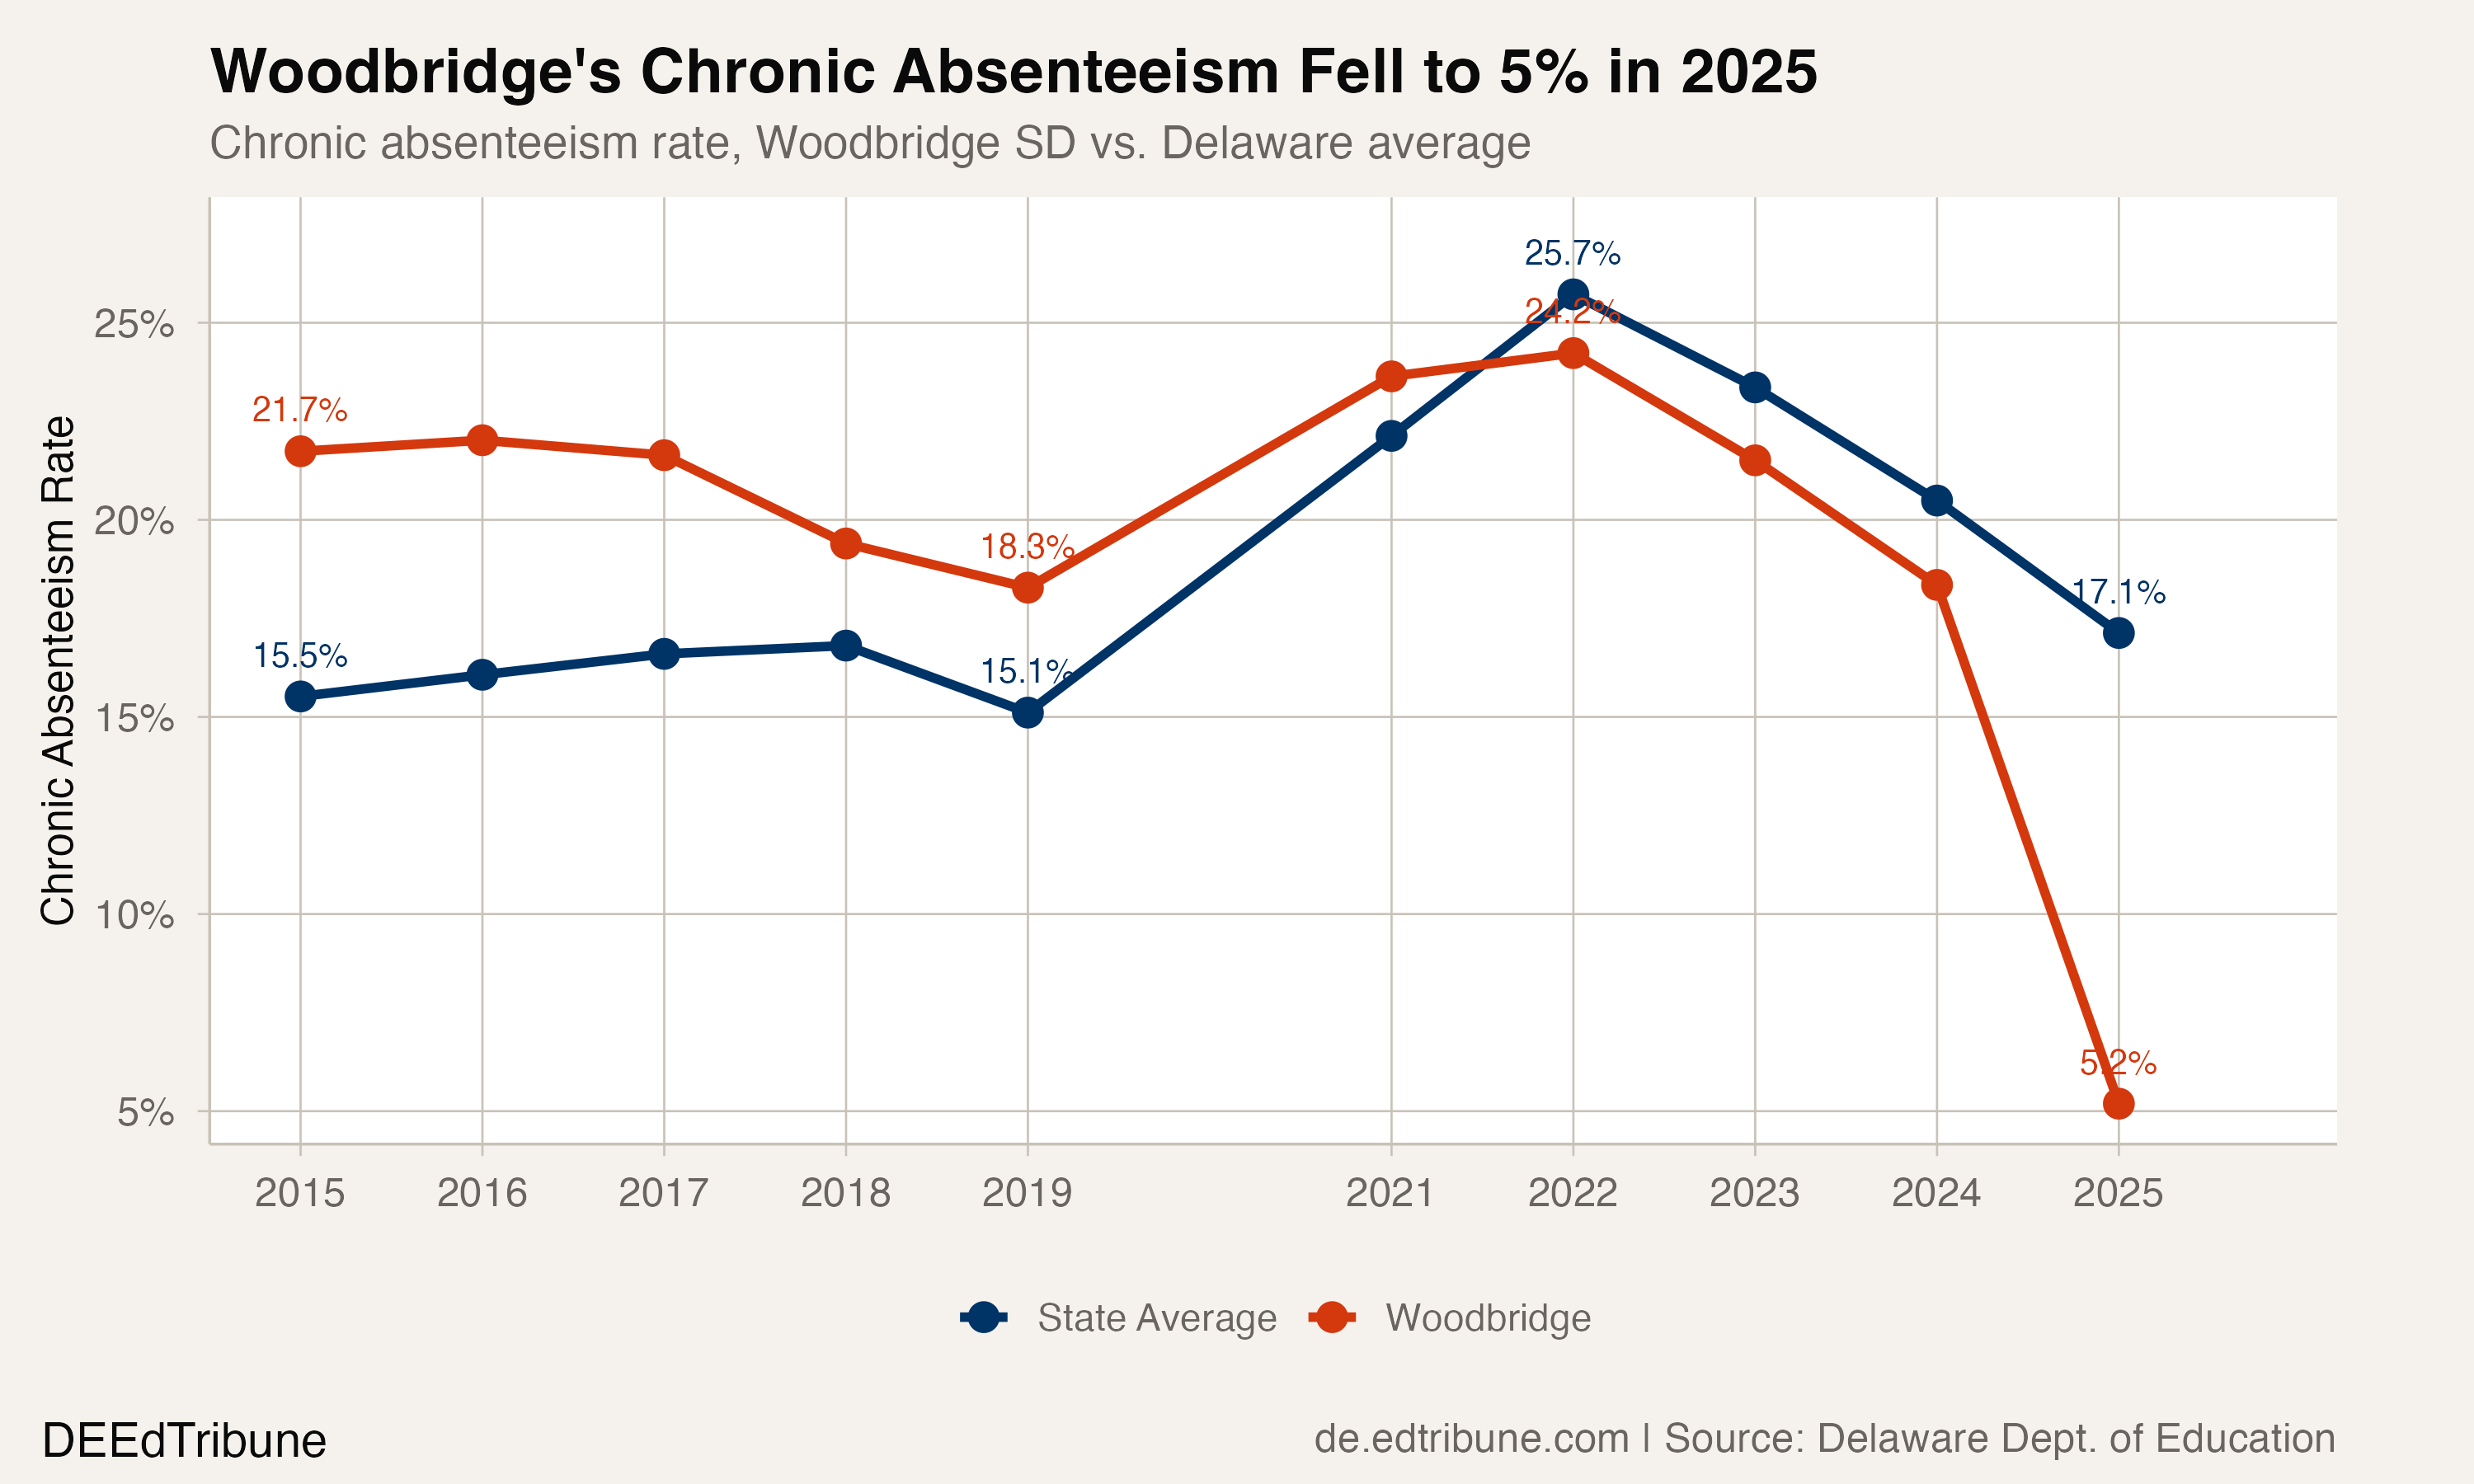
The recovery trajectory was steady through 2024: Woodbridge tracked the statewide improvement almost exactly, falling from 24.2% to 21.5% to 18.4% across the three post-peak years. Then 2025 happened. The state dropped 3.4 percentage points, from 20.5% to 17.1%. Woodbridge dropped 13.2.
Among all 22 traditional districts in Delaware, Woodbridge now ranks second-lowest, behind only Sussex Academy at 3.5%. Among all 41 districts including charters, it ranks sixth. It sits 11.9 percentage points below the state average.
What the school-level data shows
The improvement was not concentrated at a single building. Woodbridge Middle School dropped from 24.9% to 7.2%. Woodbridge High School fell from 18.7% to 9.9%. The Woodbridge Early Childhood Education Center went from 14.8% to 2.2%. Phillis Wheatley Elementary School, which had a 14.5% rate in 2024, has suppressed data for 2025, but the district-level totals confirm the improvement is districtwide.
Every student subgroup posted a decline. Economically disadvantaged students fell from 24.9% to 7.8%. Black students dropped from 20.4% to 6.2%. Hispanic students went from 16.5% to 3.7%. English learners, who make up roughly a fifth of the district, fell from 14.6% to 3.4%. Even students who are currently homeless, a population that typically faces attendance rates two to three times the overall average, dropped from 48.8% to 16.3%.
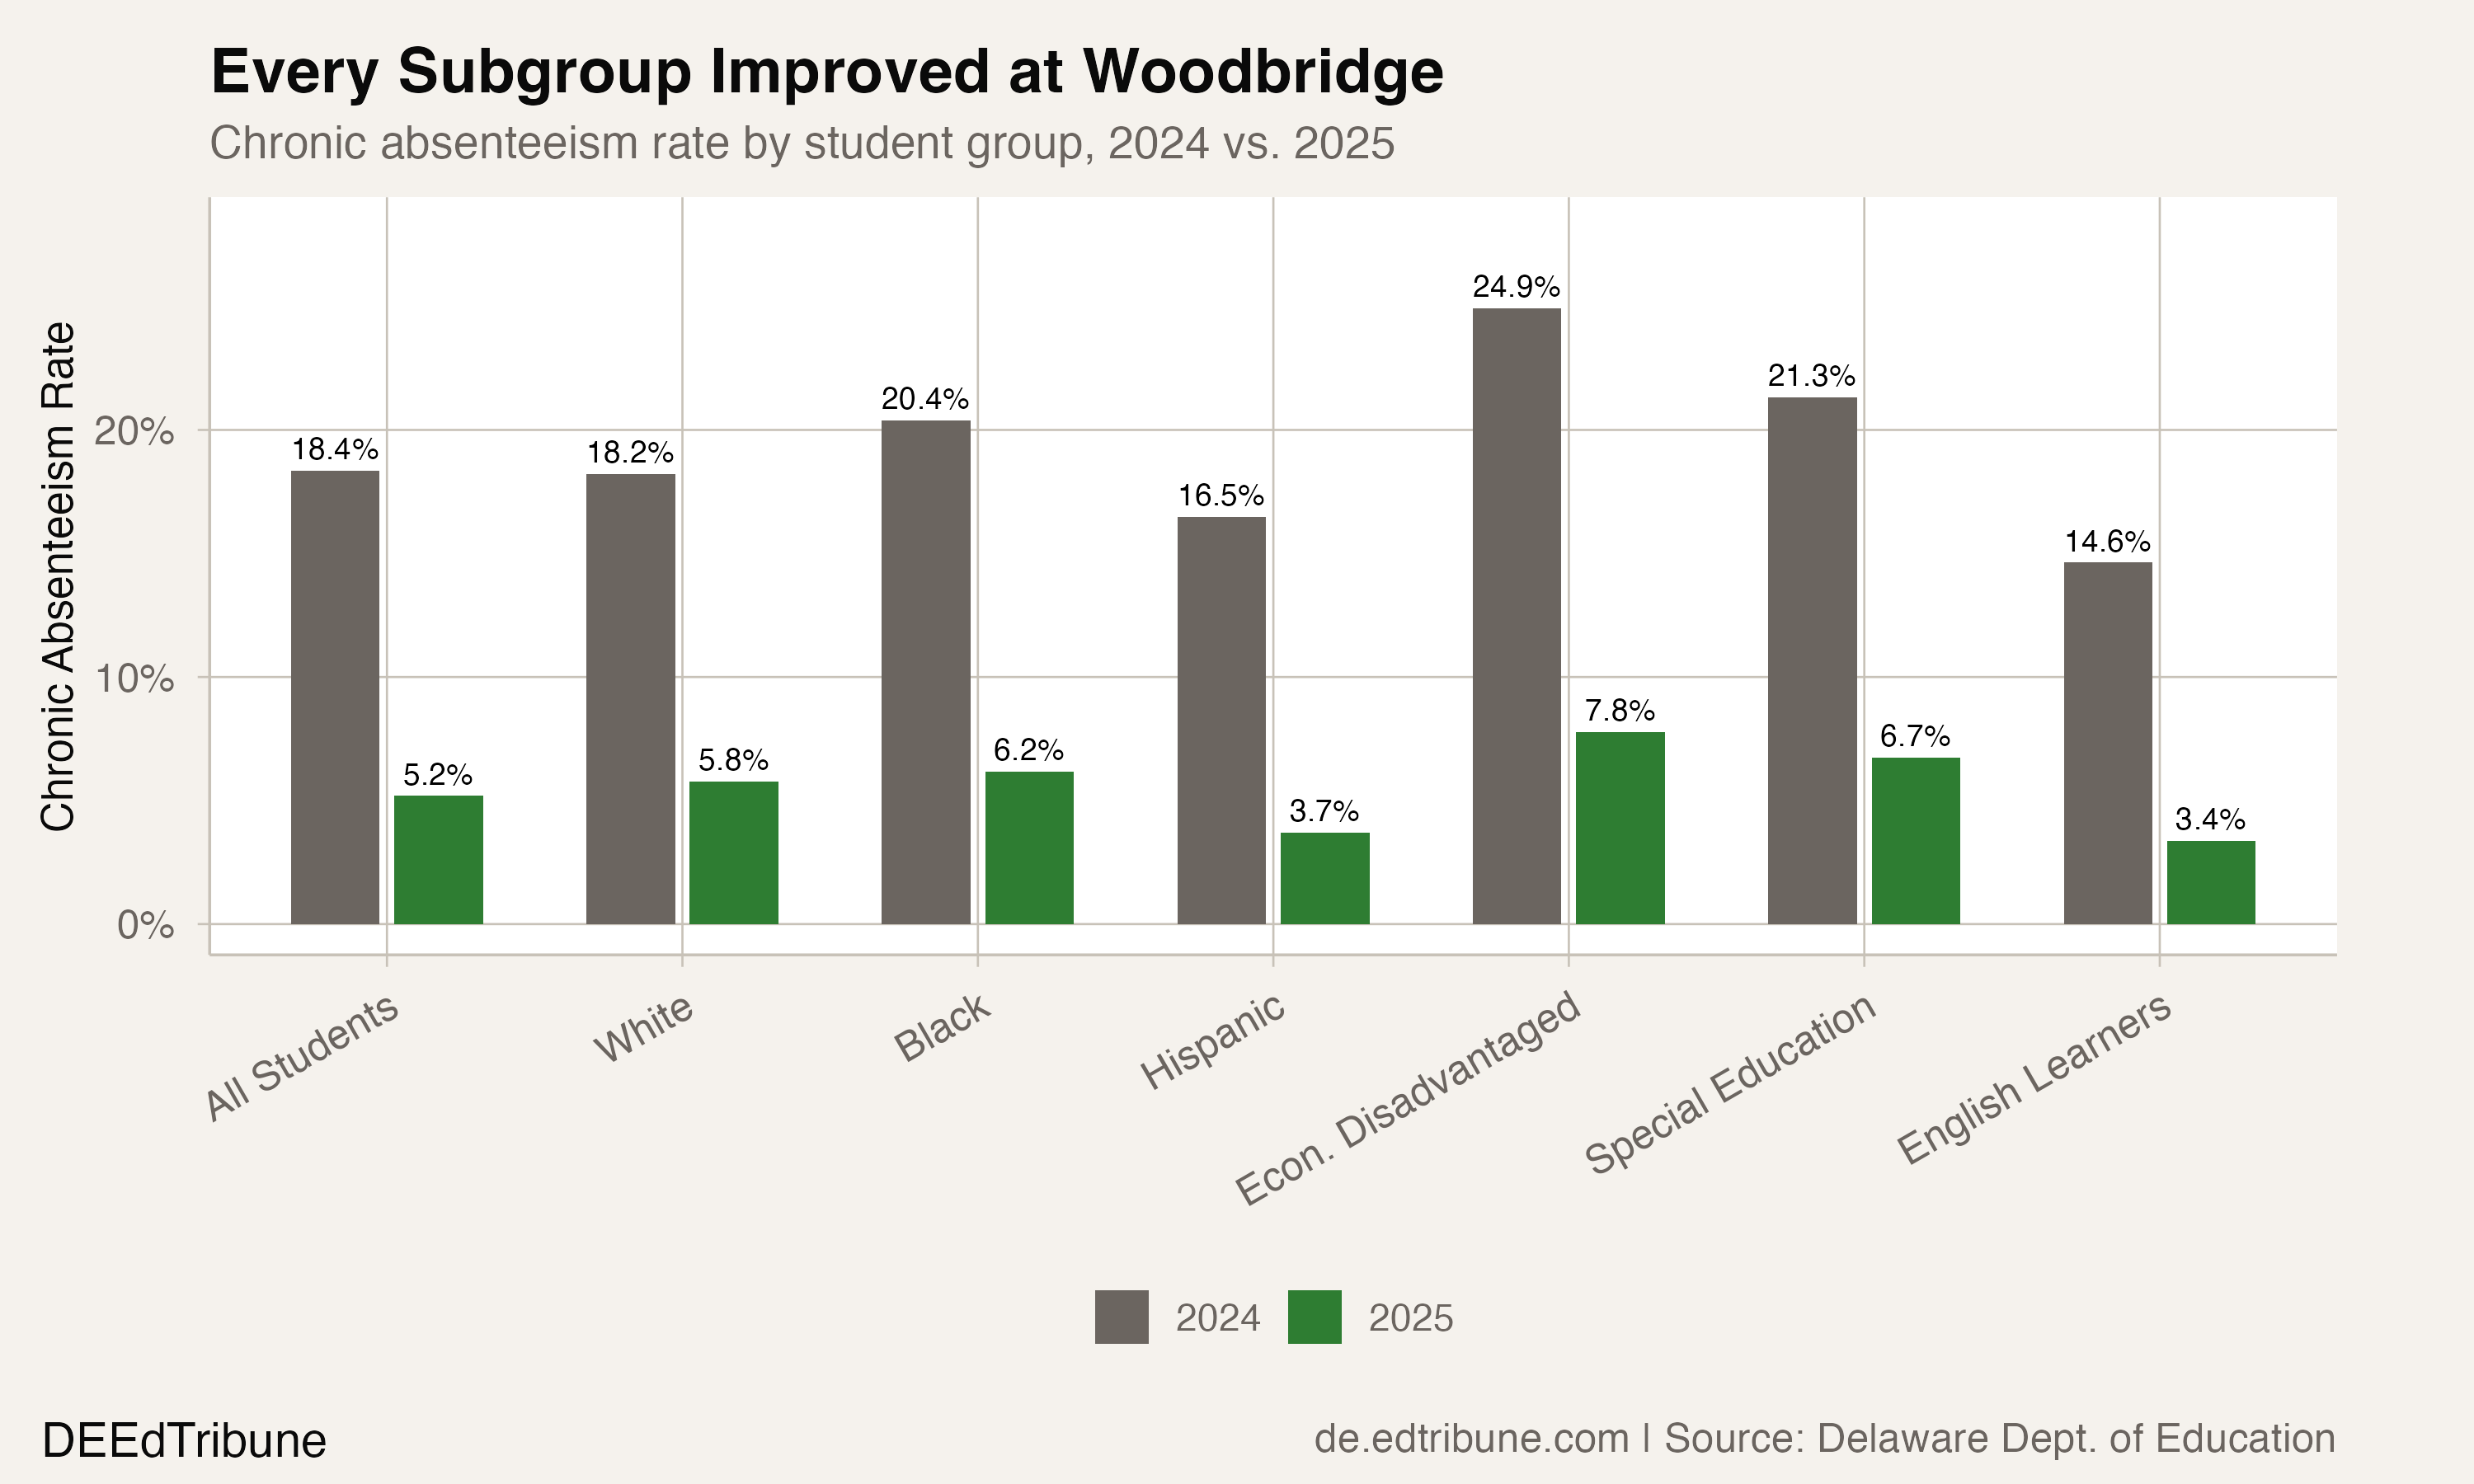
The breadth of the improvement is, in one sense, reassuring: it is hard to fabricate consistency across every school and every demographic group. In another sense, it is exactly what makes the number worth scrutinizing.
A question embedded in the data
Chronic absenteeism in Delaware is measured as the share of students who miss 10% or more of the days they are enrolled. Both sides of that fraction matter: the number of days absent and the number of days enrolled.
At Woodbridge, average days absent fell from 10.3 to 4.2 between 2024 and 2025. That is a genuine, substantial reduction. But the denominator also shifted: average days enrolled rose from 157 to 172, an increase of 15 days. The state average increased by less than three days over the same period, from 157 to 159.
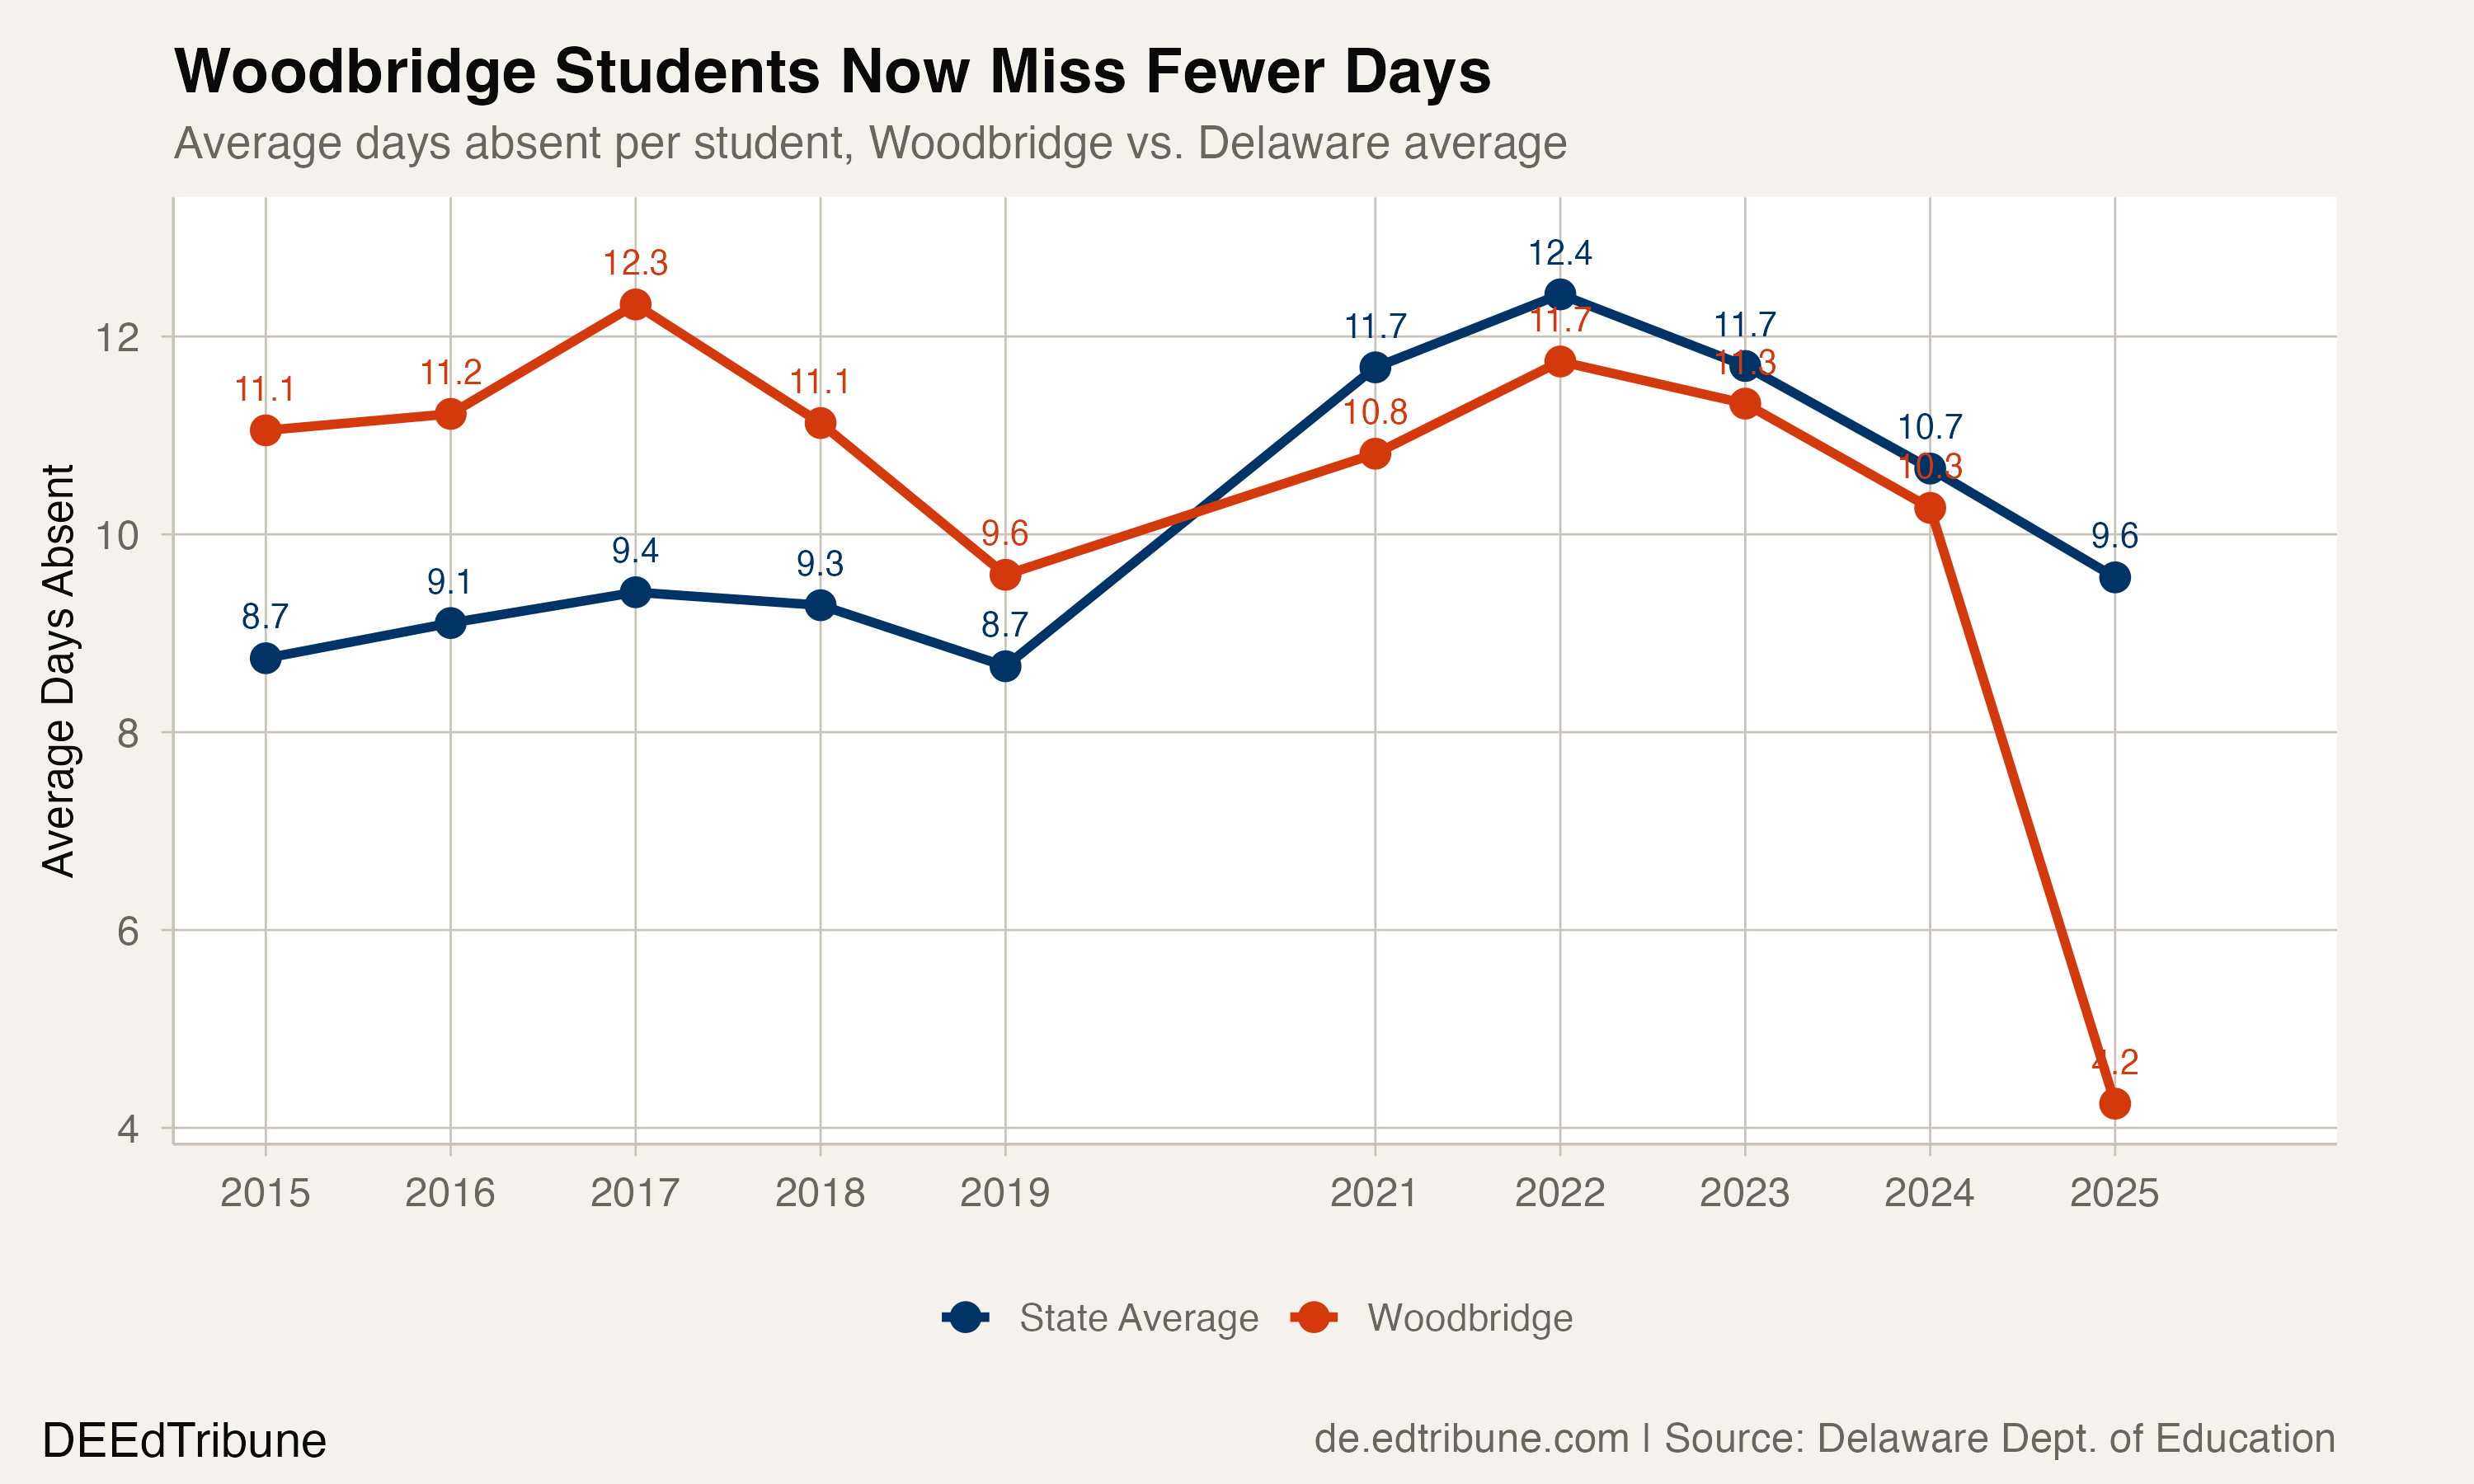
Woodbridge is not the only district with a large enrolled-days increase. Delmar jumped 23 days, POLYTECH gained 24, and several charter schools posted similarly large changes. But the combination of a 15-day enrolled increase and a six-day absence decrease at Woodbridge produces a double-compression effect on the chronic rate that accounts for much of the 13.2-point drop.
The enrolled-days increase could reflect a longer school calendar, a change in how enrollment windows are measured, or students staying enrolled for more of the year rather than withdrawing and re-enrolling. The data does not distinguish between these explanations. What it does establish is that fewer students missed excessive school, while the threshold for "excessive" also effectively shifted. Both factors are real, and separating their contributions precisely would require day-level attendance records that the state does not publish.
Leadership and intervention
Dr. Kevin Long became Woodbridge's superintendent in November 2023, succeeding Heath Chasanov after Chasanov's departure to lead Kent-Sussex Industries, a nonprofit serving individuals with disabilities. Long, a lifelong Delaware resident who previously served as assistant principal at Sussex Tech and administrator at Caesar Rodney, had been Woodbridge's assistant superintendent since August 2023.
The district has used family contact after three absences, attendance letters, counselor-led attendance groups, and attendance contracts as interventions, with administrators publicly acknowledging that high school absenteeism rates were unacceptable and needed to change. The district-level data confirms the high school had the most ground to cover: its 2024 chronic rate of 18.7% was the highest among Woodbridge's four schools.
Sussex County's parallel story
Woodbridge is not the only Sussex County district with a dramatic 2025 improvement. Seaford School District↗ET, 10 miles to the southeast, dropped from 21.2% to 8.7%, a 12.5 percentage-point decline. Seaford's intervention has been more publicly documented: the district adopted PowerSchool Attendance Intervention, and a Johns Hopkins evaluation found that elementary students in treatment schools attended approximately two more days of school compared to peers in comparison schools.
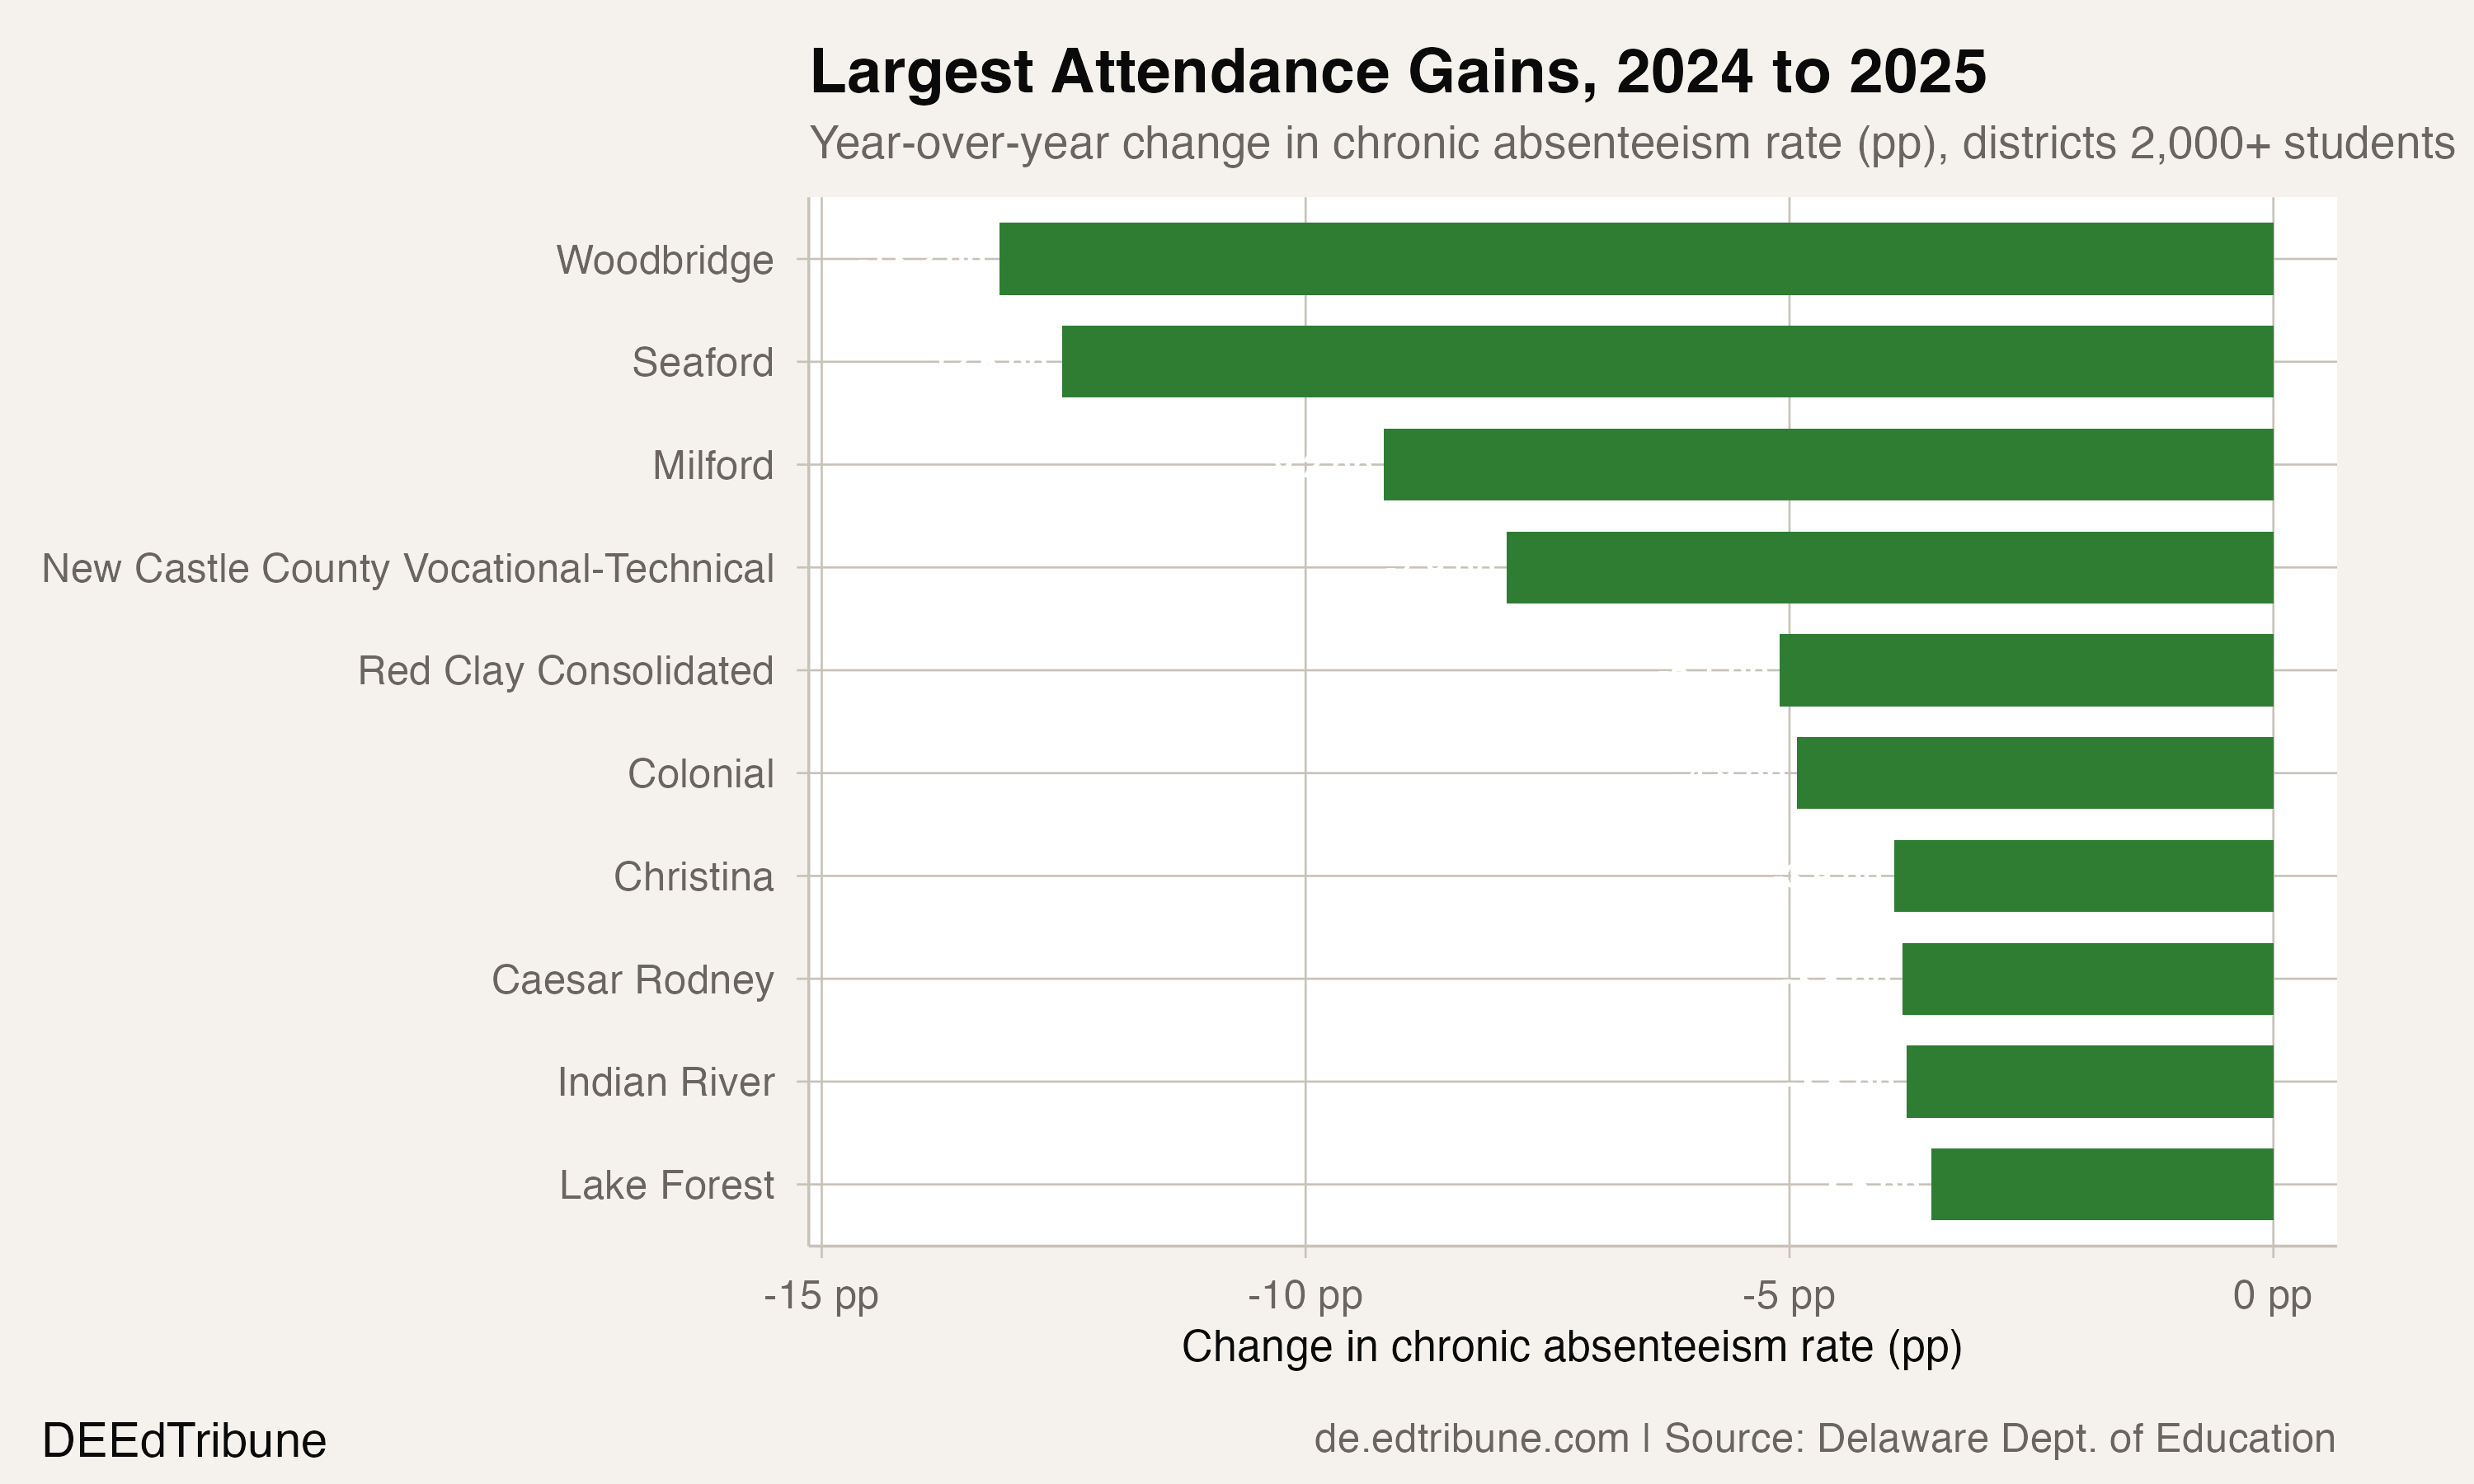
Together, Woodbridge and Seaford account for two of the three largest attendance improvements among Delaware's traditional districts in 2025. Whether their proximity reflects shared regional dynamics, similar intervention strategies, or coincidence is an open question. Sussex County's rural character, tight-knit school communities, and smaller district sizes may make attendance interventions easier to implement than in larger New Castle County districts, where Colonial and Capital still report rates above 24%.
What this means, and what it does not
If Woodbridge's 2025 numbers hold up to scrutiny, the district's story offers a genuine proof of concept: a small, rural, economically mixed district can cut chronic absenteeism to levels typically associated with selective charters and vocational-technical schools. Only five other districts in Delaware, all of them charter or specialty schools, posted a lower rate in 2025.
The caveat is the enrolled-days anomaly. A 15-day increase in average days enrolled, against a statewide background of two days, raises a methodological question that the data alone cannot fully resolve. This does not mean the improvement is illusory. Students genuinely missed fewer days of school. But it does mean the 13.2-point drop overstates the improvement relative to other districts that did not see a similar enrolled-days shift. A student who missed 16 days out of 172 enrolled days has an absence rate of 9.3%, just below the 10% chronic threshold. That same student missing 16 days out of 157 enrolled days has an absence rate of 10.2%, crossing the threshold. The mathematics of the denominator matter.
When Delaware publishes the 2025-26 attendance data, it will answer the obvious question: can Woodbridge sustain 5.2%? The state is still tracking toward the absenteeism benchmarks Secretary of Education Cindy Marten outlined in the 2025-2028 strategic plan. If Woodbridge's number is real and repeatable, the district is already well ahead of the state's trajectory. If it reverts toward historical norms, the 2025 data point will look less like a transformation and more like a one-year anomaly amplified by measurement changes.
Detailed code that reproduces the analysis and figures in this article is available exclusively to EdTribune subscribers.
Discussion
Sign in to join the discussion.
Loading comments...