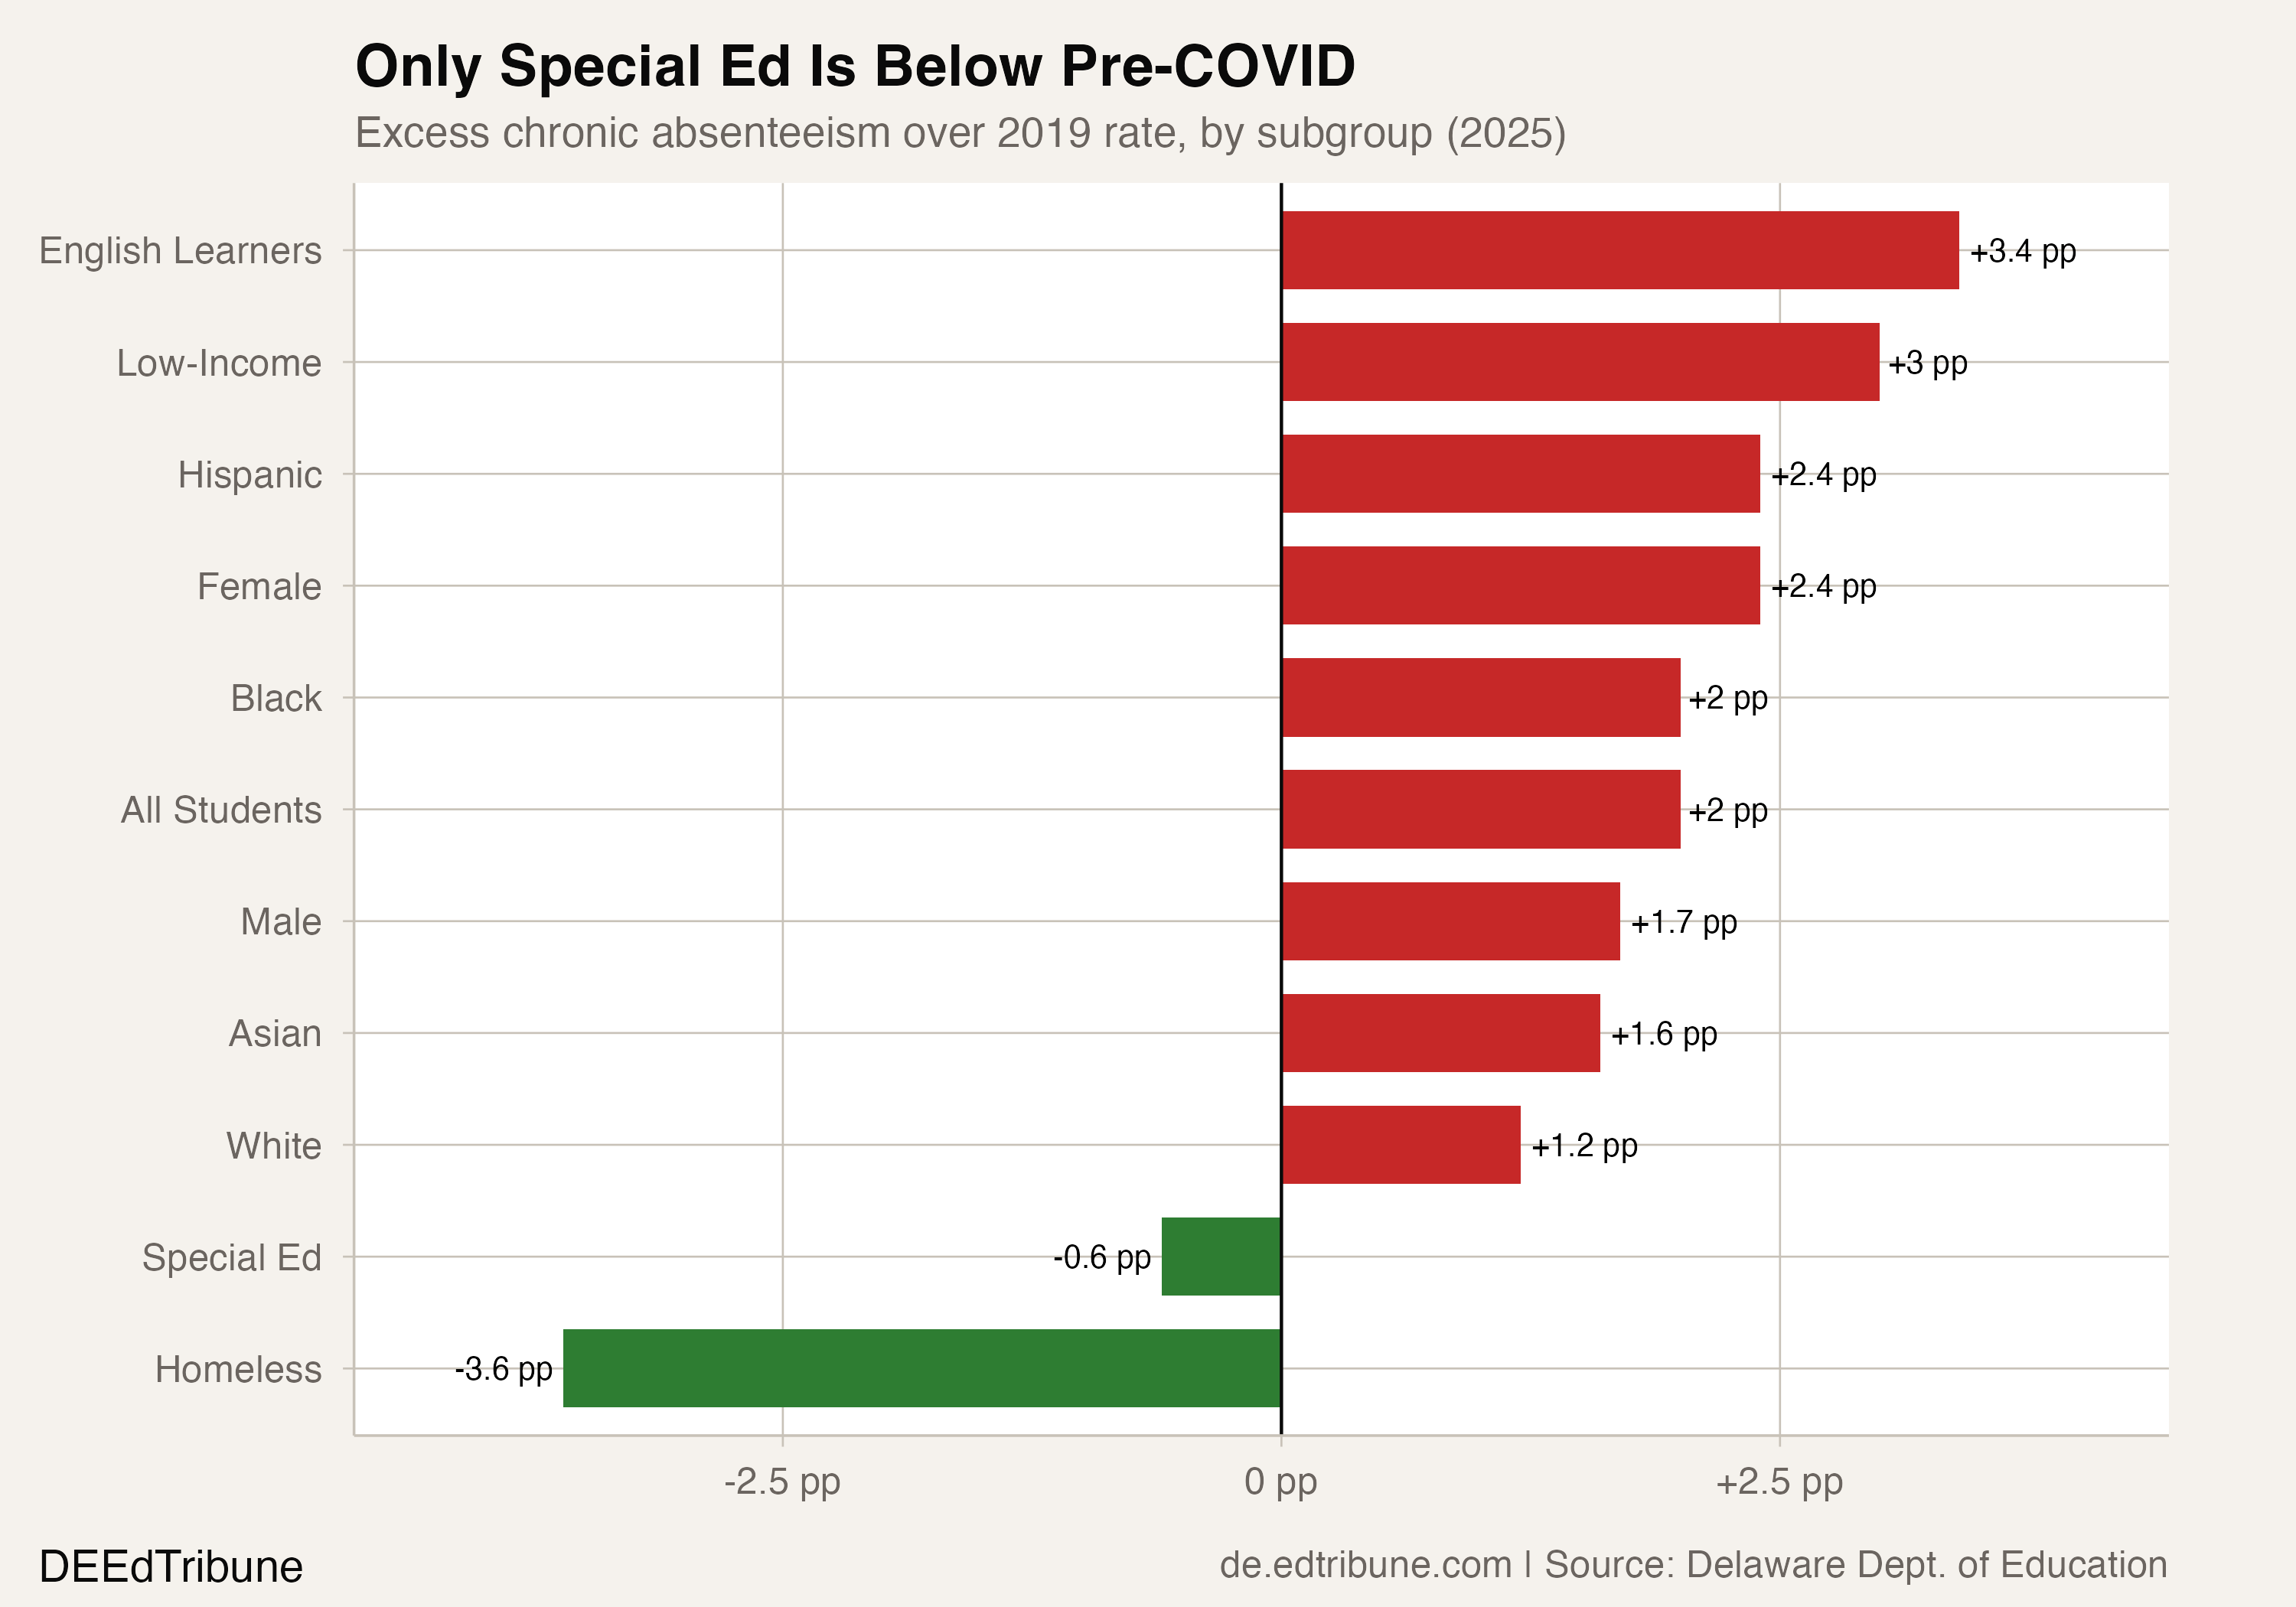
Every subgroup in Delaware's chronic absenteeism data tells some version of the same story: rates spiked during the pandemic, then came partway back. Black students recovered 84.8% of the way to their pre-COVID baseline. White students recovered 86.2%. English learners, 69%. The statewide average, 81%.
One group did something different. Students with disabilities did not recover partway. They recovered all the way, and then kept going.
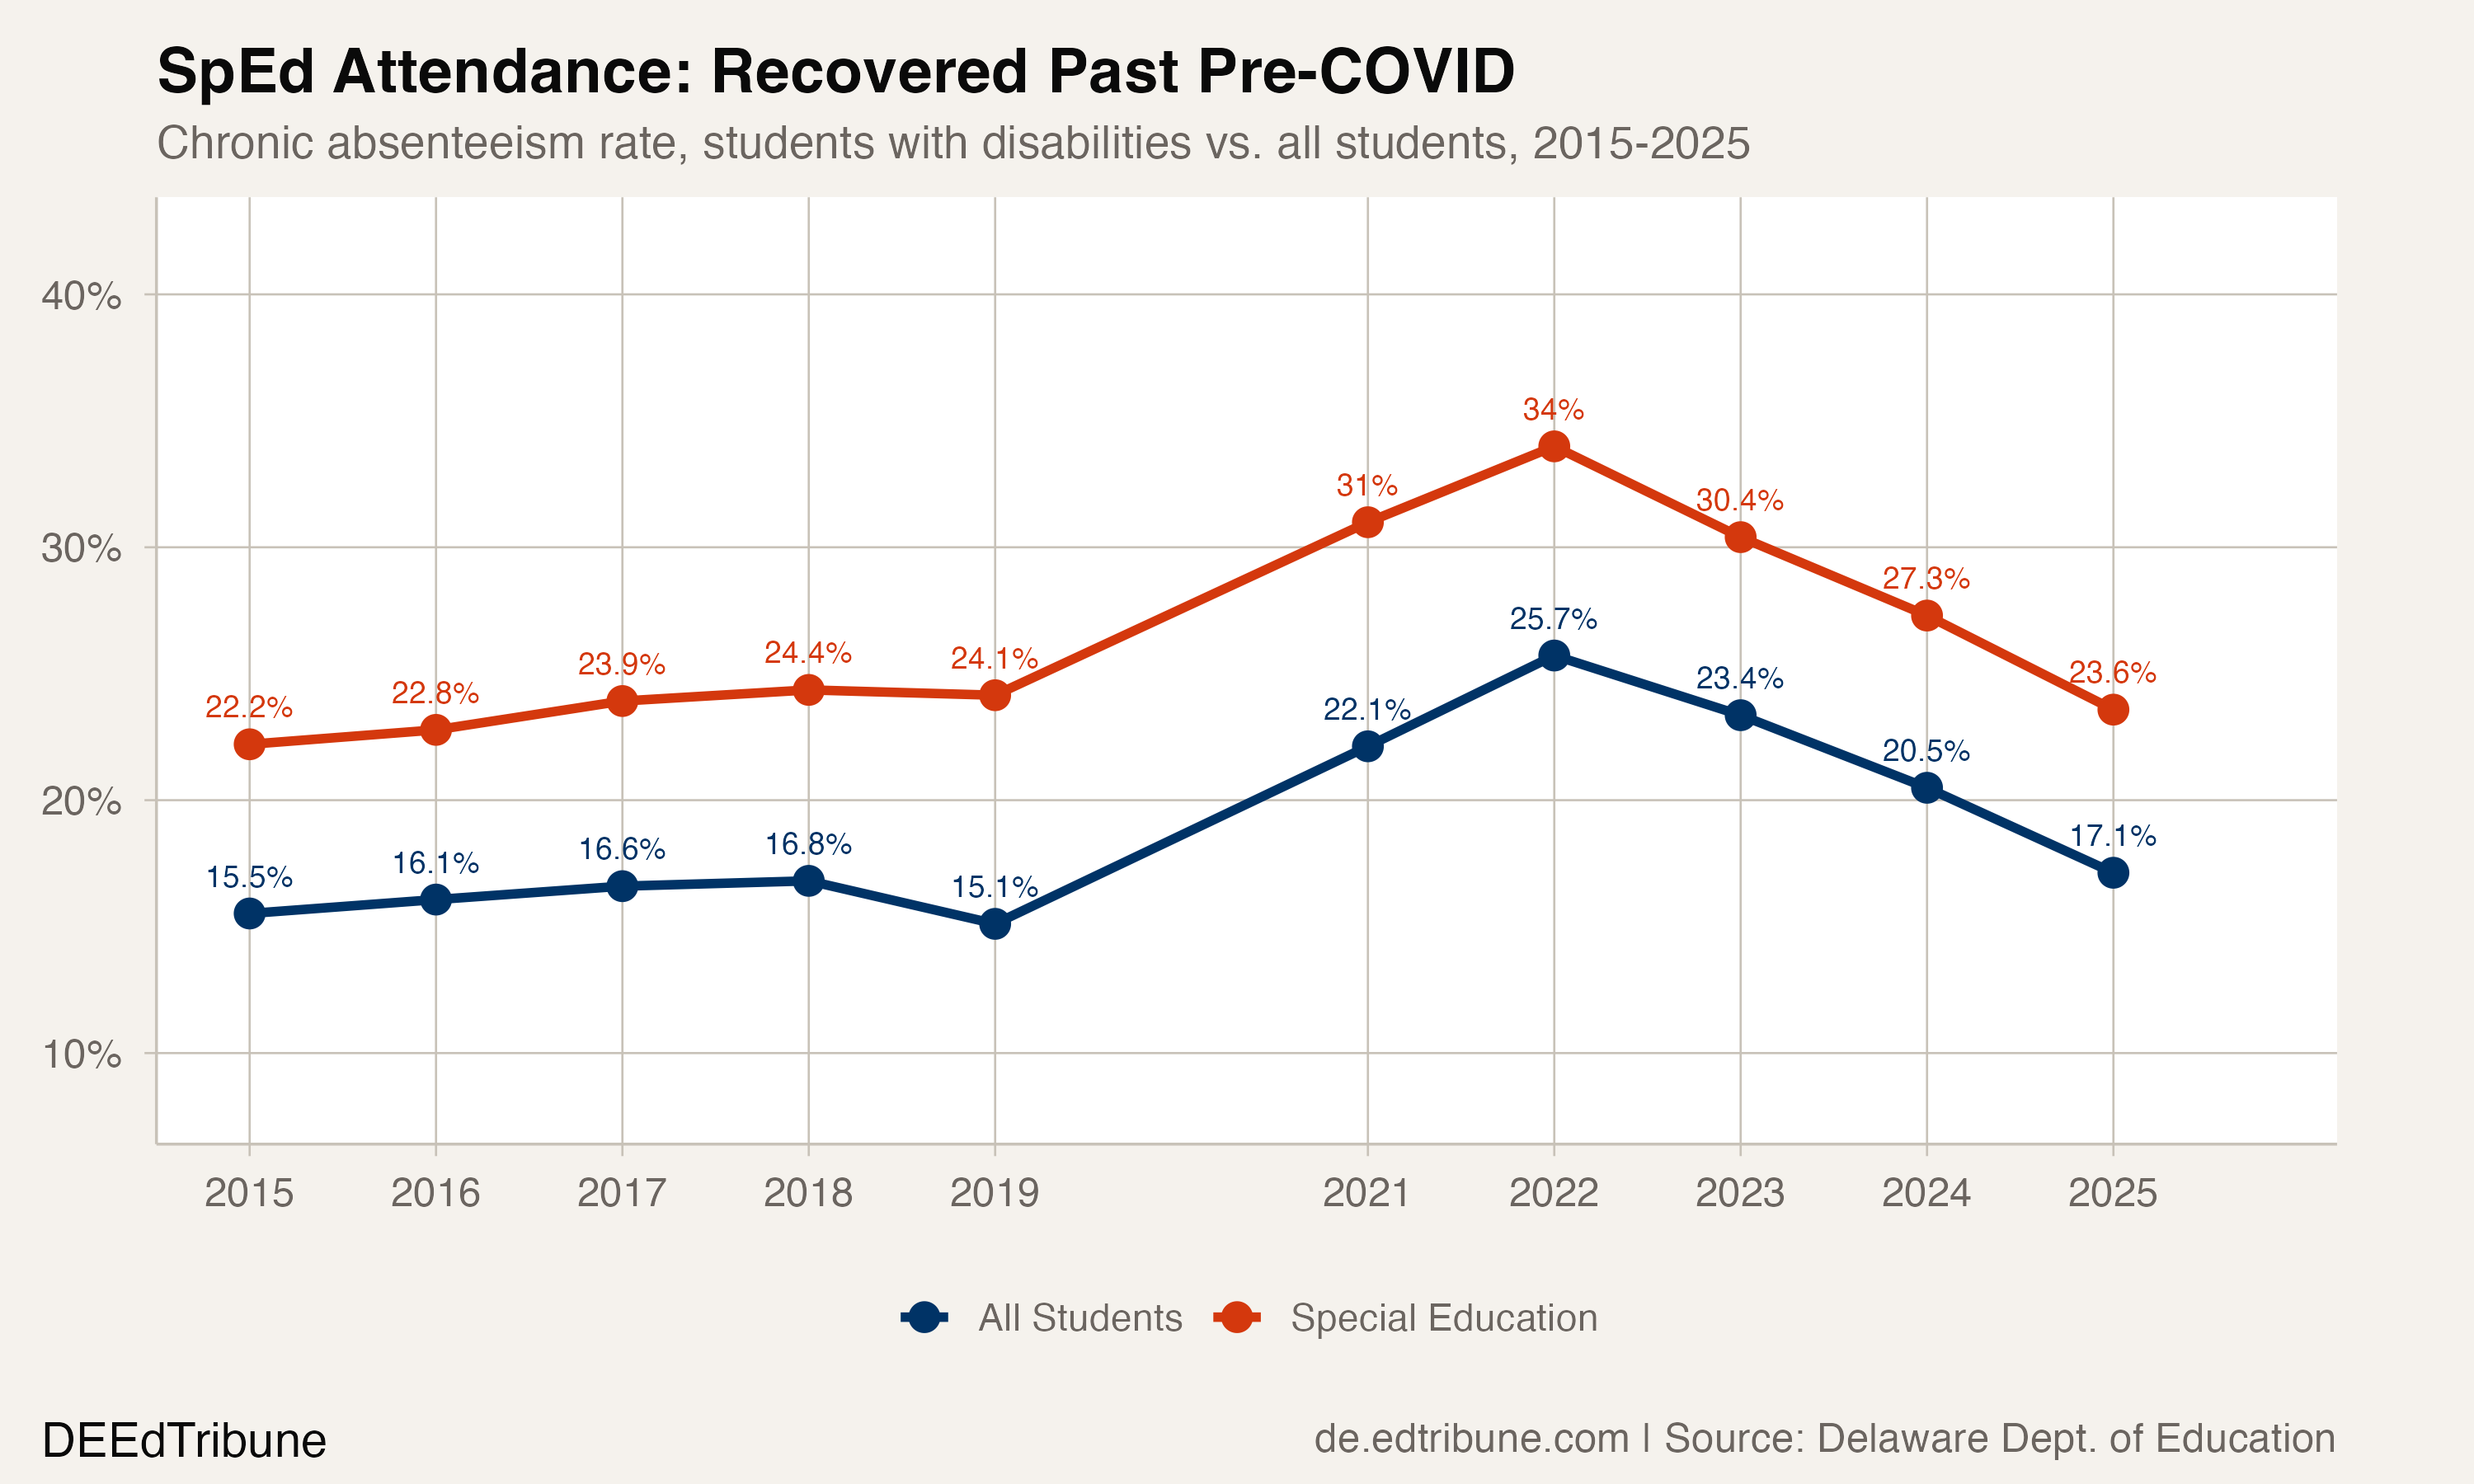
In 2024-25, 23.6% of Delaware's 29,815 students with Individualized Education Programs were chronically absent. In 2018-19, before the pandemic, the rate was 24.1%. Special education is the only major subgroup in the state where today's chronic absenteeism rate sits below where it was before the pandemic. Every other demographic, from economically disadvantaged students (+3.0 percentage points above pre-COVID) to English learners (+3.4 points), remains stuck above its pre-pandemic baseline.

A steeper climb, a faster descent
The recovery is notable partly because the pandemic hit students with disabilities harder than most. In 2021-22, their chronic rate reached 34.0%, a 10-point spike from the 24.1% pre-COVID baseline. That peak meant 9,340 students with IEPs were missing 10% or more of school days, out of a population of 27,476. More than one in three.
The descent was faster than the statewide average in every year of the recovery. Special education rates fell 3.6 points in 2022-23, 3.1 points in 2023-24, and 3.7 points in 2024-25. The all-student average dropped 2.4, 2.9, and 3.4 points over the same period. By 2025, the special education group had erased its entire post-COVID deficit and then some. The overall student body still carries 2.0 points of excess chronic absenteeism.
That outperformance shows up in the days-absent data too. The average student with disabilities missed 11.6 days in 2025, down from 14.9 days at the 2022 peak and now within striking distance of the pre-COVID average of 11.1 days. For all students, the average fell from 12.4 days to 9.6, still nearly a full day above the 2019 level of 8.7.
The gap nobody expected to narrow
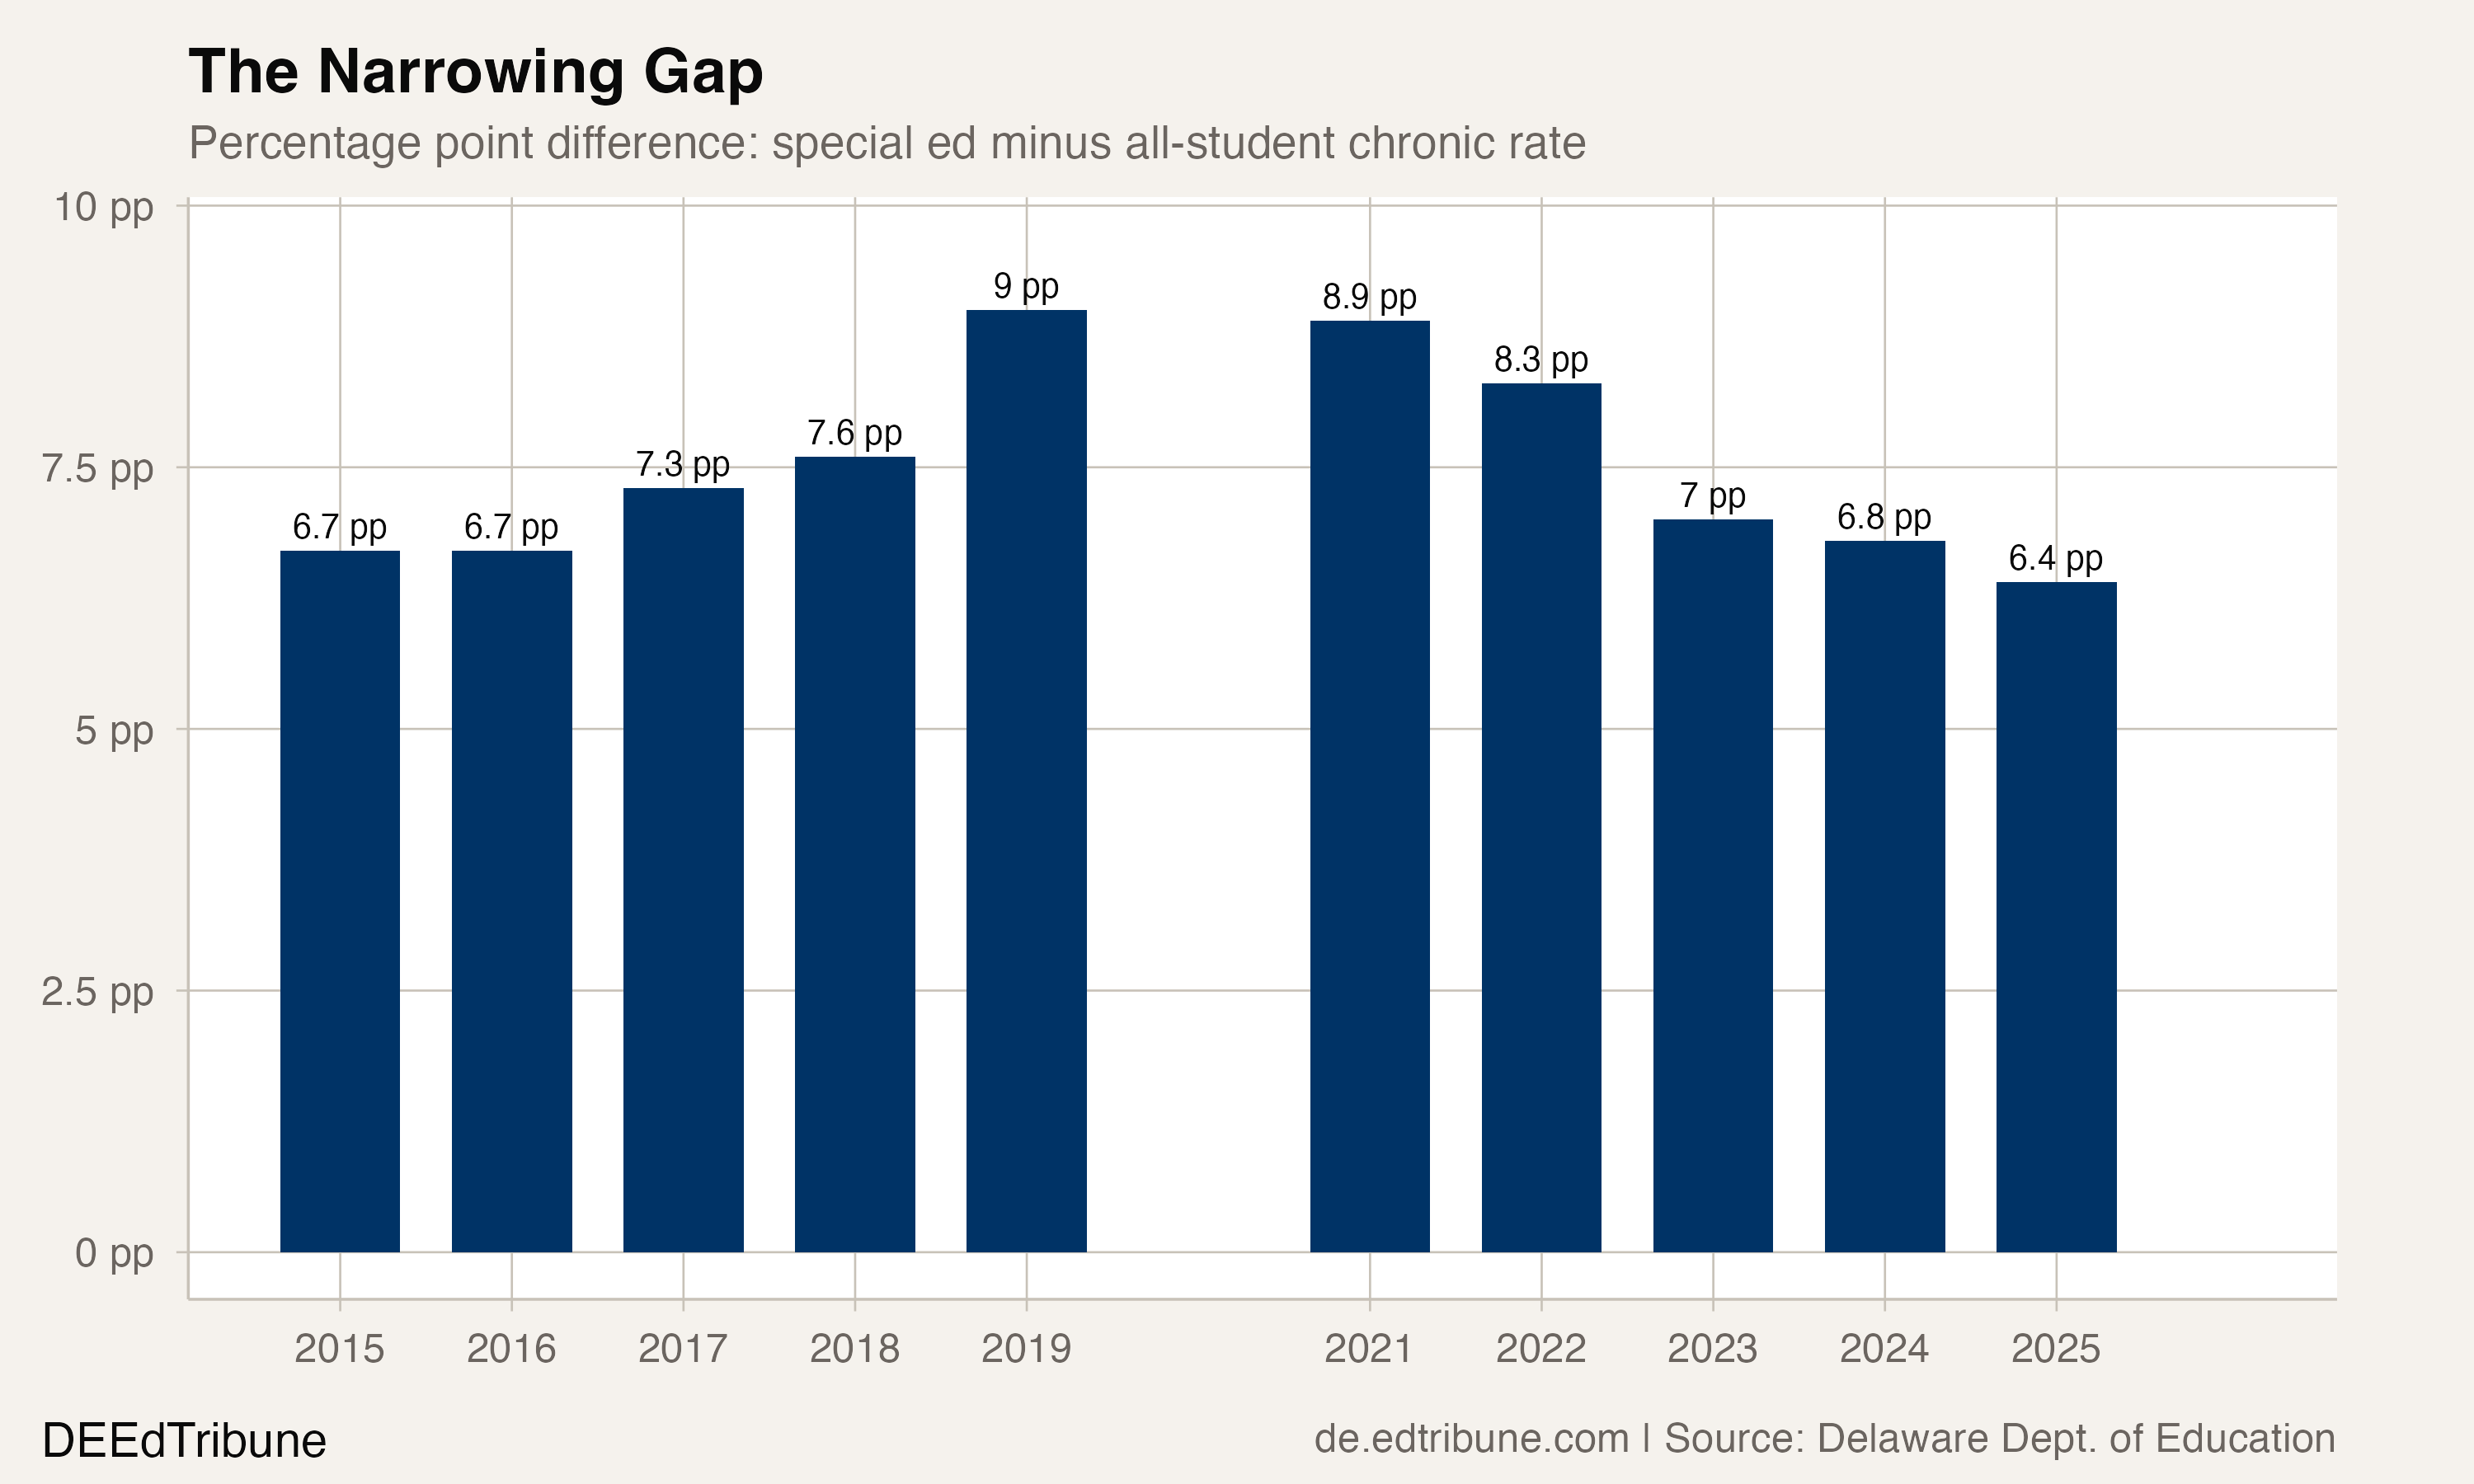
Before the pandemic, special education chronic absenteeism ran about 9.0 percentage points above the all-student rate. That gap reflected the well-documented attendance barriers students with disabilities face: medical appointments, therapy sessions, emotionally based school avoidance, and disciplinary absences that fall disproportionately on students with IEPs. A 2025 study in Frontiers in Education found that in New York City, students with disabilities had a 29.2% chronic absenteeism rate versus 17.6% for those without, and that the gap was driven by "systemic forms of exclusion" including insufficient staffing and school-initiated absences tied to behavior.
In Delaware, that gap has narrowed to 6.4 points, a 2.6-point closure since 2019. The gap actually widened slightly during the pandemic (peaking at 8.9 points in 2021) before compressing steadily: 8.3, 7.0, 6.8, and now 6.4.

The chart puts the special education recovery in context against every other major subgroup. Only students who are currently homeless also dropped below their pre-COVID rate, but that population is far smaller (roughly 4,000 students) and subject to more volatile year-to-year counting. Among large, stable subgroups, special education stands alone.
What might explain it
Delaware's Department of Education has made inclusive practices for students with disabilities a central pillar of its 2025-2028 Strategic Plan, which calls for "improved inclusive, evidence-based instruction and coordinated supports for students with disabilities, including assistive technology, behavior supports, literacy help, and career transition services." The plan also sets a statewide target to reduce chronic absenteeism from 15% to 13% by 2028.
"If only 38% of our third-graders are reading at grade level and chronic absenteeism is at 15%, we have to get past admiring the problem." Secretary of Education Cindy Marten, WDEL, March 2026
The strategic framework is suggestive, but it does not isolate which specific interventions moved the needle for special education attendance. Several plausible mechanisms are at work.
The most likely explanation is compositional: Delaware's special education population grew by 4,387 students between 2019 and 2025, from 25,428 to 29,815. New IEP identifications over a six-year span would tend to bring in students with milder disabilities who were previously uncategorized. If the marginal student added to the special education rolls is less likely to be chronically absent than the average existing IEP student, the rate falls even as the population grows. This is a reclassification-driven improvement rather than a behavior-driven one, and the data cannot distinguish between the two.
A competing explanation is that post-COVID return-to-school interventions, particularly in IEP-mandated services that require in-person delivery, created a stronger pull back to the building for students with disabilities than for the general population. Speech therapy, occupational therapy, and resource room instruction are difficult to deliver virtually, giving families a concrete reason to prioritize attendance.

Where districts made the biggest gains
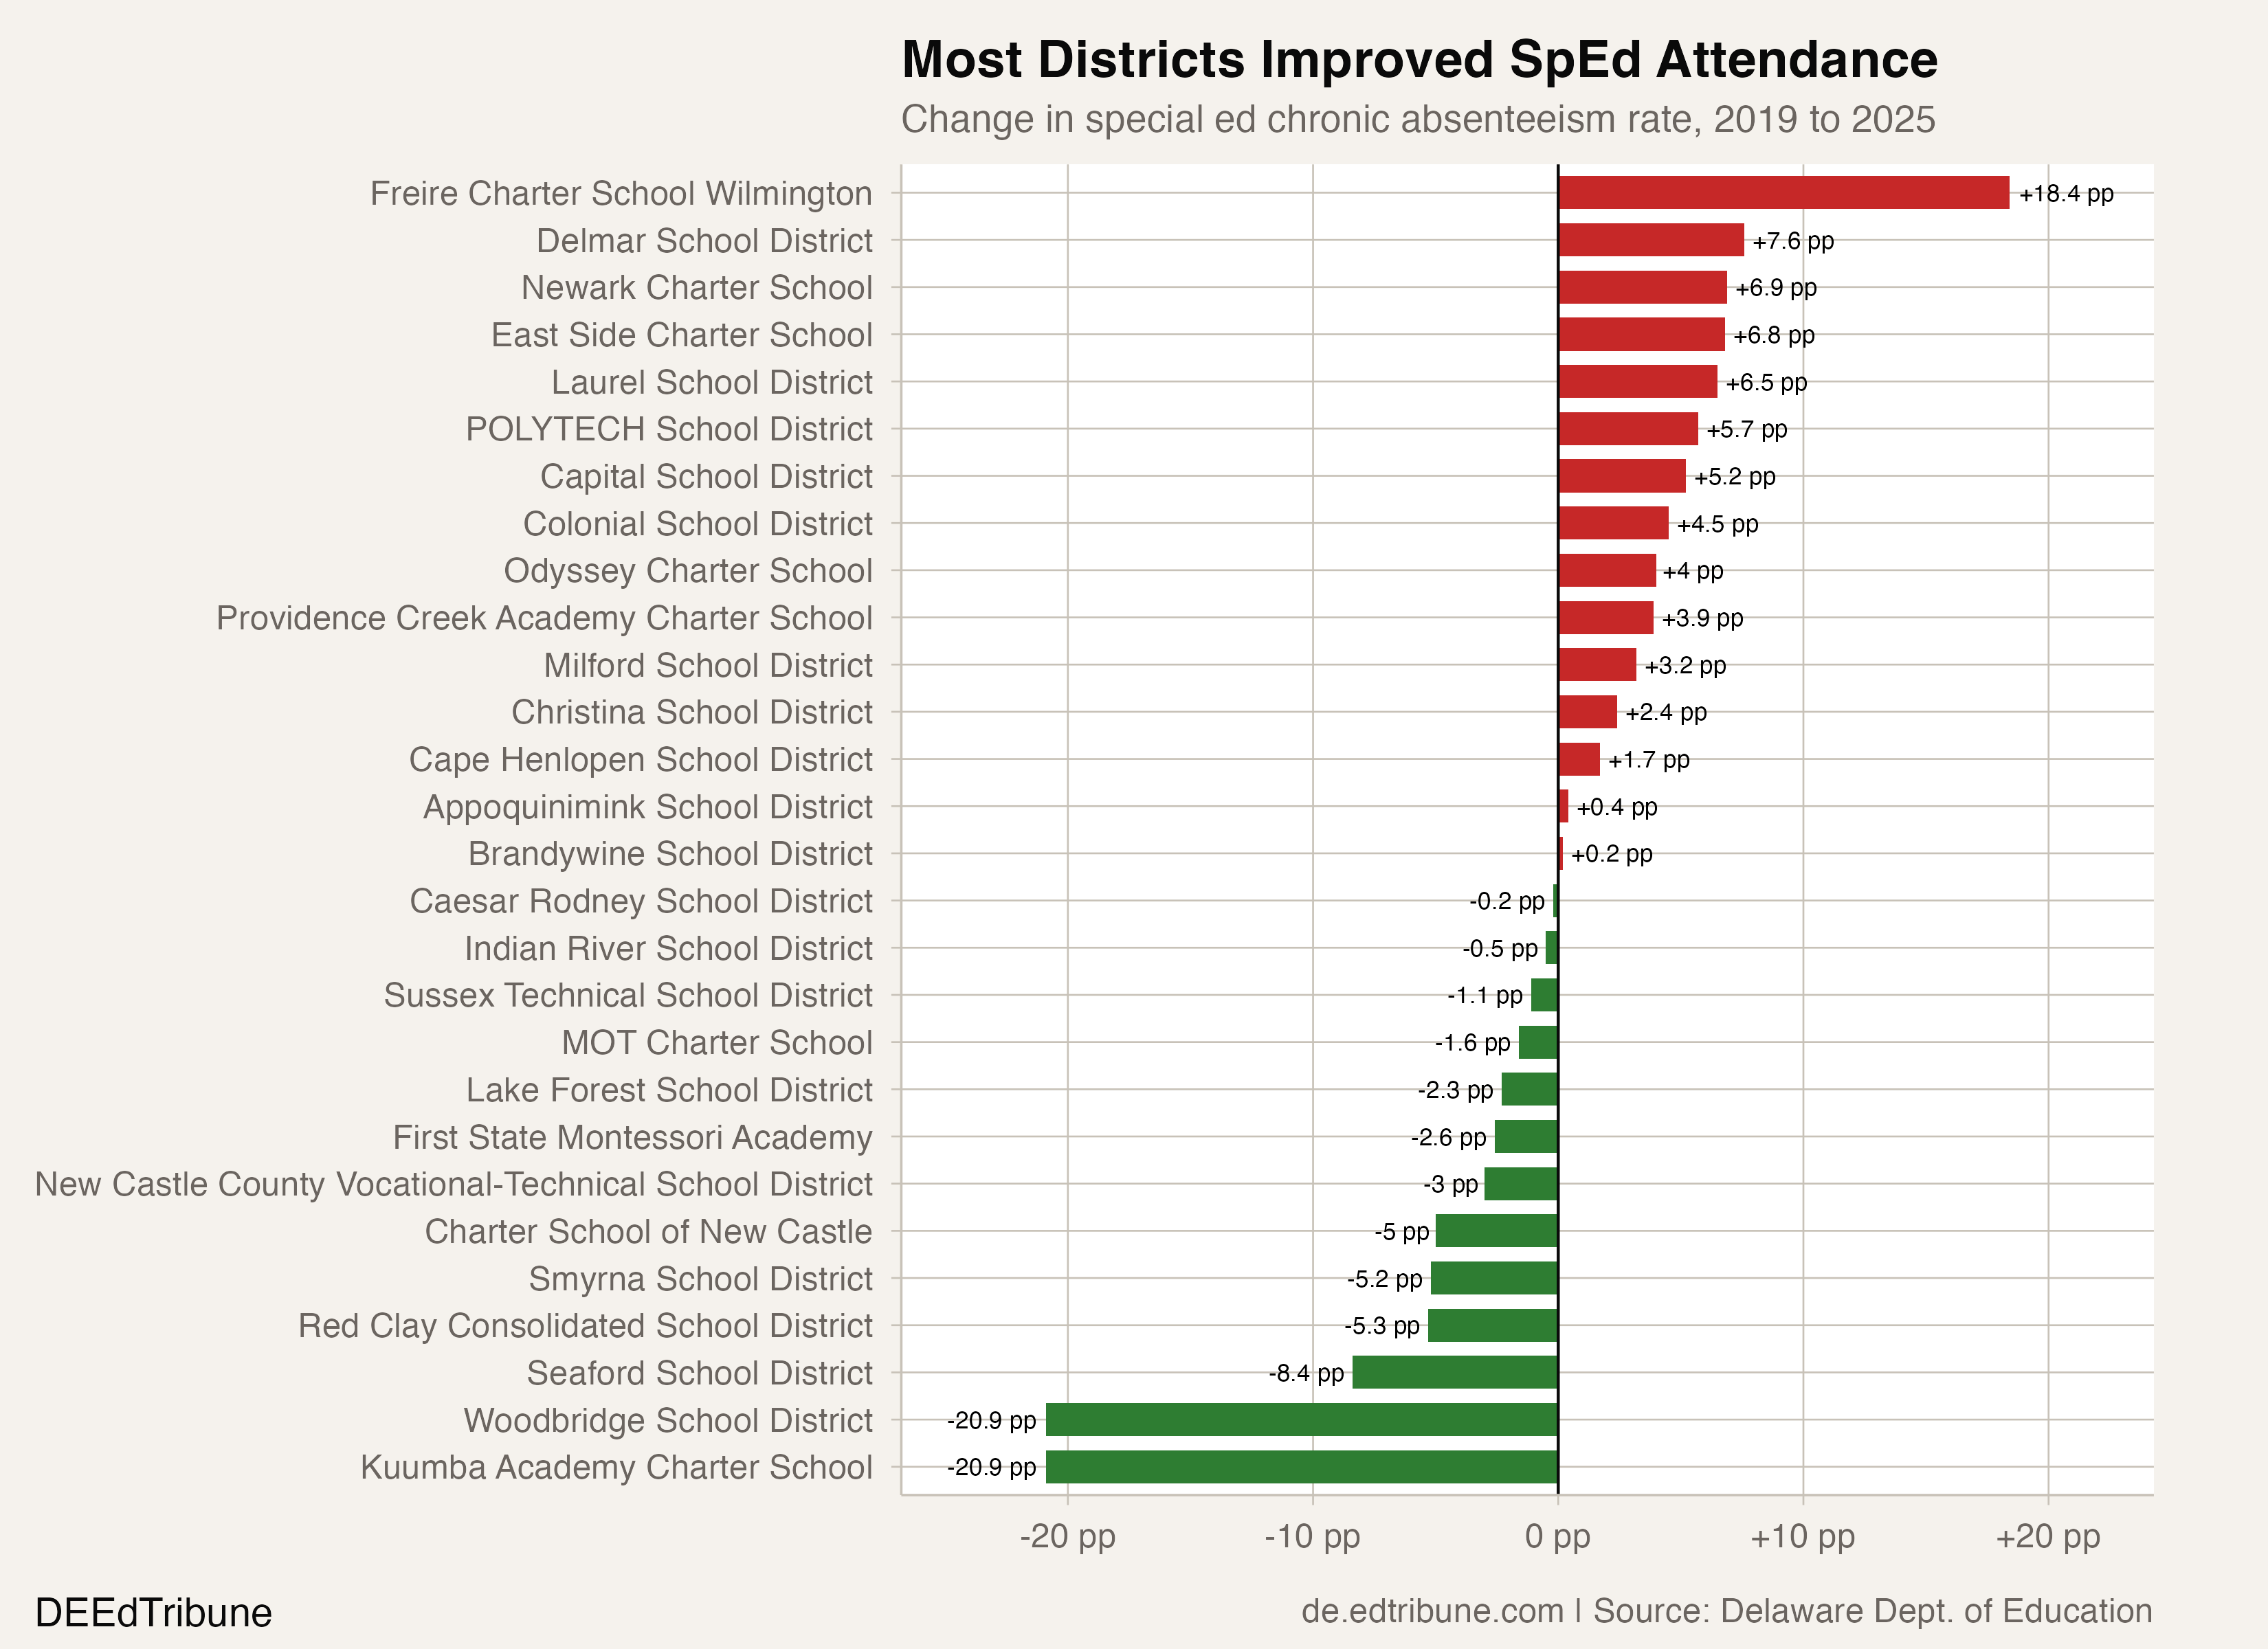
The district-level data reveals enormous variation. Woodbridge↗ET School District, a small rural district in Sussex County, reported a special education chronic rate of just 6.7% in 2025, down from 27.7% in 2019, a 21.0-point improvement. That decline mirrors a broader attendance turnaround in Woodbridge that spans all student groups. Seaford↗ET, another Sussex County district that adopted PowerSchool Attendance Intervention, dropped from 22.0% to 13.6%, an 8.4-point improvement.
Red Clay Consolidated↗ET improved by 5.2 points (29.6% to 24.4%). Smyrna improved by 5.2 points (20.0% to 14.8%). Lake Forest improved by 2.3 points.

Not every district moved in the right direction. Colonial↗ET worsened by 4.4 points (26.5% to 30.9%). Capital↗ET worsened by 5.1 points (26.5% to 31.6%). Christina↗ET, the state's third-largest district by special education enrollment with 3,777 IEP students, worsened by 2.3 points (21.9% to 24.2%). Among Wilmington-area districts, where special education rates are highest in the state, the picture is mixed at best.
Charter schools showed a different pattern entirely. Across all charter entities, the special education chronic rate fell from 20.6% in 2019 to 16.7% in 2025, a 3.9-point improvement. Traditional districts collectively moved from 23.5% to 23.1%, a gain of just 0.4 points. The statewide improvement is being driven substantially by charters, smaller districts, and a handful of large-district improvers like Red Clay and Smyrna.
The caveat inside the good news
A 23.6% chronic rate is still a crisis. Nearly one in four students with disabilities misses enough school to be classified as chronically absent. In 9th grade, the rate reaches 34.5% for students with IEPs. The improvement is real, but the starting point was dire and remains so.
The Rodel Foundation's 2025 At a Glance report notes that chronically absent students are disproportionately represented among students with disabilities, and that factors including health barriers, transportation gaps, and food insecurity compound the challenge. Delaware's IDEA Part B determination for both 2024 and 2025 is Needs Assistance, a federal designation indicating the state has not yet met performance targets for students with disabilities.
The recovery could reflect structural change, or it could be a compositional bounce driven by expanded identification. If the special education population keeps growing at roughly 780 students per year, as it has since 2022, and new identifications continue to skew toward students with milder attendance profiles, the rate will keep improving mechanically. That would be a statistical artifact masquerading as progress. The real test arrives when identification rates stabilize. If chronic absenteeism holds below 24% even after the denominator stops expanding, the attendance gains will have proven durable.
Detailed code that reproduces the analysis and figures in this article is available exclusively to EdTribune subscribers.
Discussion
Sign in to join the discussion.
Loading comments...