Correction (July 20, 2026; audited July 22, 2026): An earlier version said the English-learner attendance gap had not reversed after 2021, presented grade-level English-learner rates that the state package does not publish, and called the 2025 chronically absent count a record. The gap briefly favored English learners again in 2022 before reopening in 2023, and the recorded peak count was 4,053 in 2022. The unsupported grade-level section and unsupported causal speculation have been removed.
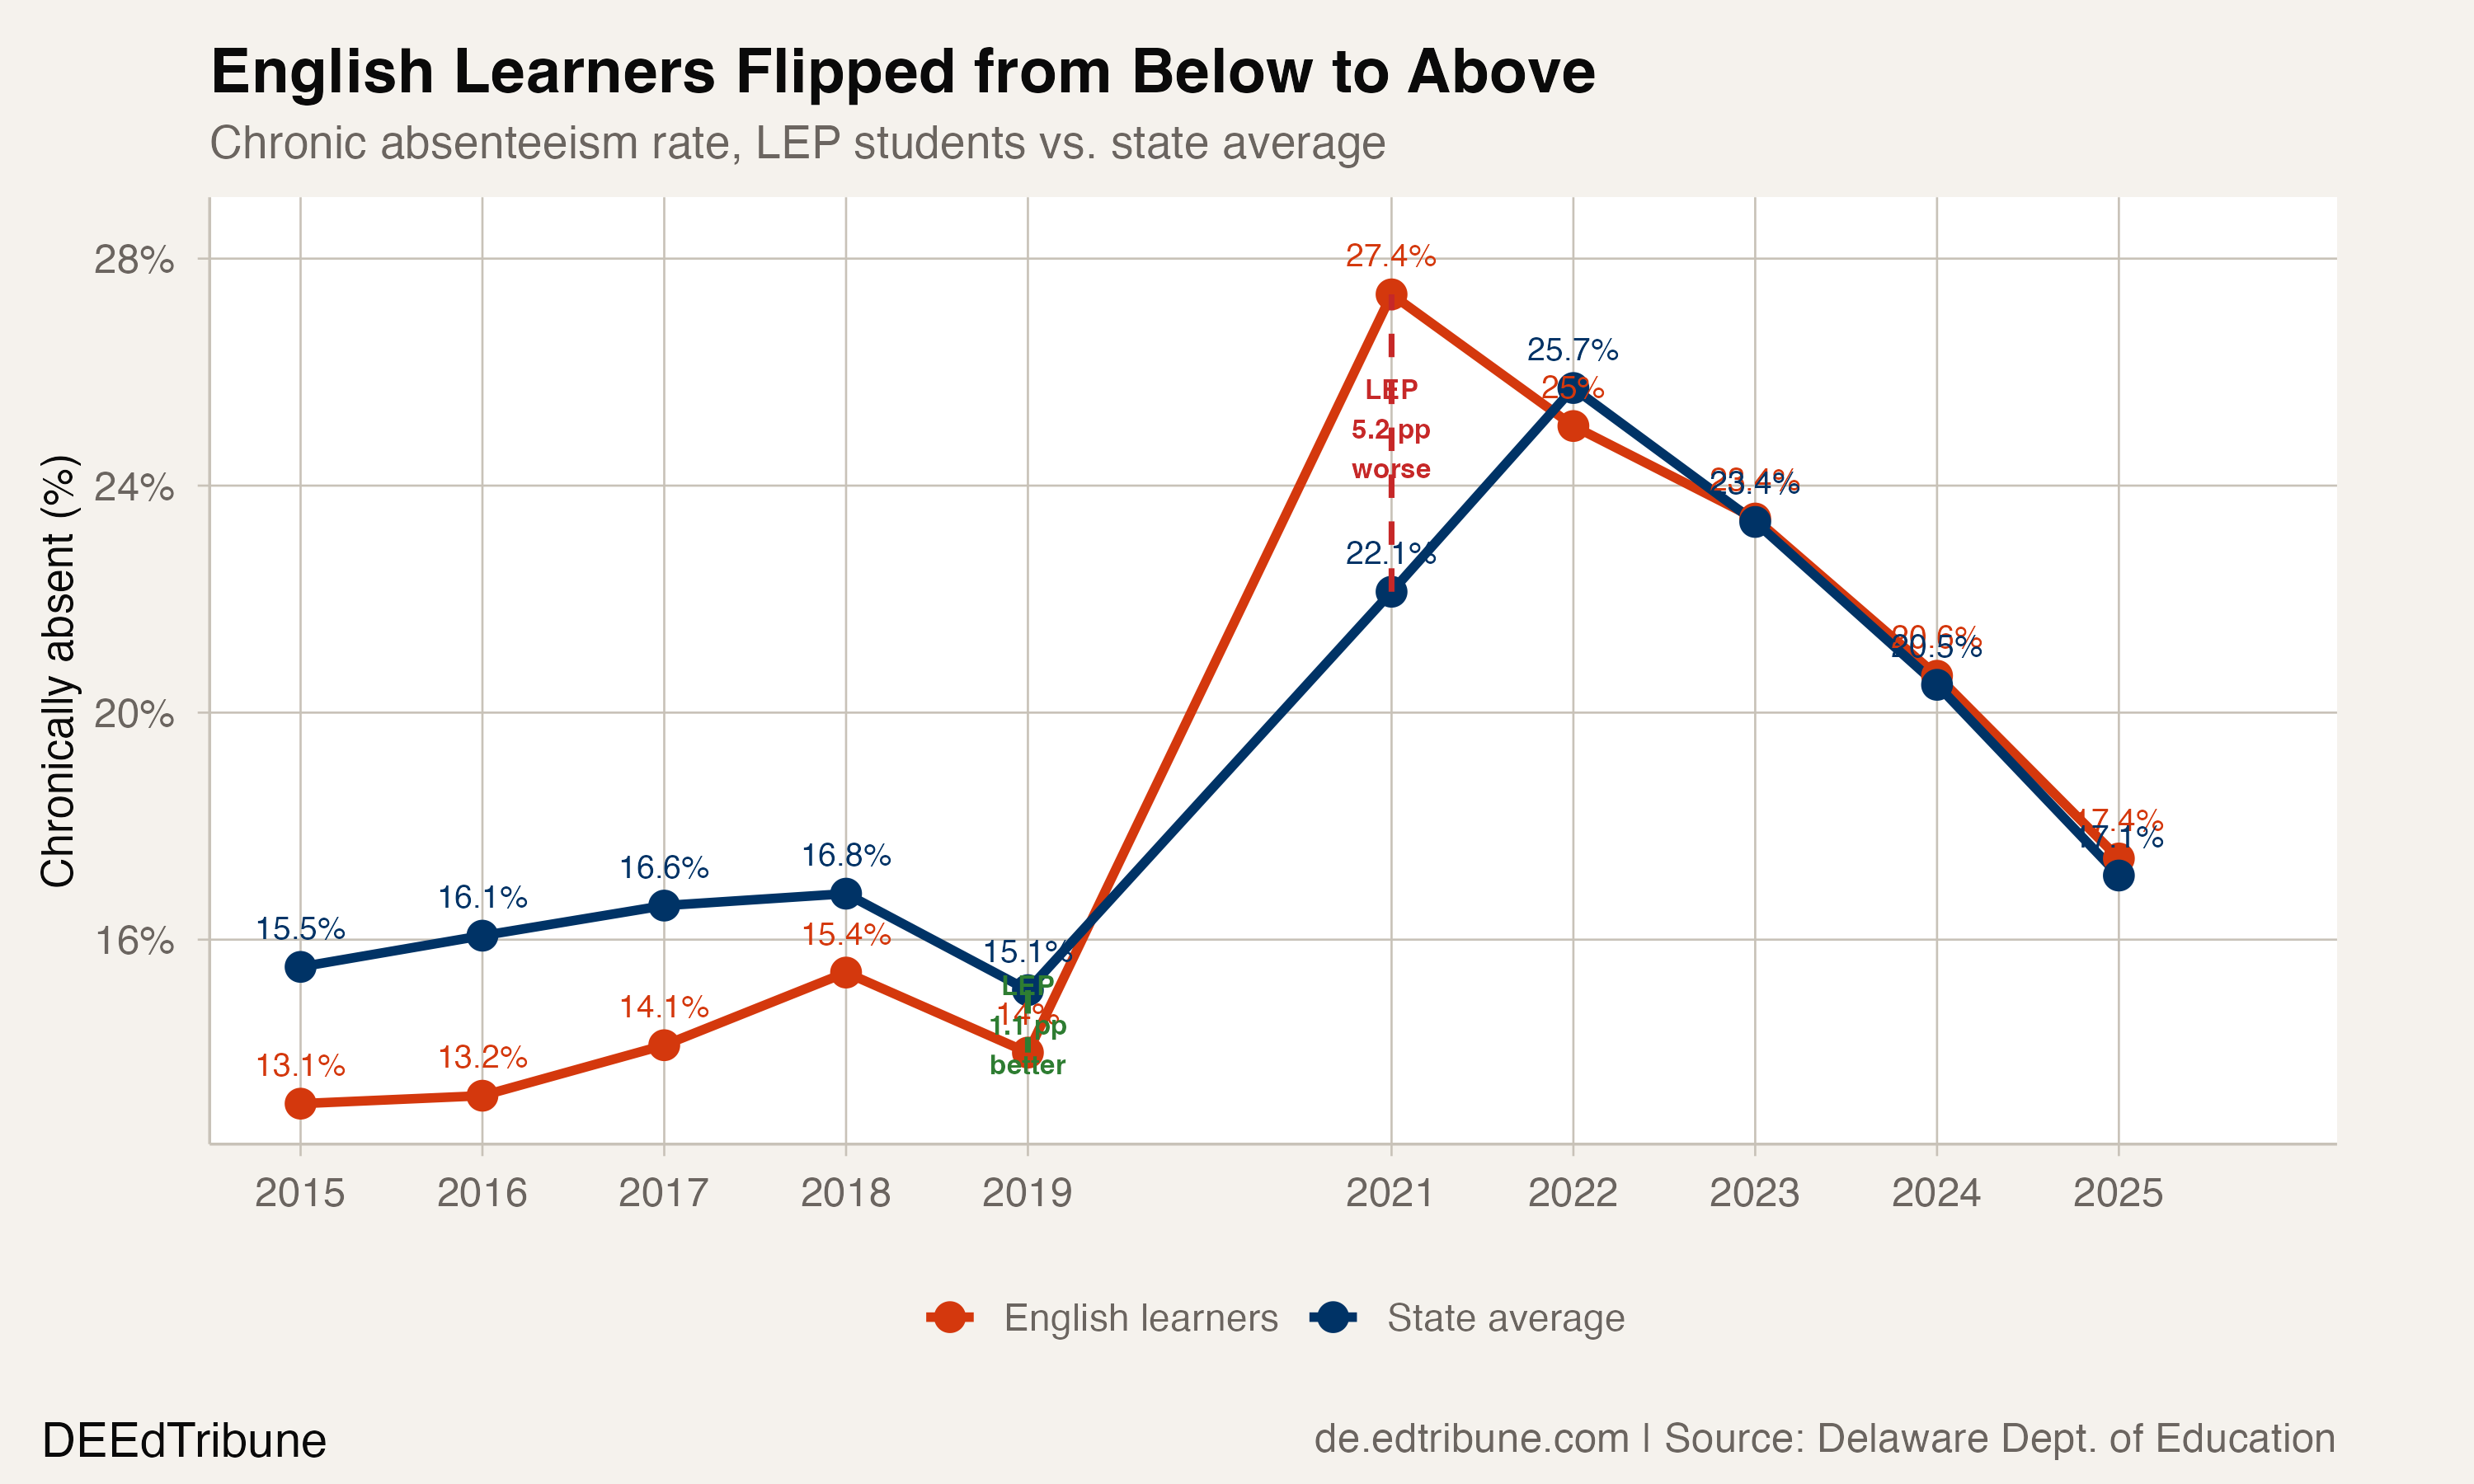
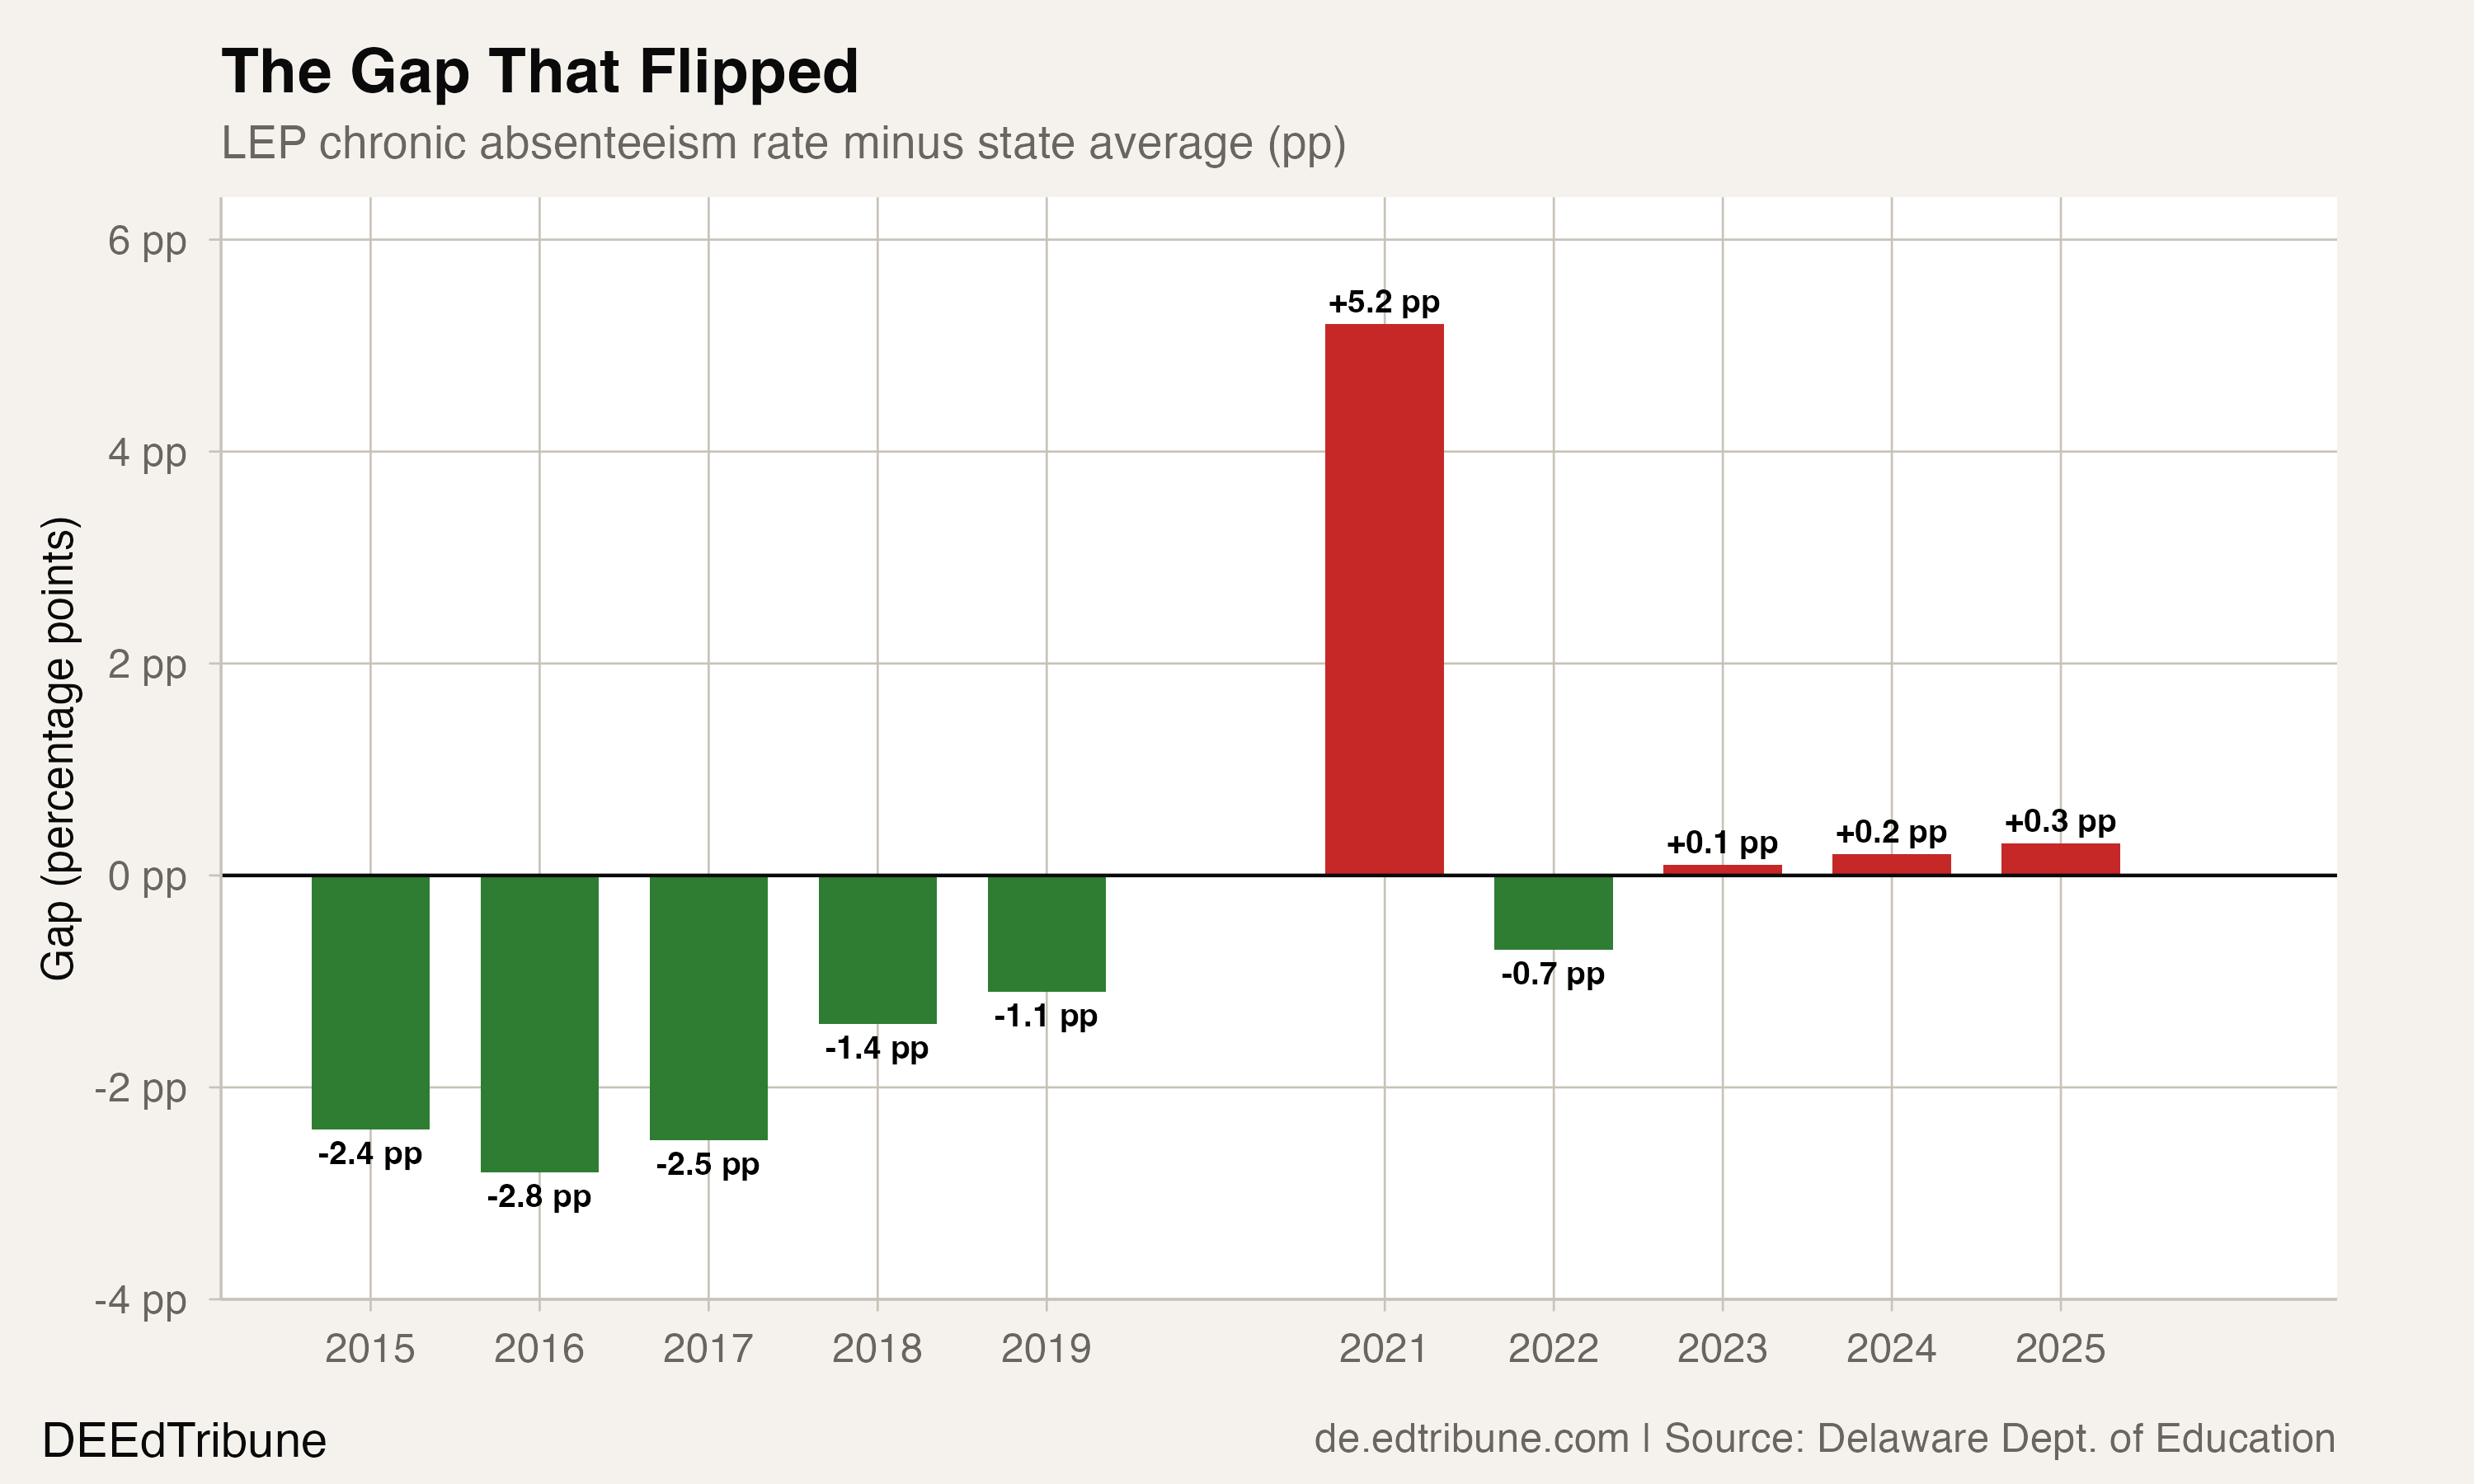
For five straight years before the pandemic, Delaware's English learner students showed up to school at higher rates than their peers. In 2016, their chronic absenteeism rate sat 2.8 percentage points below the state average. In 2019, the gap had narrowed but still favored English learners: 14.0% chronically absent versus 15.1% statewide, a 1.1-point advantage.
One year of pandemic disruption erased all of it. By the 2020-21 school year, English learner chronic absenteeism had nearly doubled to 27.4%, blowing past the state average of 22.1%. The gap did not just close. It inverted: English learners were suddenly 5.2 percentage points worse than average.
The inversion briefly reversed in 2022, when the English learner rate fell 0.7 points below the state average. It reopened in 2023 and widened from 0.1 points that year to 0.2 in 2024 and 0.3 in 2025. In 2024-25, English learner chronic absenteeism stands at 17.4%, just above the state average of 17.1%. The current gap is small, but a population that outperformed the average in every pre-pandemic year no longer does.
Five years of advantage, erased in one
The pre-COVID pattern was consistent and substantial. From 2015 through 2019, English learner chronic absenteeism ran 1.1 to 2.8 percentage points below the state average every single year. [Suggestive context:] A UCLA and University of Pennsylvania study of four California districts documented a similar pre-pandemic advantage and later reversal, though that evidence does not establish the cause of Delaware's pattern.
That California study covered 444,000 students across four districts and found no meaningful difference in absenteeism between English learners and peers in 2016, then a sharp divergence by 2021, with English learners absent at higher rates. The researchers found that students reclassified as English-proficient recovered to pre-pandemic absence levels, suggesting the absenteeism problem concentrates among those who remain classified as English learners. Delaware's aggregate attendance data shows a similar reversal but cannot identify the mechanism.
The slowest recovery in the building
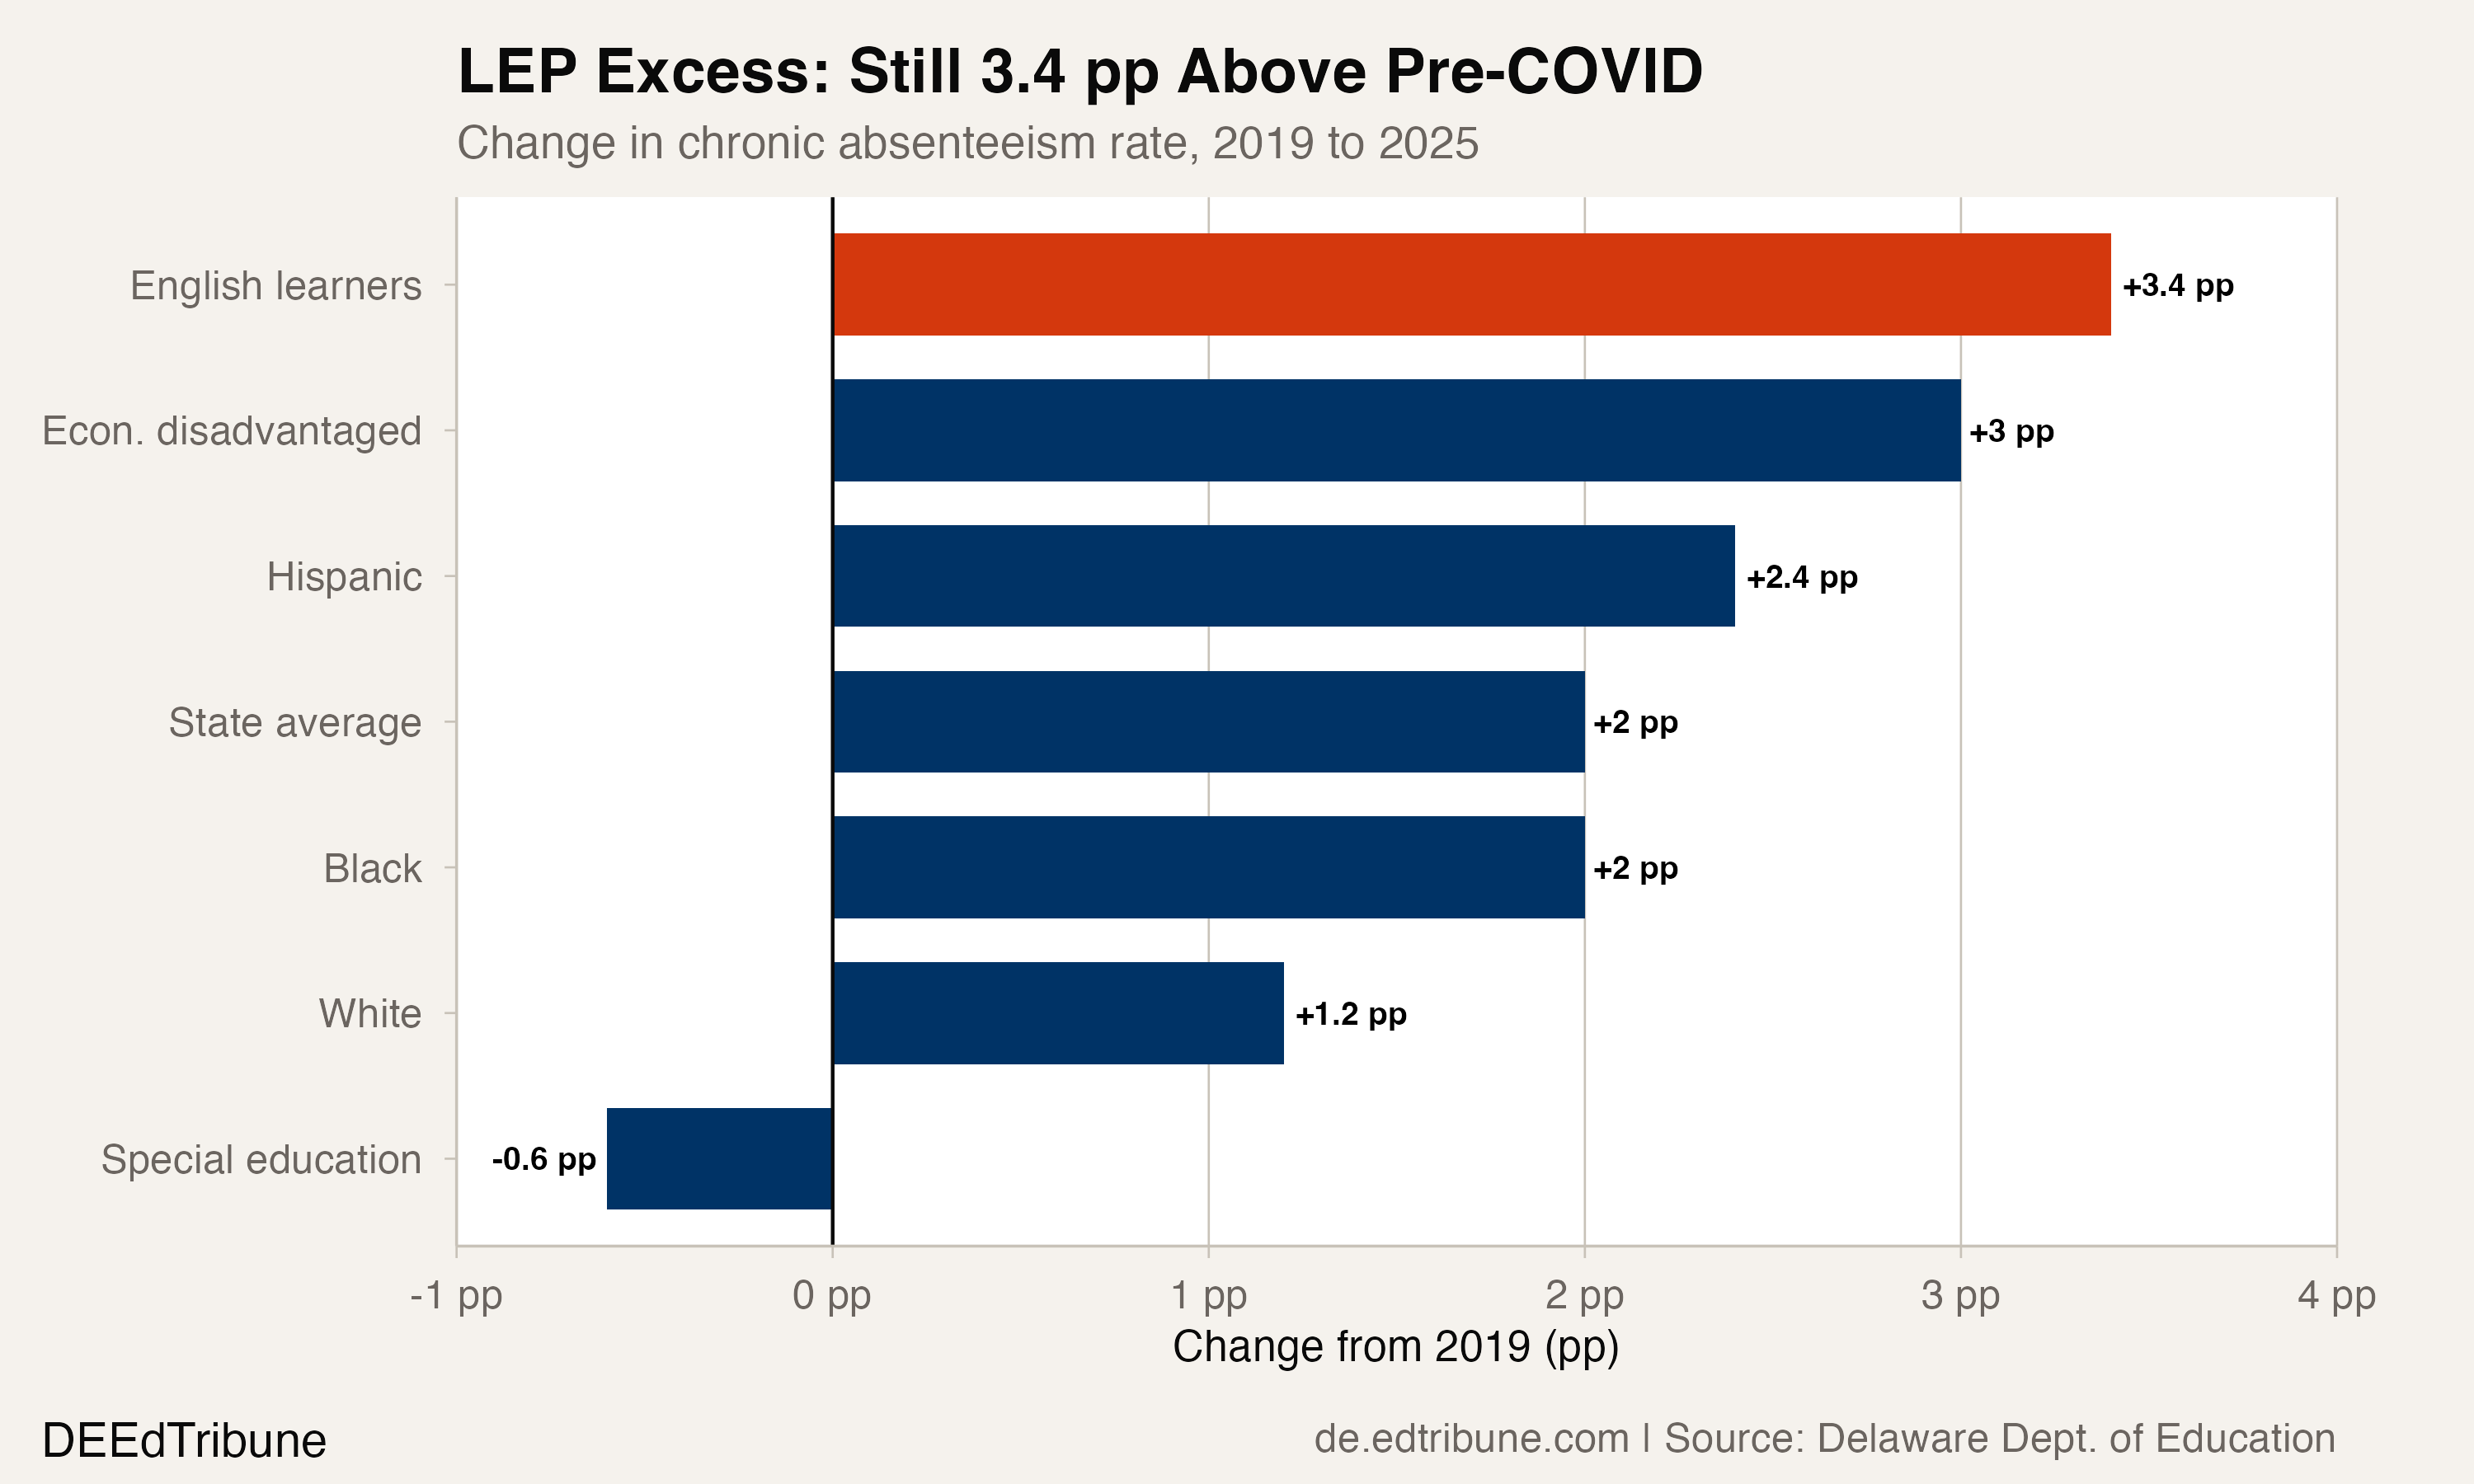
Delaware's overall chronic absenteeism rate is 81% of the way back to its pre-COVID level. English learners have not kept up.
The state average sits 2.0 percentage points above its 2019 baseline. English learners sit 3.4 points above theirs, the largest excess among the major subgroups published by the package for both years. LEP recovery stands at 74.4%, trailing the statewide 81.0%.
In raw numbers, the gap is more tangible. In 2019, 2,060 English learners were chronically absent out of 14,701 total. In 2025, it is 3,353 out of 19,238. The LEP population grew by 31% over that span, but the number of chronically absent English learners grew by 63%.
Inside Colonial and Brandywine
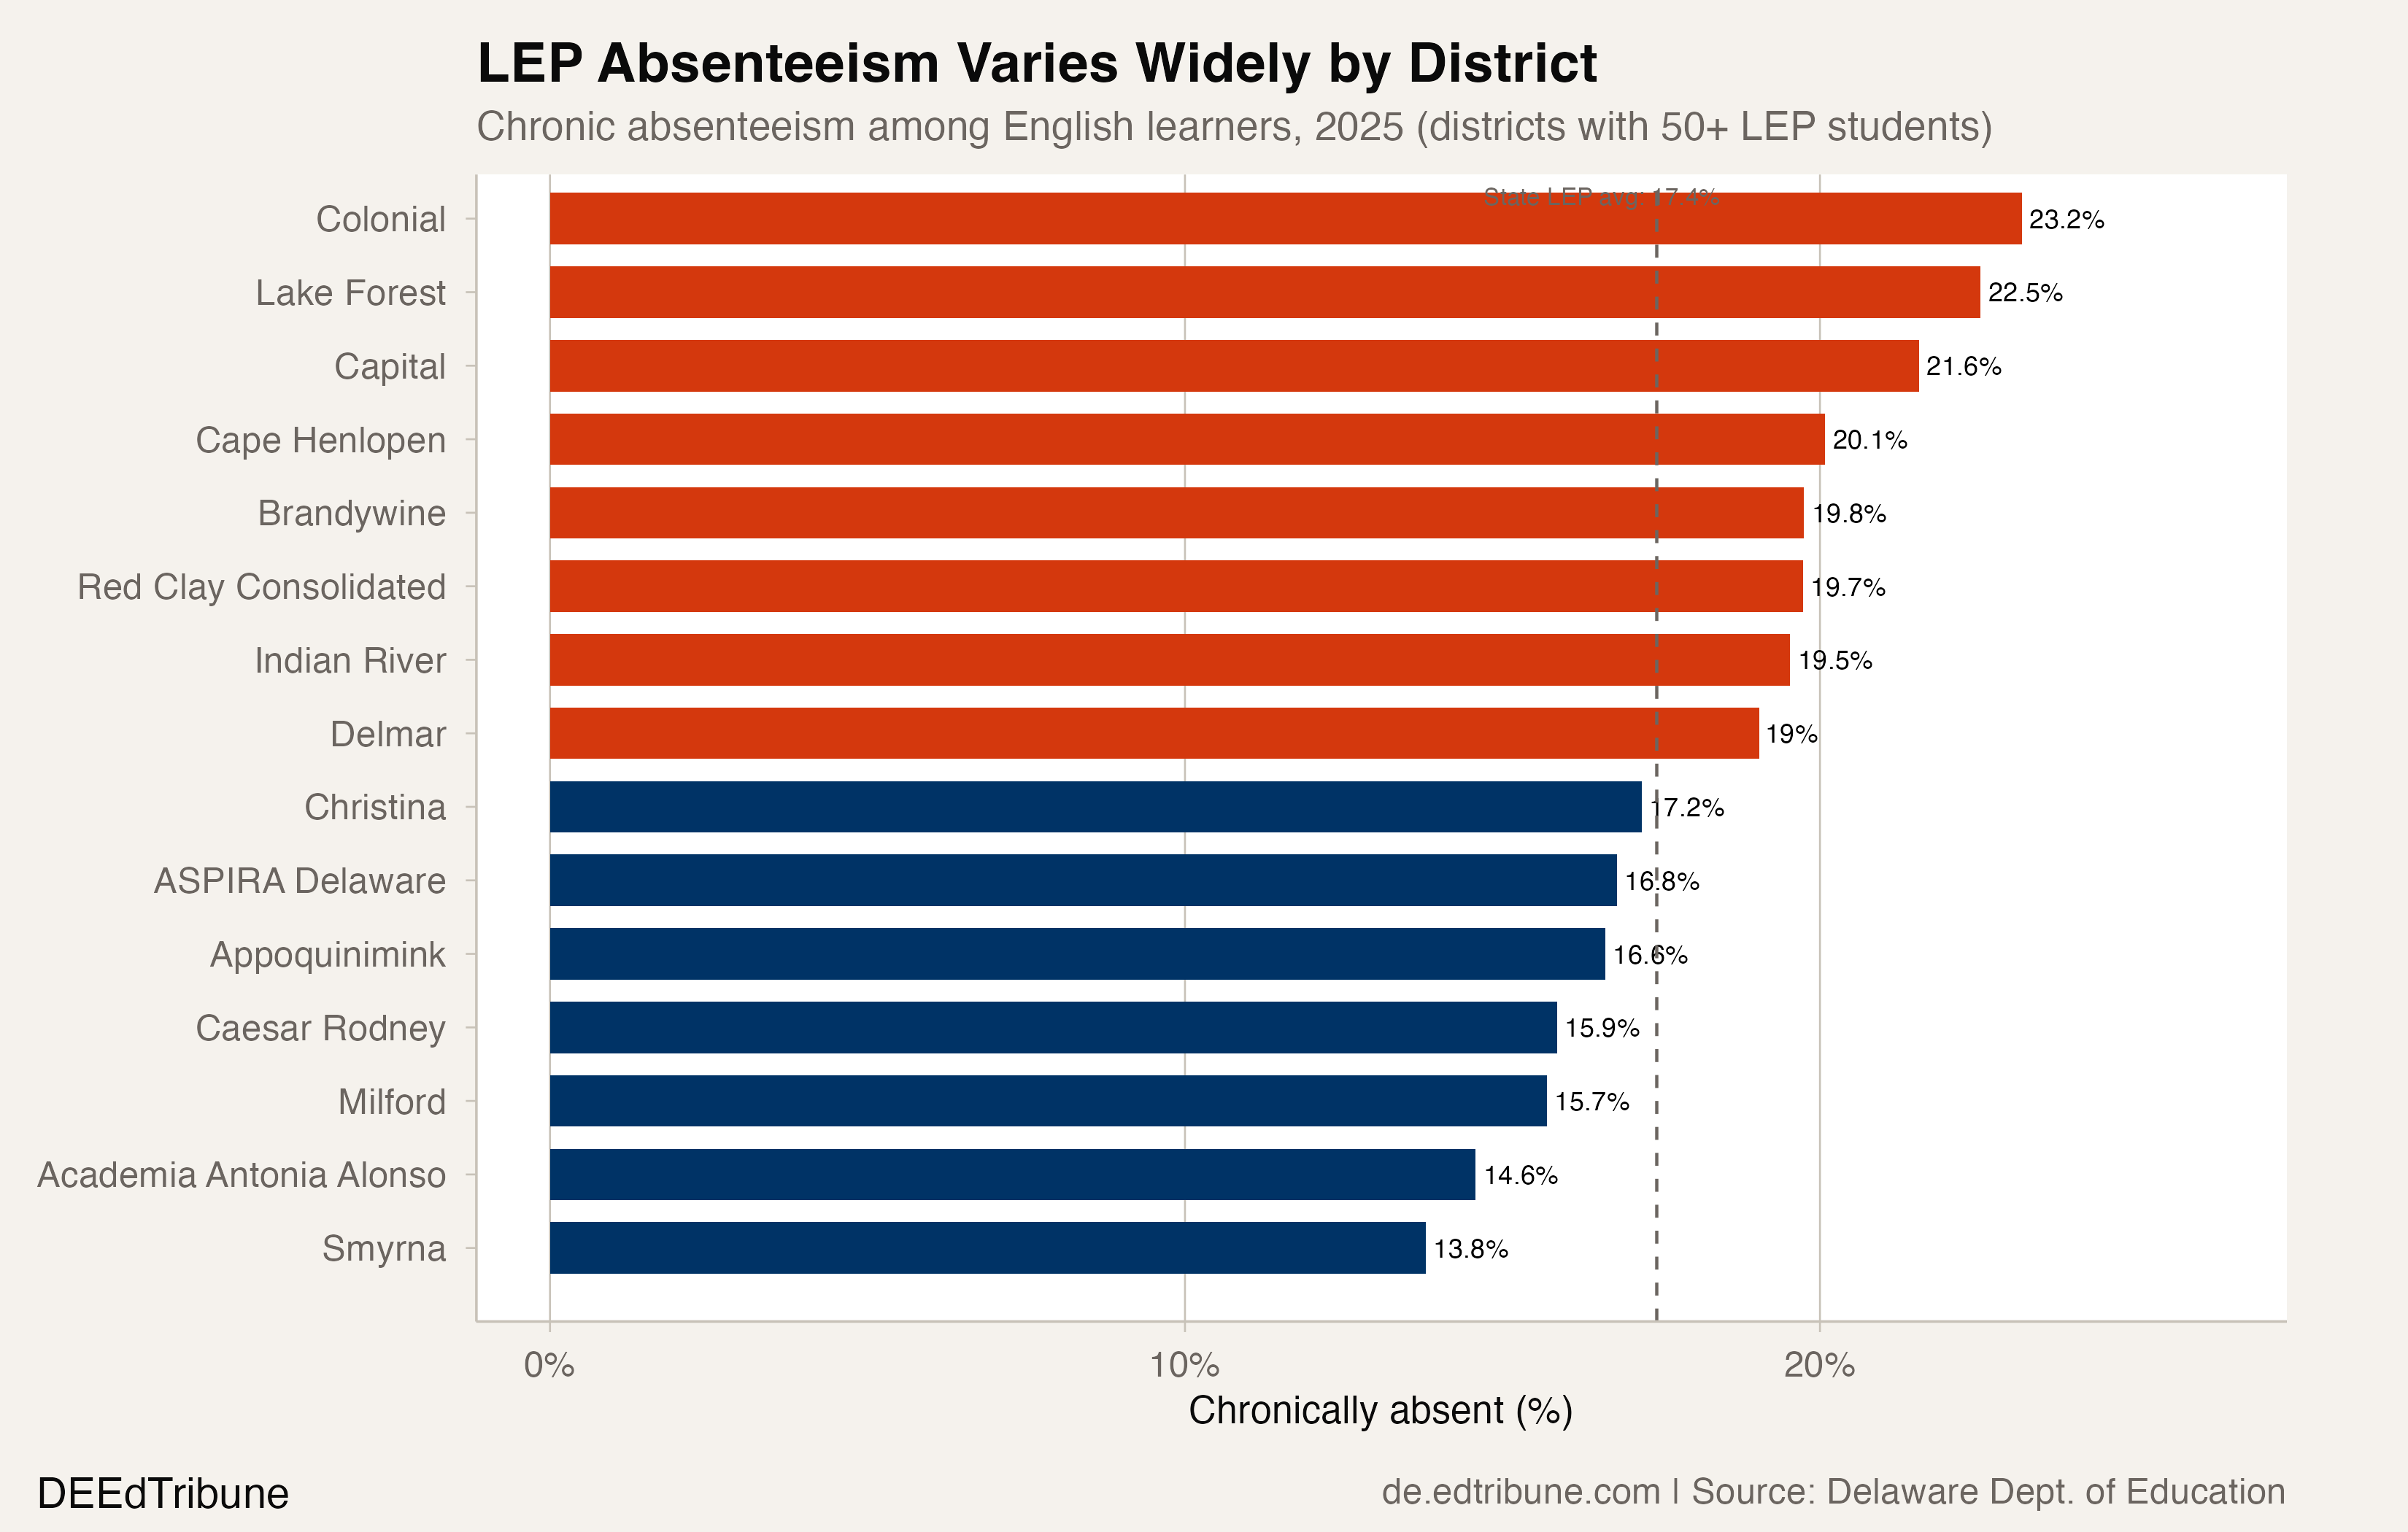
The statewide numbers smooth over district-level variation that ranges from near-zero to above 23%.
Colonial↗ET School District has the highest LEP chronic absenteeism rate among traditional districts at 23.2%, up from 15.2% in 2019. Nearly one in four of Colonial's 1,510 English learners is chronically absent. Colonial's overall chronic rate, 24.9%, already places it well above the state average, but the deterioration among English learners has been sharper: an 8.0-point increase compared to the district's 5.6-point overall rise.
Brandywine↗ET tells a similar story. Its LEP chronic rate more than doubled from 9.4% in 2019 to 19.8% in 2025, a 10.4-point swing that represents the largest absolute increase among districts with sizable English learner populations.
The bright spots sit at the opposite end. Seaford↗ET School District dropped its LEP chronic rate from 13.8% to 6.1%, and Woodbridge↗ET fell from 13.6% to 3.4%. The aggregate data establishes those LEP improvements but does not identify which interventions, if any, caused them.
A growing population with a stickier problem
Delaware's English learner population grew from 9,639 in 2015 to 19,238 in 2025, nearly doubling. That growth complicates the recovery picture because the aggregate group changes as students enter and exit the classification; the data cannot determine how many current English learners were enrolled before the pandemic.
The composition of who counts as an "English learner" shifts constantly. Students who gain proficiency exit the classification. New arrivals enter it. The population in 2025 is not the same population as in 2019. This makes the gap comparison both more and less alarming: more, because the structural advantage appears gone regardless of who is in the group; less, because the 2025 cohort may face different barriers than the 2019 cohort did.
"Something changed, and I think we need to understand how it changed" and how schools can "re-engage these students and families." Lucrecia Santibañez, UCLA researcher, The 74, Oct. 2024
[Suggestive context:] Delaware Education Secretary Mark Holodick told Delaware Public Media that remote work had reduced the burden some families face when students stay home. That statewide observation did not isolate English learner families, and the attendance records cannot show whether it contributed to the LEP pattern.
Immigration enforcement presents another possible factor. [Suggestive context:] A 2025 UCLA IDEA survey of more than 600 high school principals found that 63.8% reported students from immigrant families missing school due to policies or political rhetoric related to immigration. Whether enforcement fears explain any of Delaware's 2024-25 data is impossible to confirm with attendance records alone.
The question the data cannot answer
The most important distinction this data cannot make: Is the elevated LEP absenteeism driven by the same students who were present before COVID and are now absent more, or by new students entering the system with different attendance patterns? Delaware's LEP population added 4,537 students between 2019 and 2025. If those new entrants arrived with higher baseline absenteeism, the "flip" may be less about a deterioration in existing families' behavior and more about the changing composition of who English learners are in Delaware. That is a competing explanation, not a conclusion supported by the attendance records.
Those explanations would require different follow-up research: re-engagement among families already enrolled before the pandemic versus initial engagement among newer arrivals. The attendance records do not distinguish them.
Either way, 3,353 English learners missed more than 10% of school in 2024-25. That was below the recorded count peak of 4,053 in 2022 but 63% above the 2019 count, even as the rate has dropped substantially from its 2021 peak.
Detailed code that reproduces the analysis and figures in this article is available exclusively to EdTribune subscribers.
Discussion
Sign in to join the discussion.
Loading comments...