In Delaware's district-level chronic-absence data, 32 entities have a full decade of records. Nine kept their chronic absenteeism rate below the state average in every available year. Only two of those served at least 5,000 students in 2024-25: Appoquinimink and Smyrna↗ET. Smyrna enrolled 6,008 students that year, and 12.1% were chronically absent, 5.0 percentage points below the state's 17.1%.
Ten data years. No exceptions. Not during the pre-COVID era, when Smyrna held steady around 11% while the state climbed toward 17%. Not during 2021-22, when COVID pushed the statewide rate to 25.7% and Smyrna spiked to 20.7%, still about five points below. Not in the recovery years that followed, when Smyrna remained under the state line.
The gap that widened after COVID
Before the pandemic, Smyrna's advantage over the state was modest. In 2018-19, the district posted 11.9% against 15.1% statewide, a gap of 3.2 percentage points, the narrowest in the dataset.
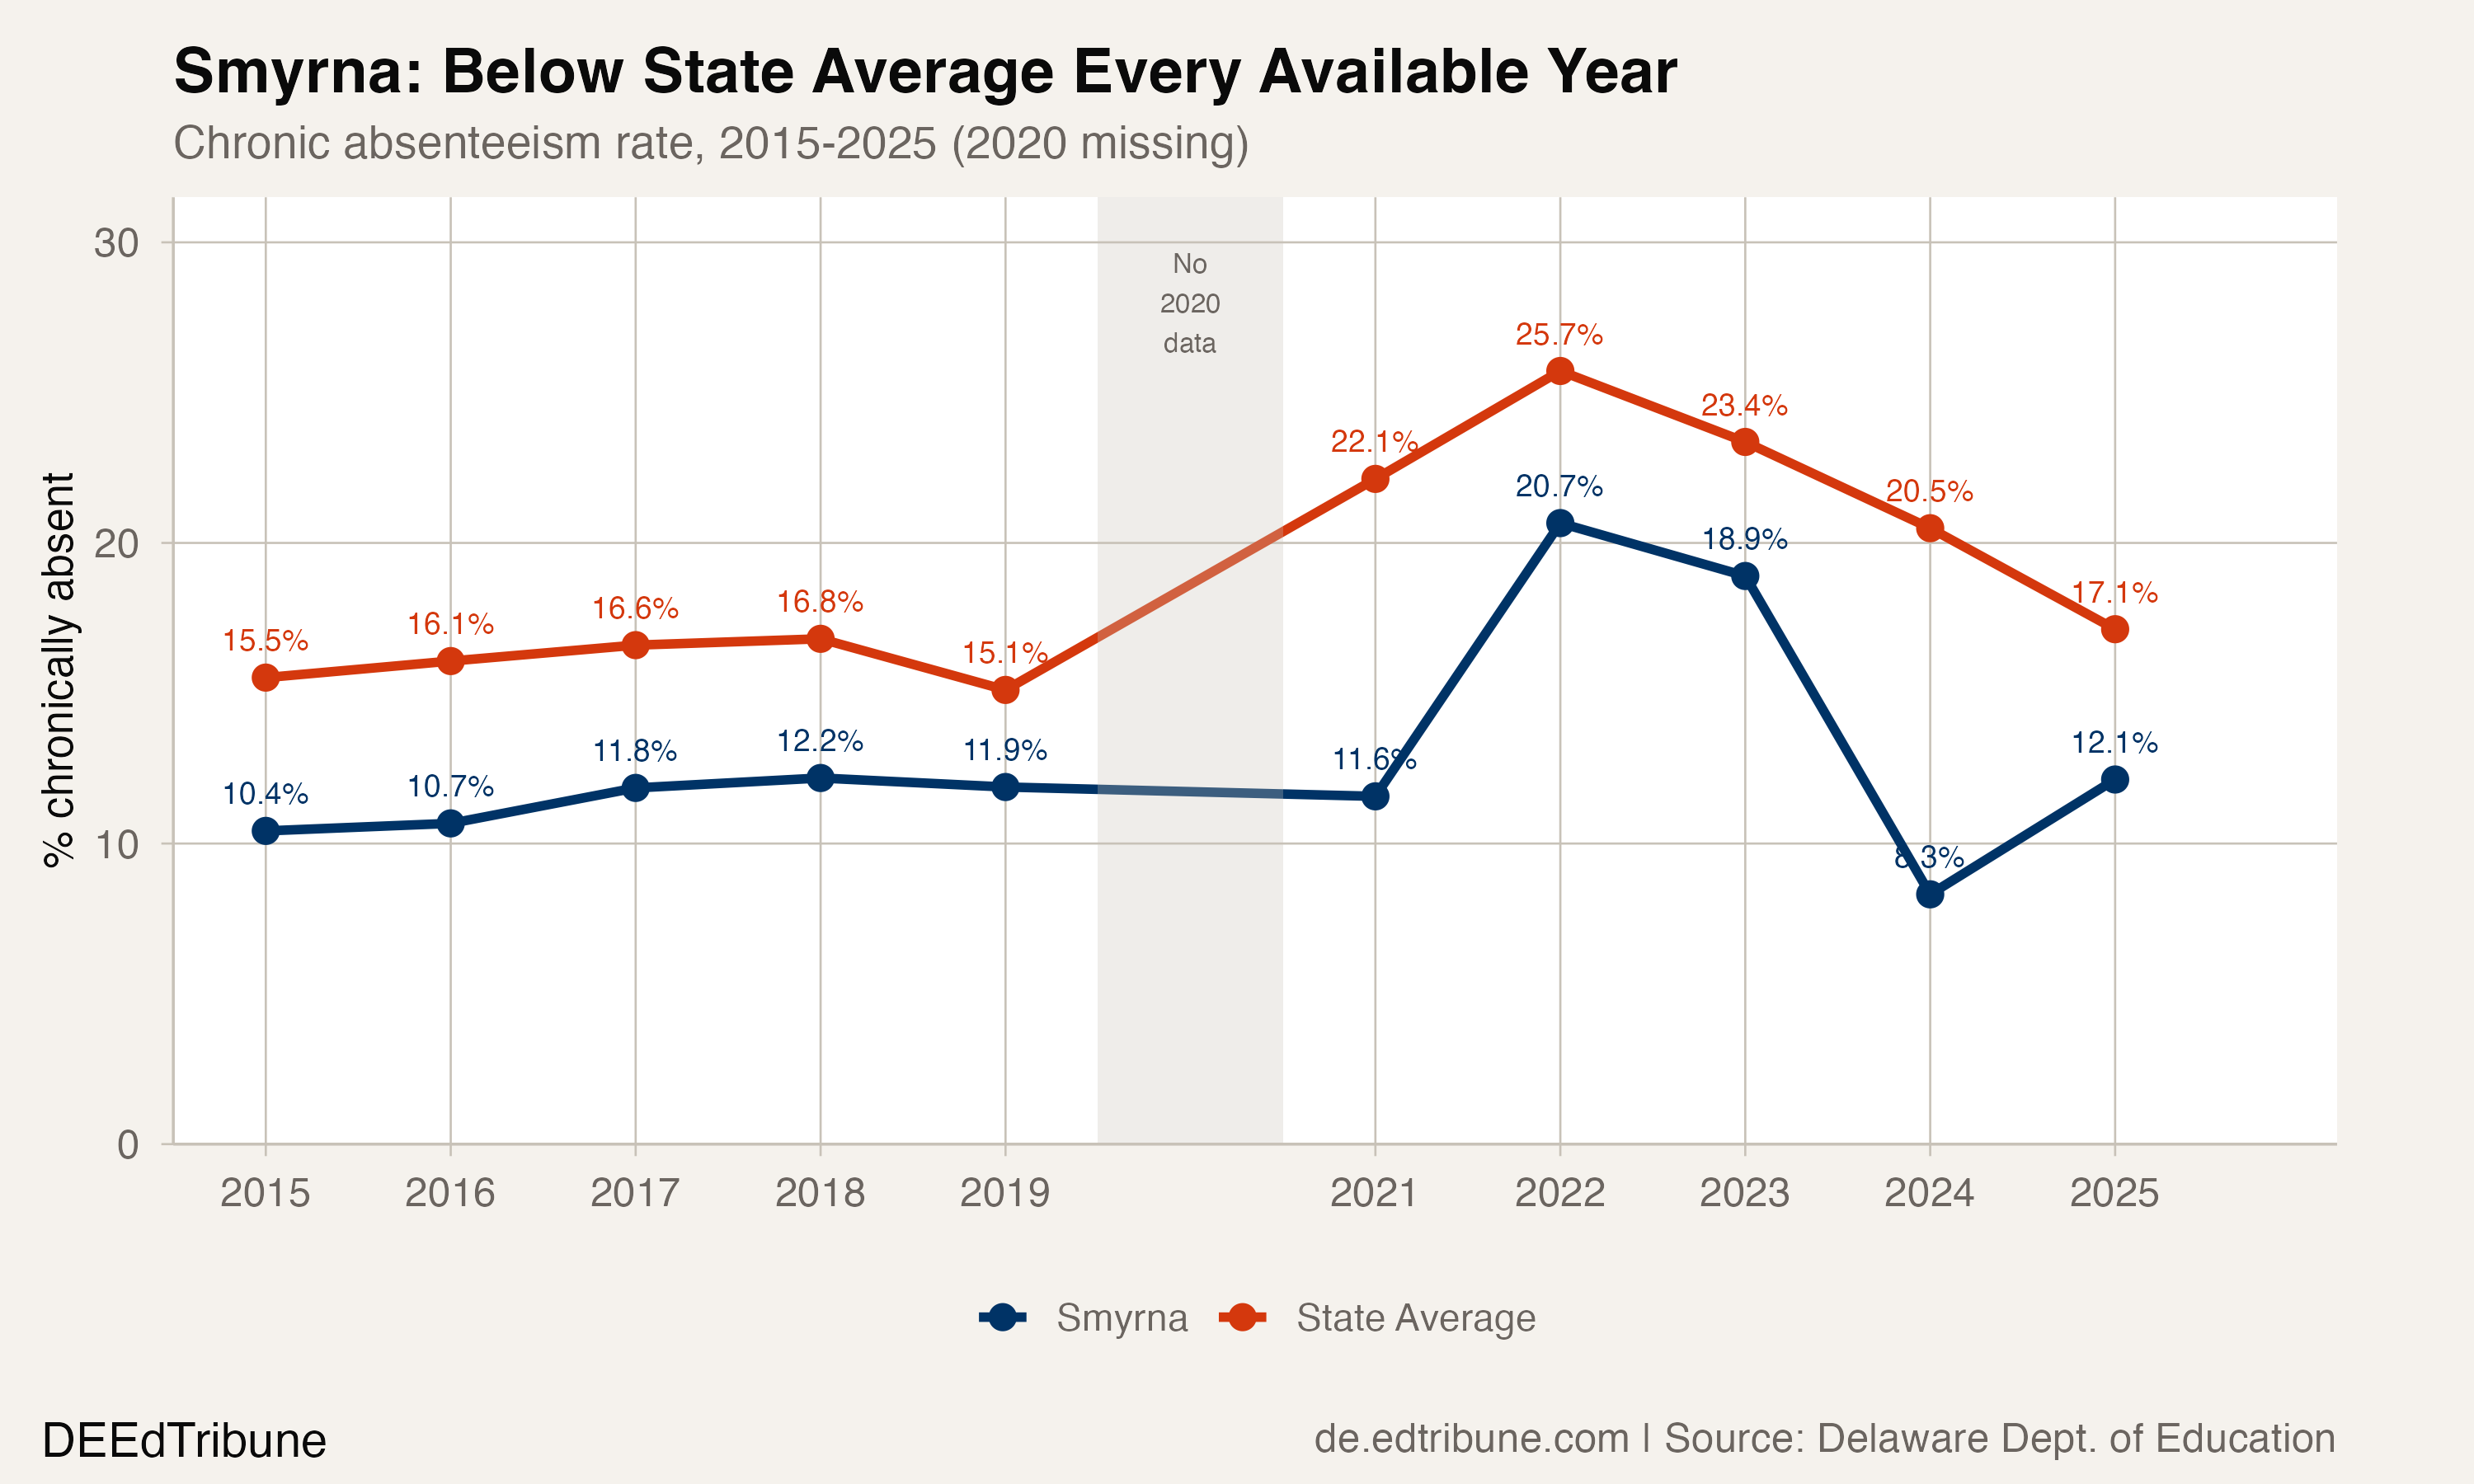
Then COVID scrambled attendance patterns, and Smyrna's advantage expanded. In 2020-21, the district recorded 11.6% against a statewide 22.1%, a 10.6-point gap and the first double-digit Smyrna-state gap in the dataset.
The 2023-24 year produced an even more striking result: 8.3%, the lowest rate in the district's decade of data and 12.2 points below the state average. That number warrants some caution. The rebound to 12.1% in 2024-25 leaves competing explanations: 2024 may have been anomalously good, or 2025 may have brought a genuine, modest deterioration. Either way, Smyrna's 2025 rate remains close to its pre-COVID baseline of 11.9%. The district had clawed back 97.2% of its COVID-era spike, compared to 81.0% statewide.
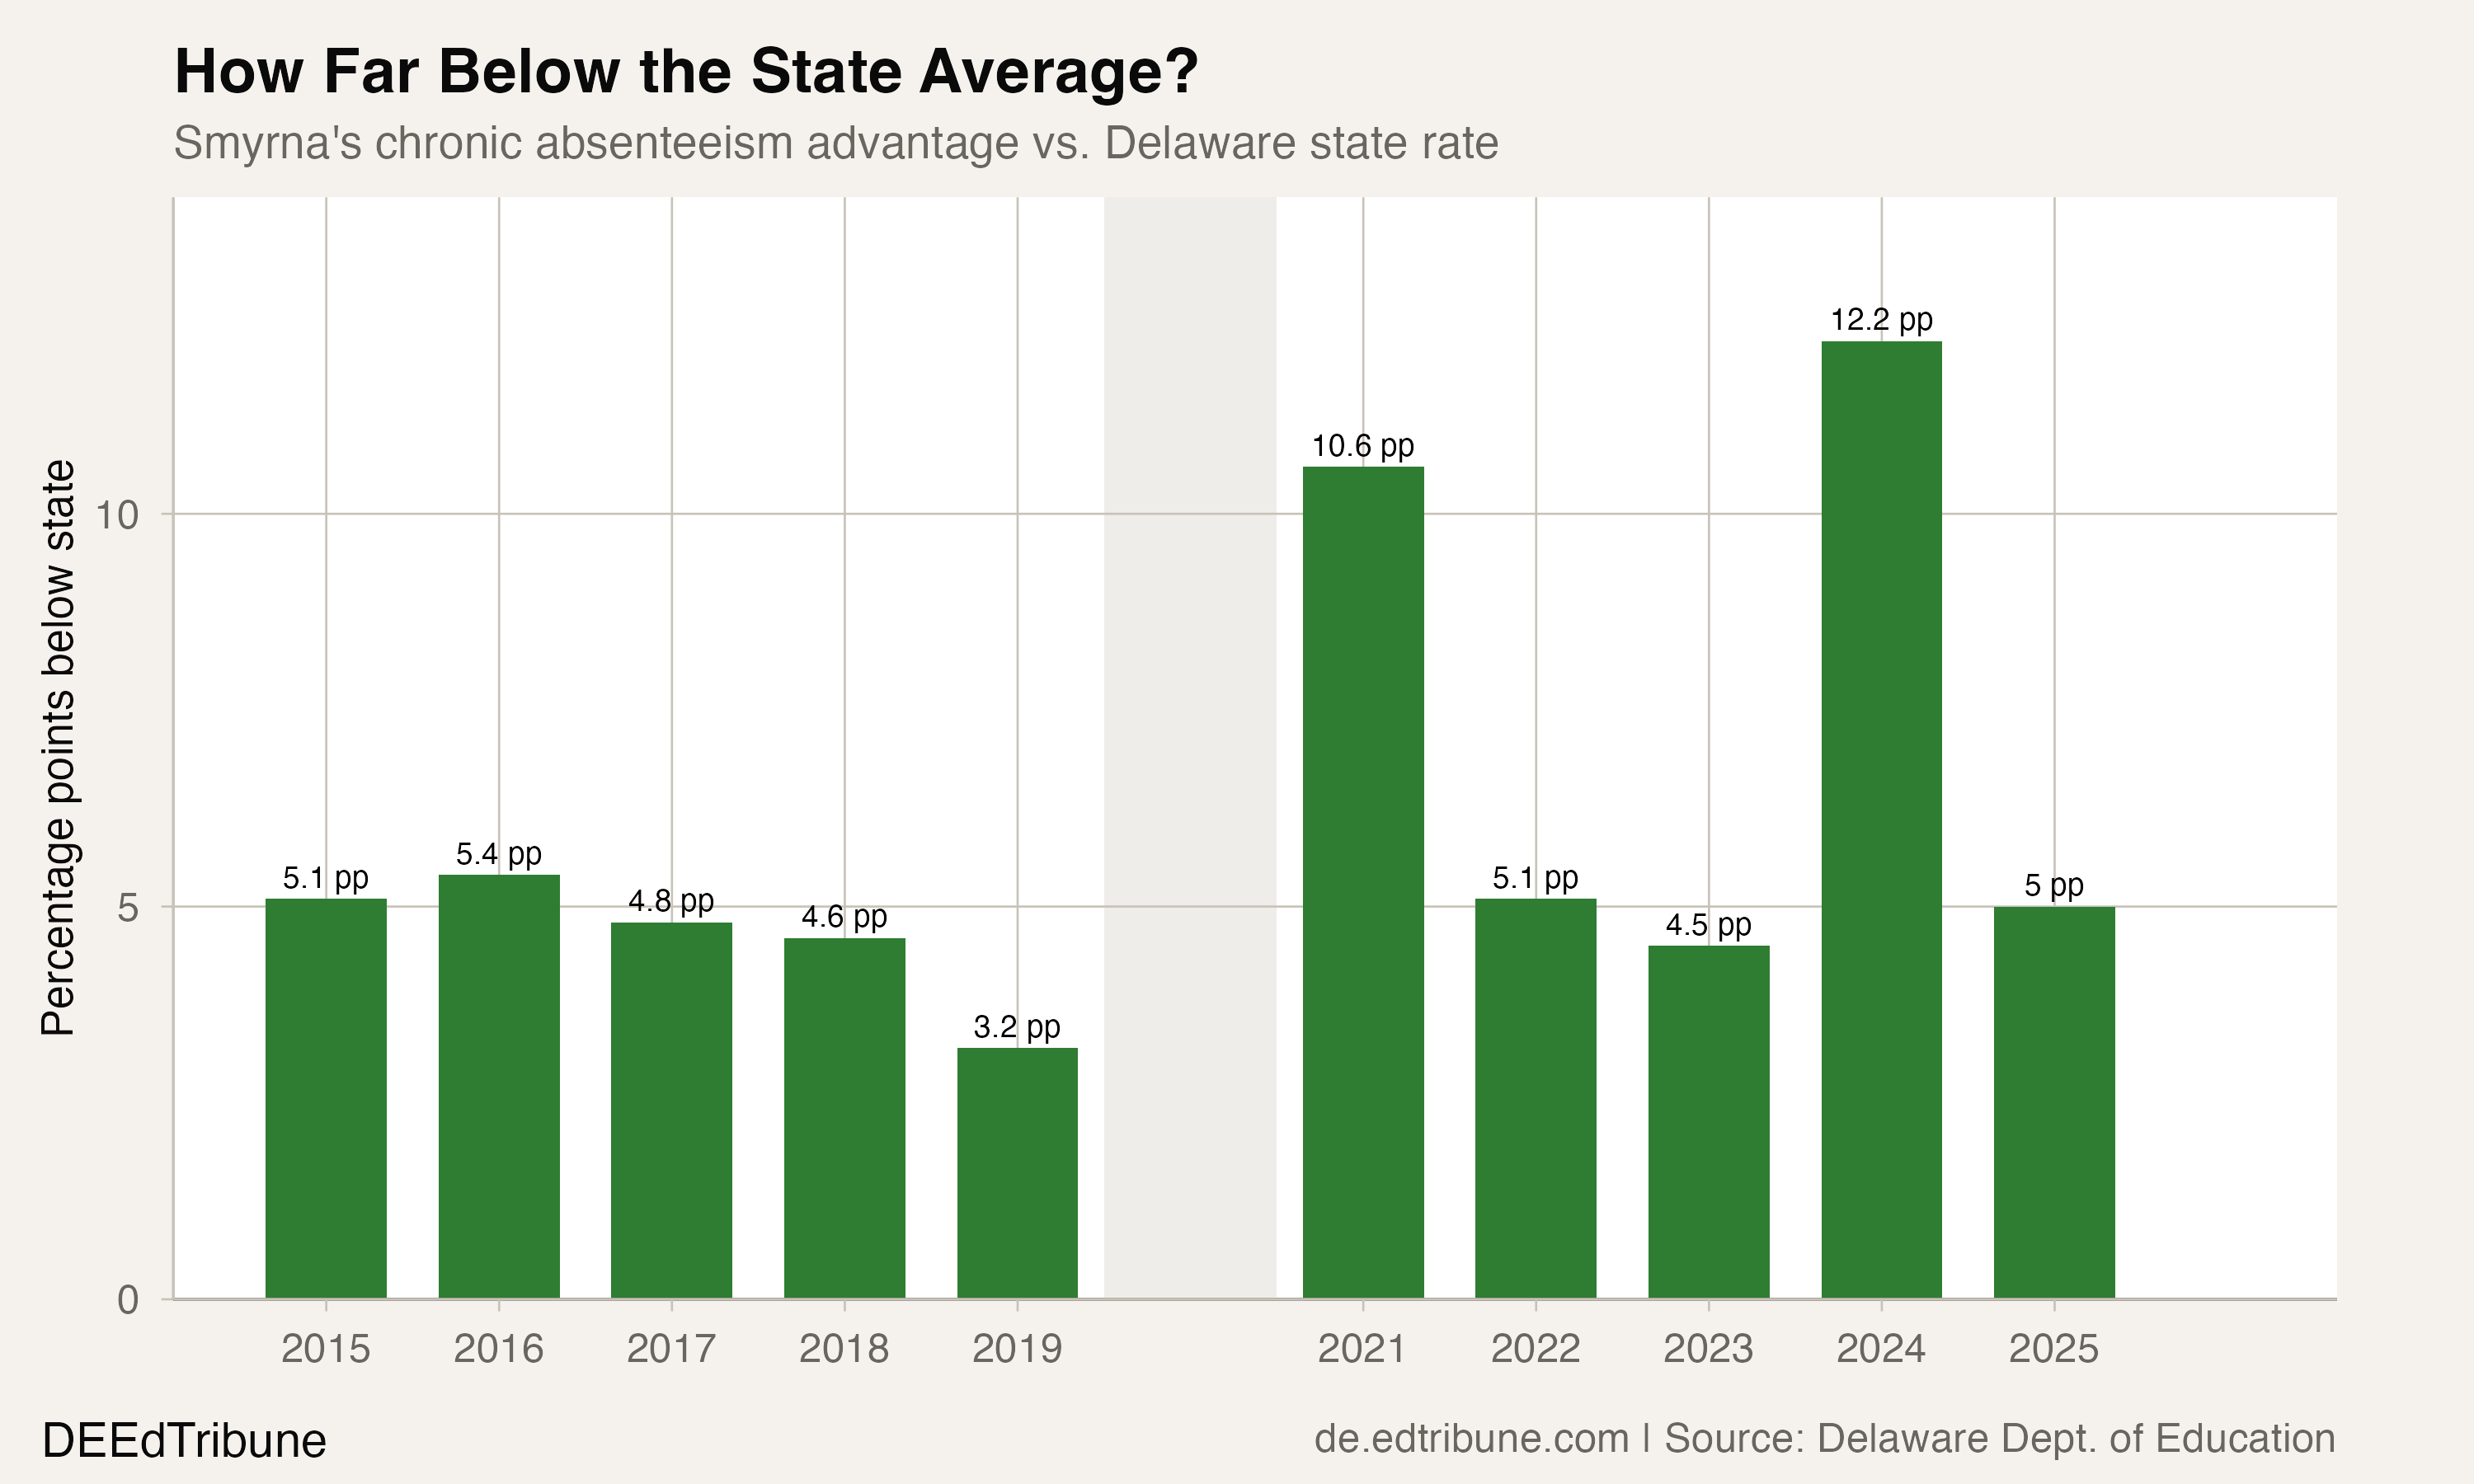
Over the full decade, Smyrna has averaged a 12.9% chronic absenteeism rate. The state has averaged 18.9%. That 6.0 percentage-point average gap translates to roughly 363 fewer students missing significant school time in an average year than what would be expected at statewide rates.
Where Smyrna sits among peers
Among Delaware district-level entities serving at least 5,000 students, Smyrna had the lowest chronic absenteeism rate in 2024-25. The contrast with nearby systems is pointed: Caesar Rodney posted 18.0%. Capital School District posted 26.1%, compared with Smyrna's 12.1%.
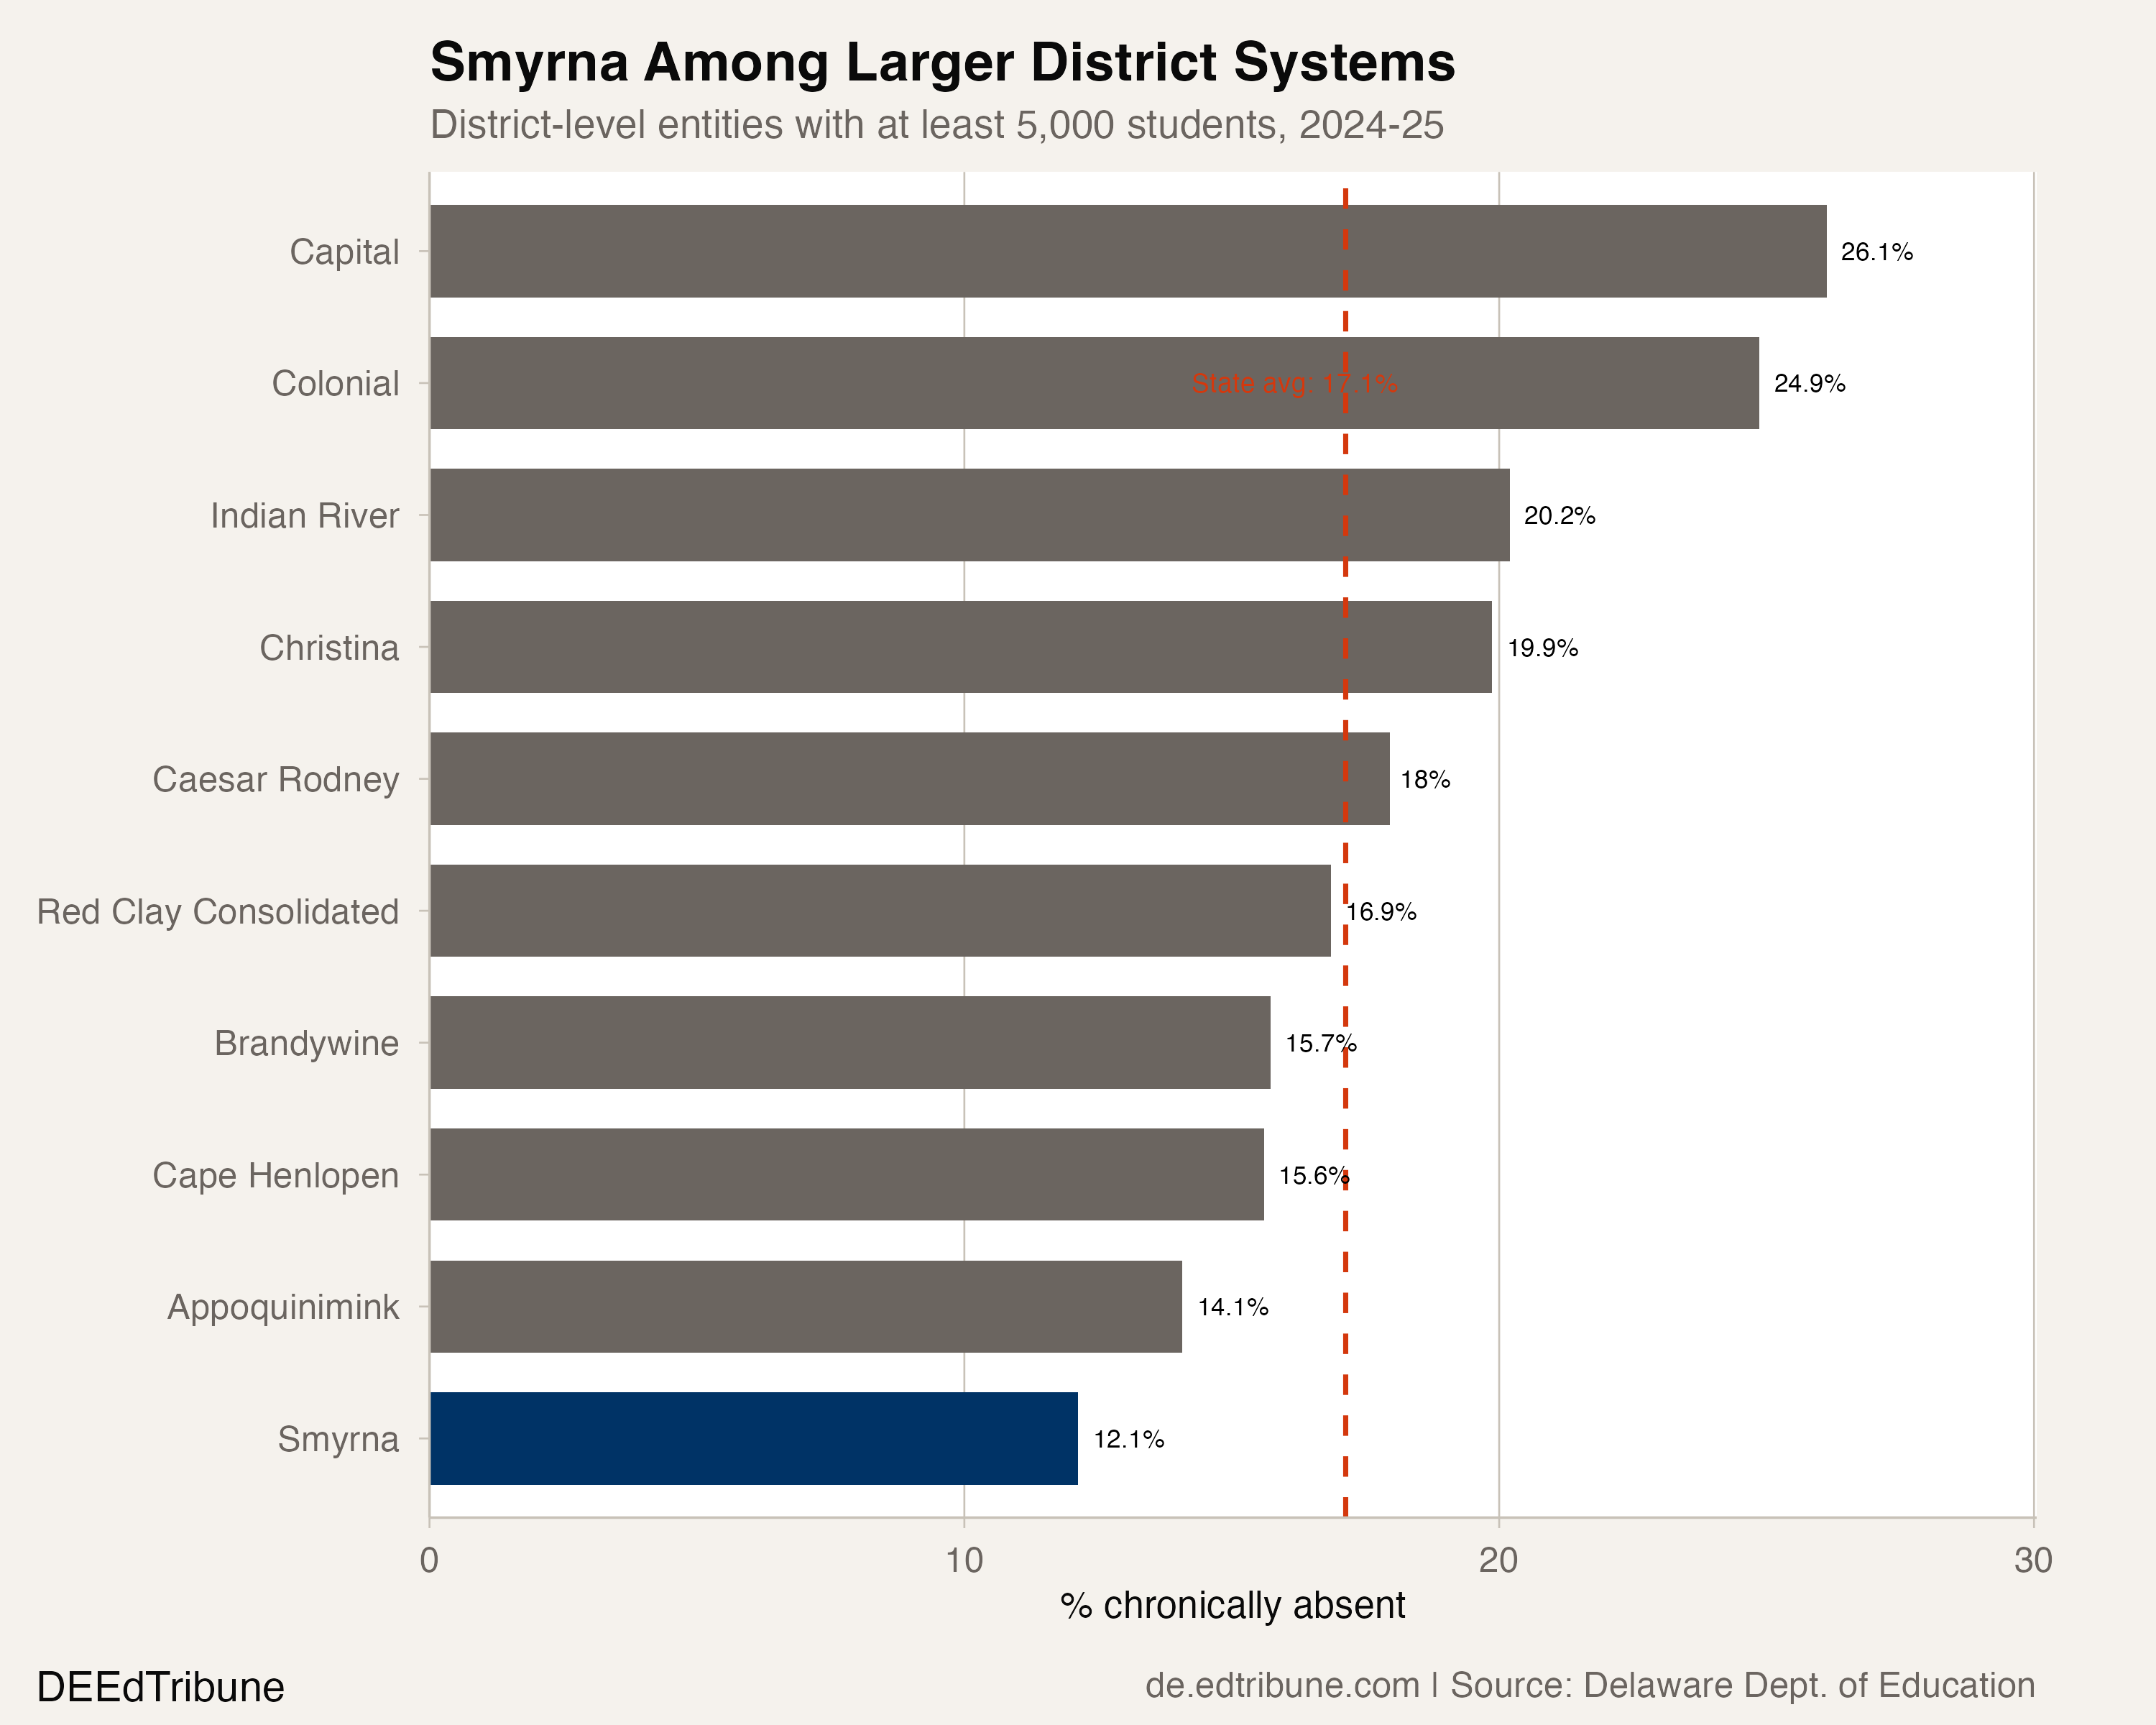
The peer gap matters because Smyrna is not a small specialty program. The district serves a growing town: the U.S. Census Bureau estimated Smyrna at 13,340 residents on July 1, 2025, up 3.5% from the 2020 estimates base of 12,885. New housing developments continue to reshape the area. In September 2025, Delaware Public Media reported that a Route 13 mixed-use project would bring a projected 152 new housing units to town.
Every subgroup, below the line
Smyrna's outperformance is not driven by a single demographic slice. In 2024-25, the district was below the state average in all 17 reported subgroups with Smyrna and statewide data.
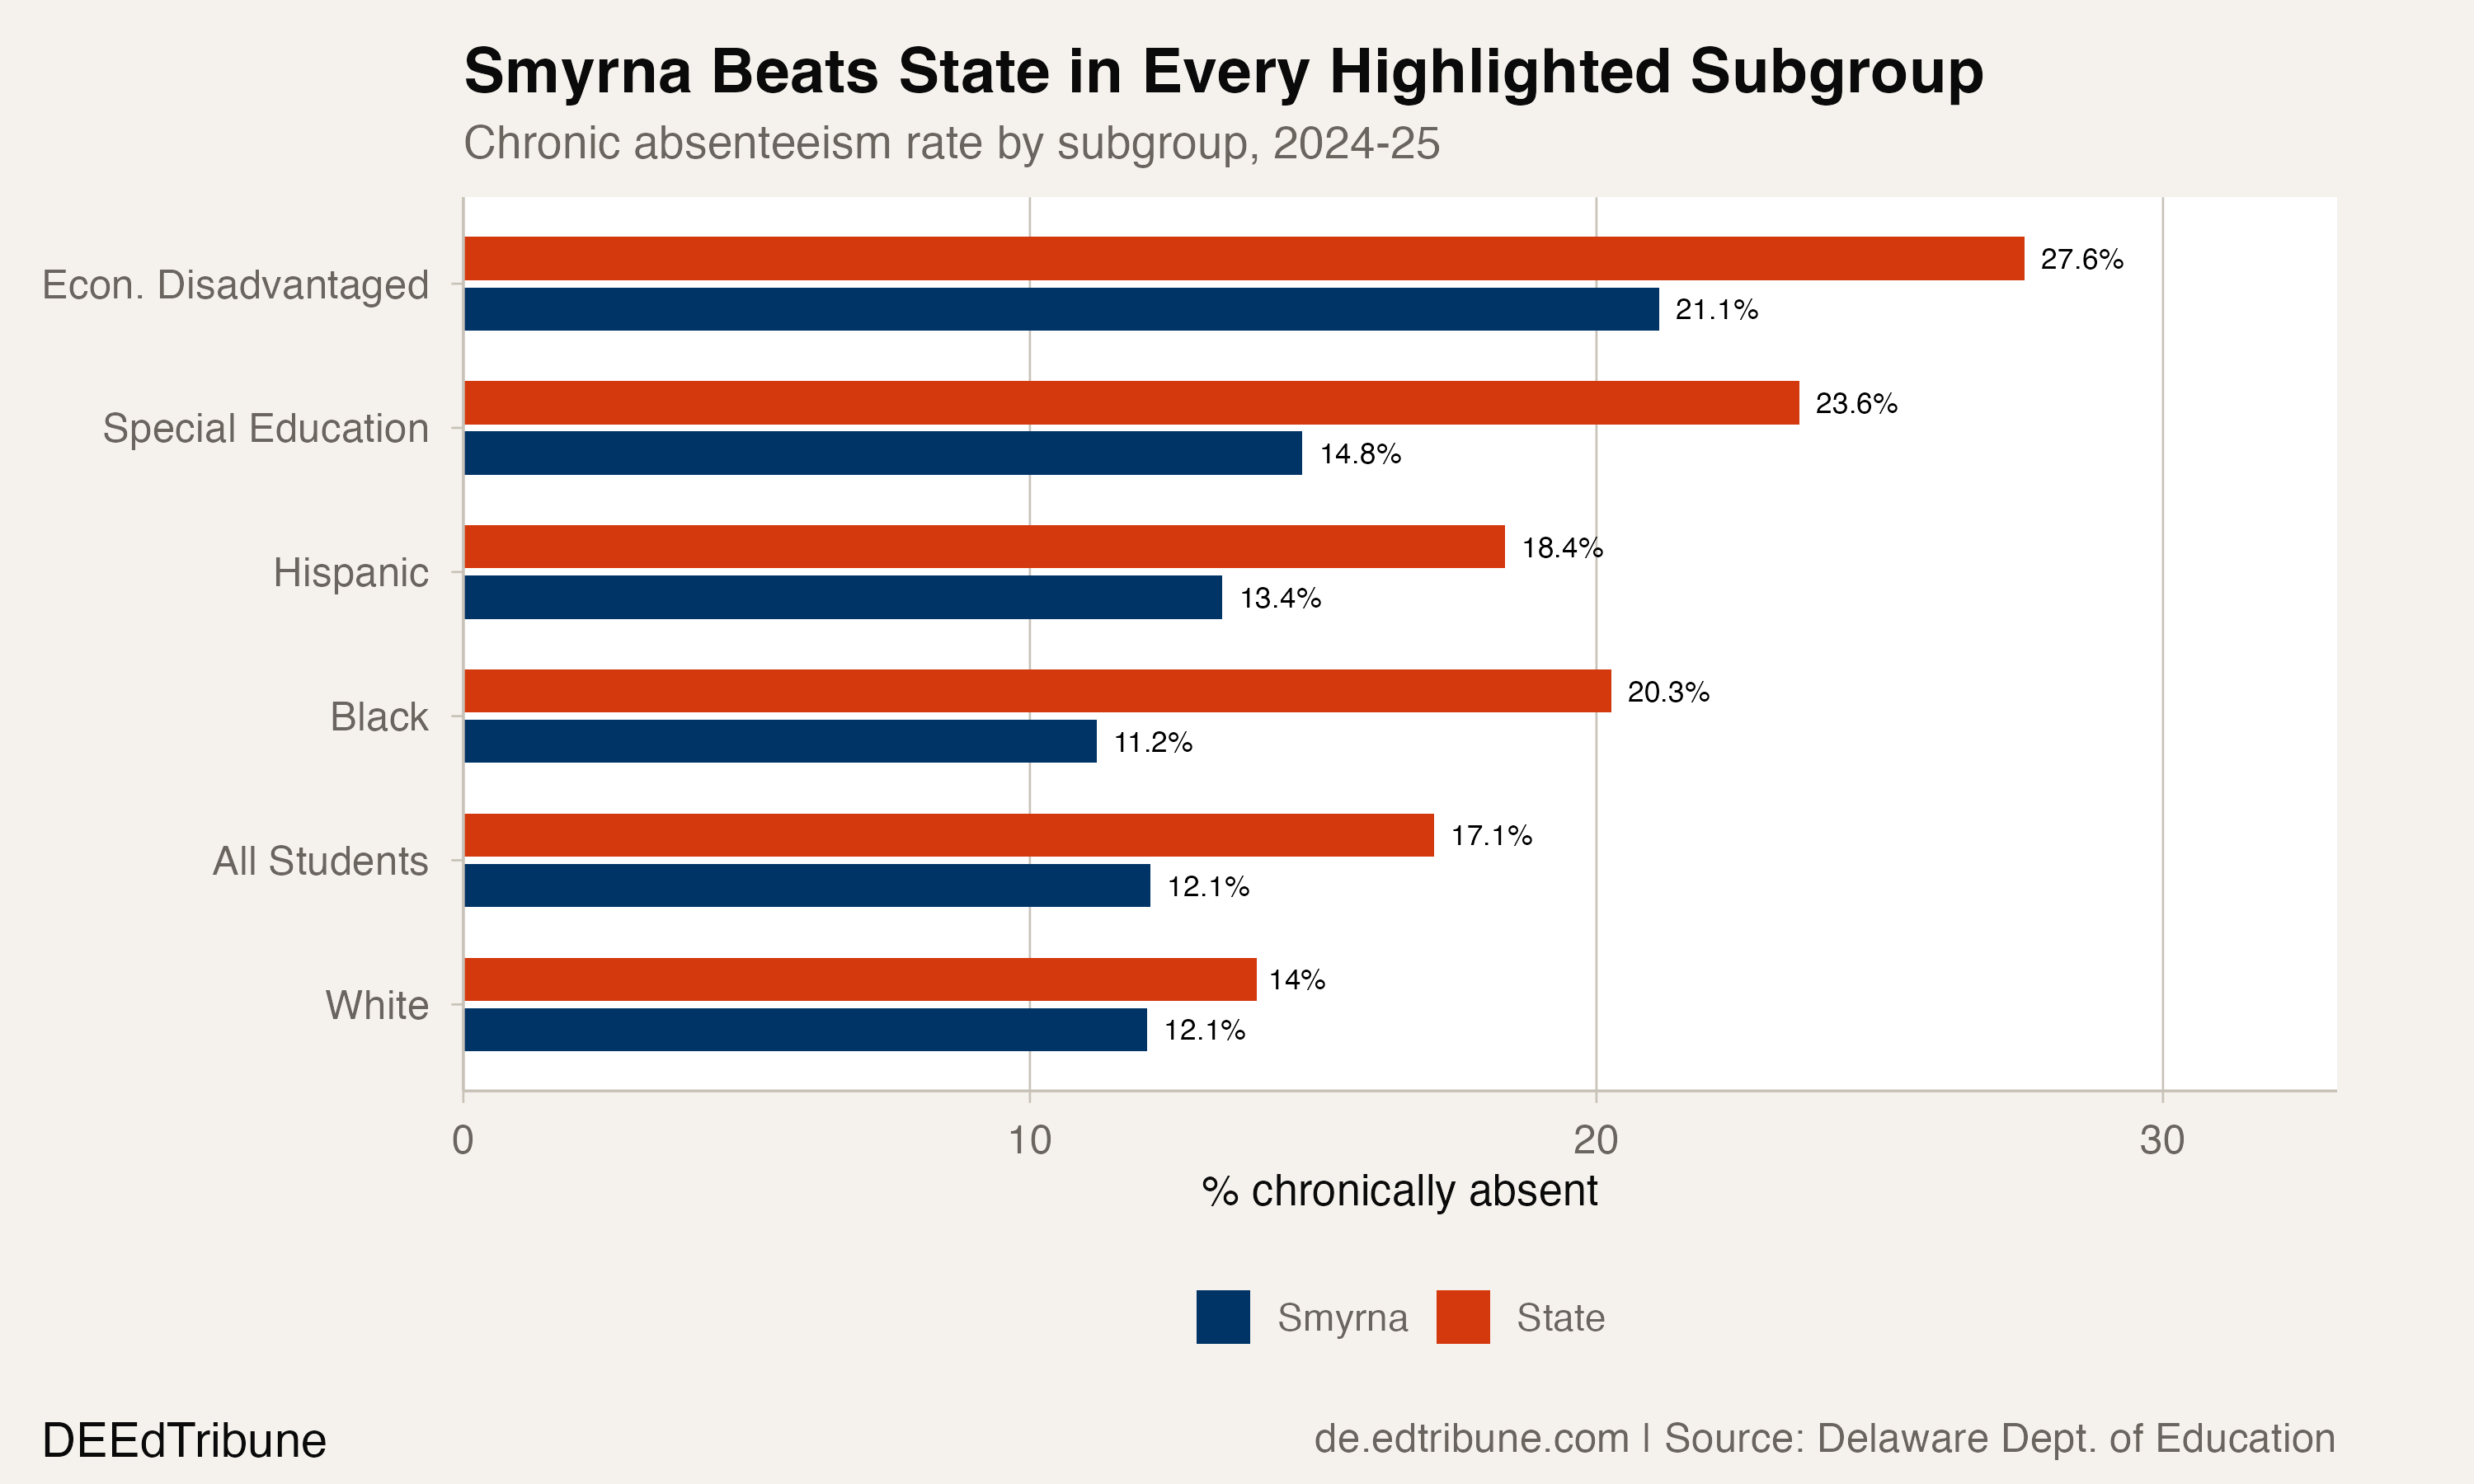
Among the highlighted student groups, the widest gaps appear where chronic absenteeism is most severe statewide. Black students in Smyrna posted an 11.2% chronic absenteeism rate, compared to 20.3% statewide, a 9.1 percentage-point difference. Special education students: 14.8% versus 23.6%, an 8.8-point gap. Economically disadvantaged students: 21.1% versus 27.6%, a 6.4-point gap.
These are not small differences, and they have widened since 2019. Before COVID, Smyrna's Black student gap was 6.9 points below the state; by 2025, it had grown to 9.1 points. The economically disadvantaged gap expanded from 3.8 to 6.4 points. The district did not merely maintain its advantage through the pandemic. It extended it.
One caveat: Smyrna's economically disadvantaged rate of 21.1% is still the highest rate among the highlighted subgroup categories, and it has barely budged from its pre-COVID level of 20.8%. That is direct evidence that the district-level recovery did not reach that subgroup in the same way. Economically disadvantaged students in Smyrna are doing much better than their statewide peers, but they are not doing better than they were before the pandemic.
Inside the schools
Smyrna High School produced the district's largest post-2022 improvement. In 2021-22, 34.3% of its 1,846 students were chronically absent, the worst building in the district. By 2024-25, the rate had fallen to 11.4% across 1,871 students, a 22.9 percentage-point drop. That improvement accounts for 72.3% of the district's post-COVID reduction in chronically absent students.
Smyrna Middle School followed a similar trajectory, falling from 17.5% in 2022 to 12.3% in 2025. Clayton Elementary and Clayton Intermediate were at 8.5% and 8.6%, solidly below the district average.
One building is moving in the wrong direction. Smyrna Elementary School posted a 31.0% chronic absenteeism rate in 2024-25, up from 18.4% in 2022 and 5.6% in 2019. With 400 students, it is not large enough to drag the district total above the state average. But a rate that has risen more than fivefold in six years, while every other building improved, is a pattern that invites scrutiny. The data does not reveal whether this reflects a change in the school's student population, a reporting artifact, or a genuine attendance crisis confined to one building.
Leadership change in a growing community
As of July 2026, Smyrna's district contacts list Mrs. Deborah Judy as superintendent. The attendance pattern predates the current administration: the package data show Smyrna below the state average in every available year from 2015 through 2025.
That is suggestive context, not direct evidence, for a durable district practice or community pattern. The data show continuity in outcomes across leadership changes; they do not identify the cause.
The mechanism behind this consistency is unresourced. No public source reviewed for this article identifies a specific Smyrna attendance intervention that explains the decade-long pattern. Competing explanations include school-level practice, family behavior, community stability, attendance-reporting differences, or some combination of those factors.
Delaware's funding formula offers one structural note. The Delaware Department of Education says the annual student count includes students who were enrolled and in attendance during the last ten school days of September and is often called unit count. That is suggestive context only: it means the state's base funding count is not an average-daily-attendance system, but it does not explain why Smyrna's chronic-absence rates stayed below the state average.
What the data cannot explain
Smyrna Elementary's 31% rate is the clearest signal that the district's story is not uniformly positive. A building that was at 5.6% in 2019 and is now the district's worst performer by a wide margin deserves its own investigation. The district-level average obscures this deterioration entirely.
The 2024 dip to 8.3% and subsequent rebound to 12.1% also raises questions. A 3.8 percentage-point swing in a single year, in both directions, could reflect real changes in student behavior or shifts in how absences were counted or reported. Those are competing explanations; the data available does not distinguish between them.
A remaining question is whether Smyrna can hold its position as the community grows. New housing means new families, new students, and a shifting demographic profile. The district's enrollment has averaged 5,987 students across the decade of absence data. If the development cited above and other projects bring meaningful population growth, that would put new pressure on the attendance culture that has sustained a decade of consistency.
Detailed code that reproduces the analysis and figures in this article is available exclusively to EdTribune subscribers.
Discussion
Sign in to join the discussion.
Loading comments...