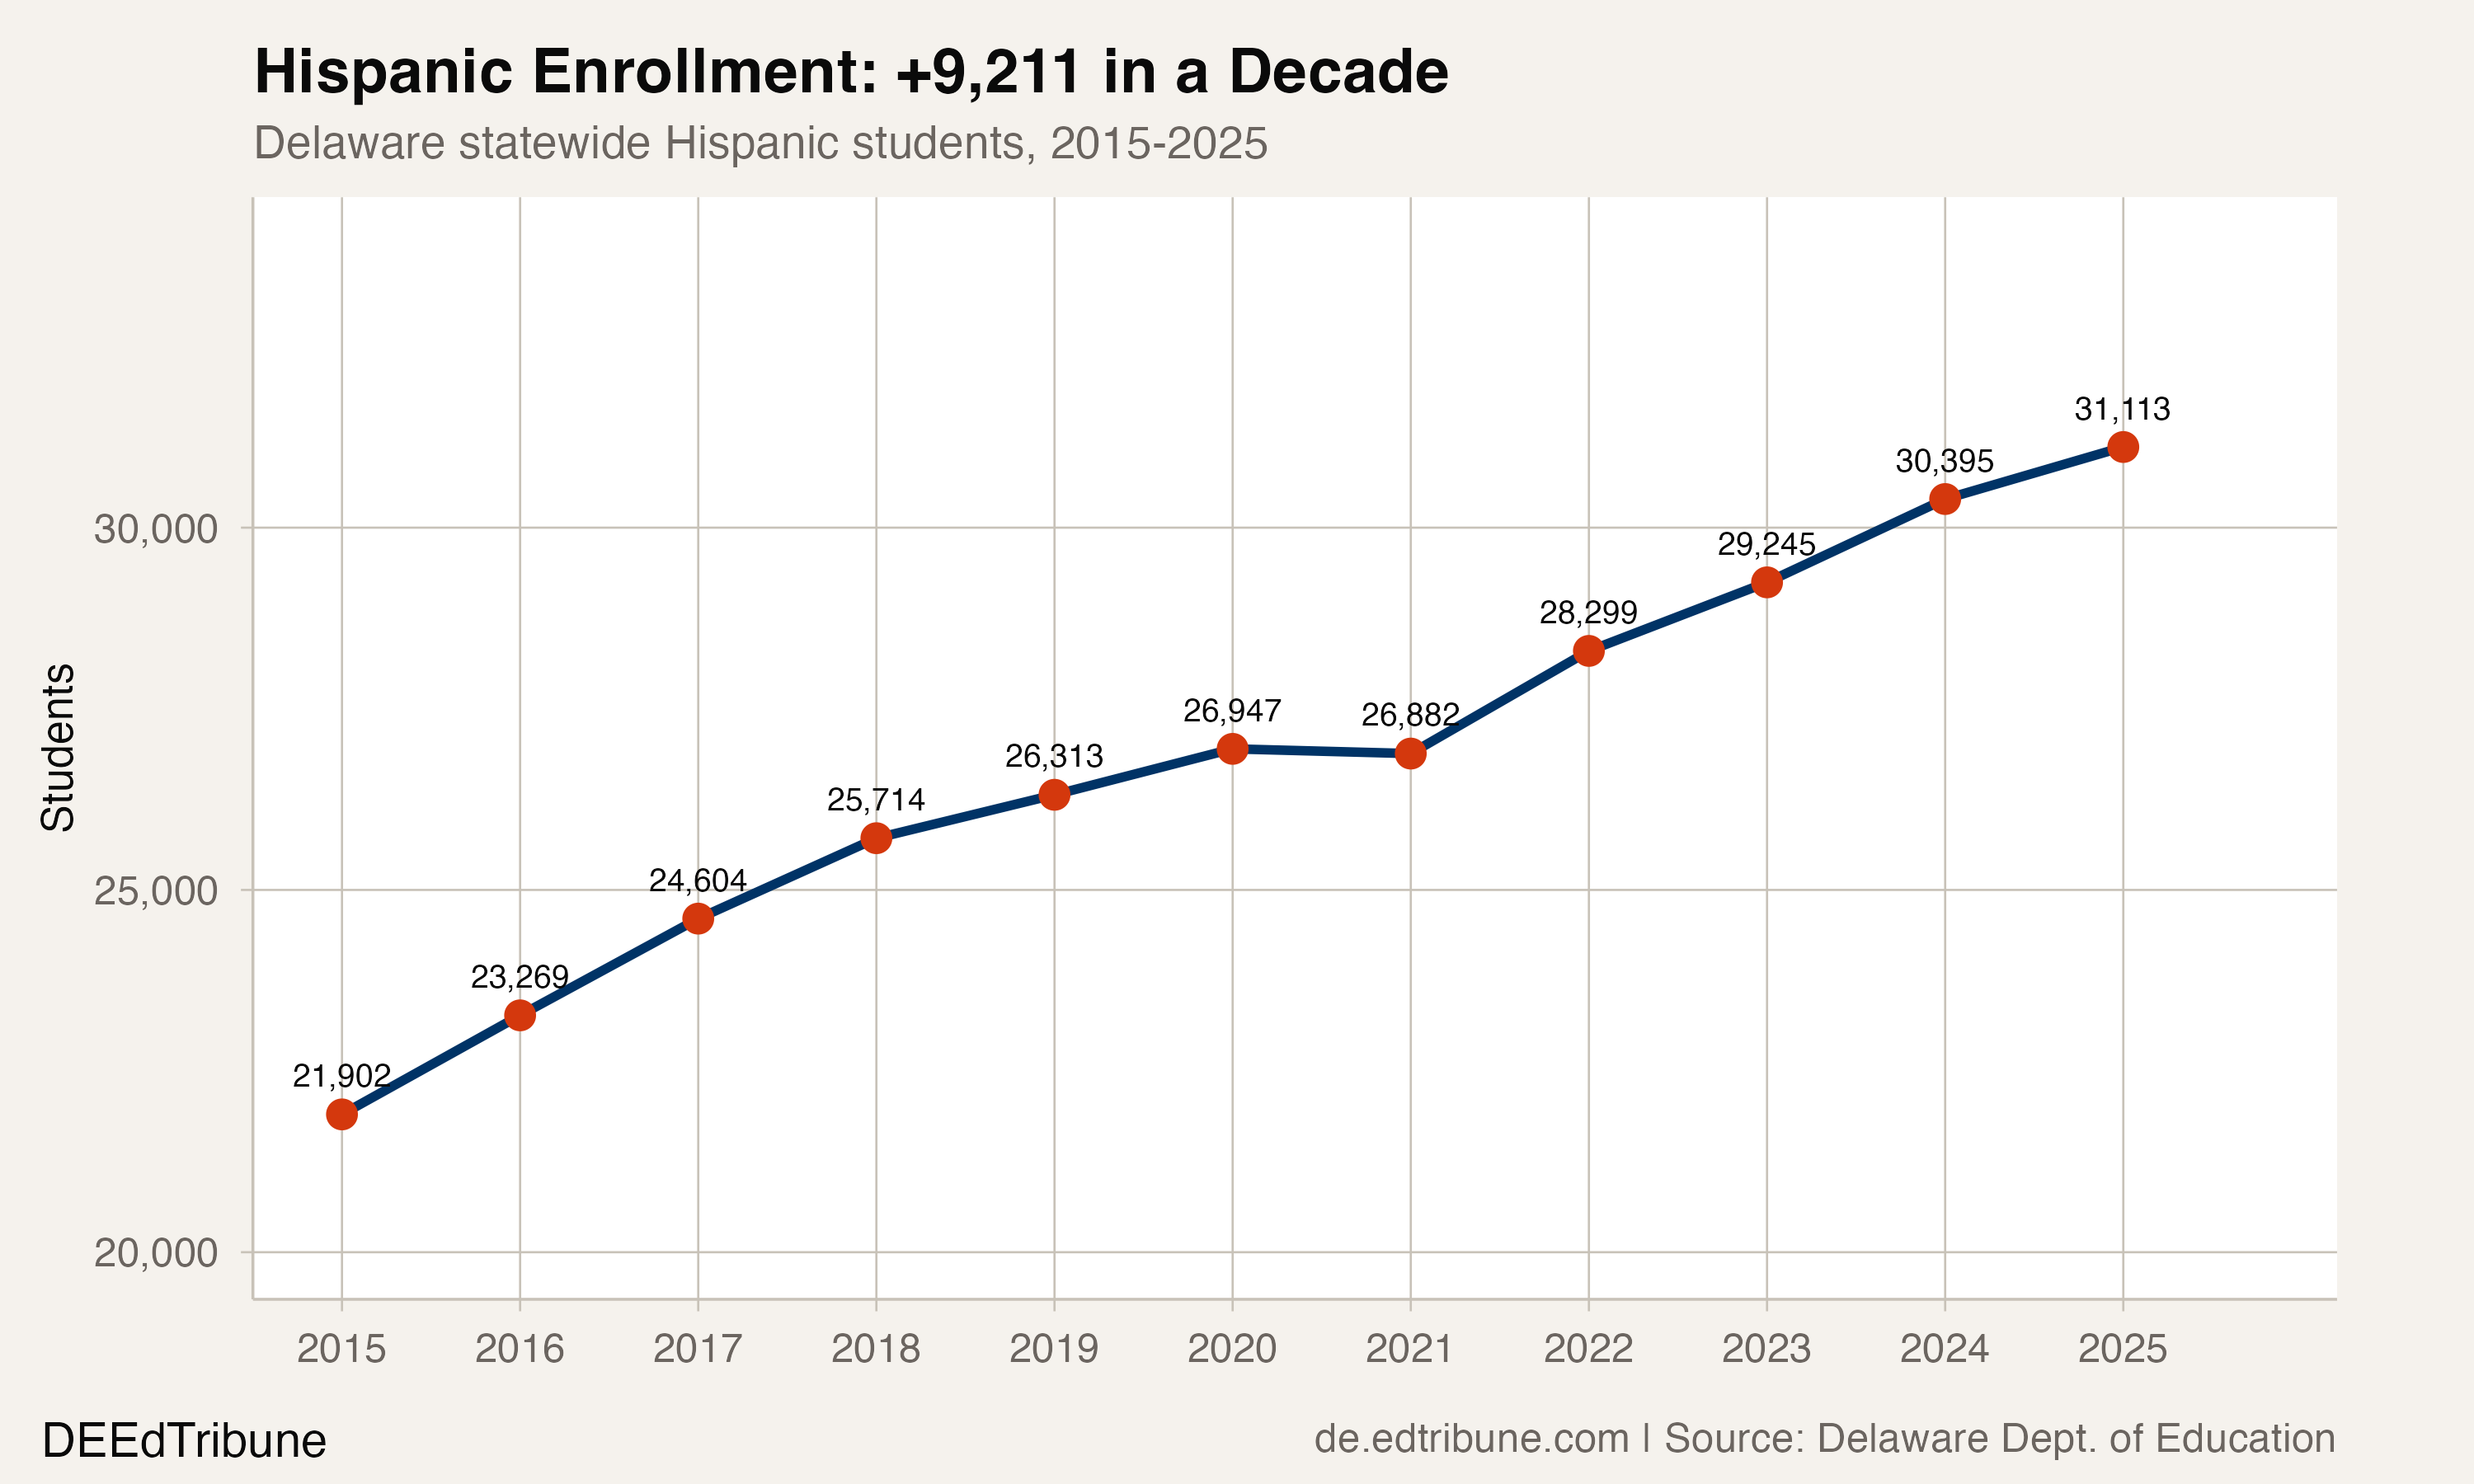
In 2015, about one in six Delaware public school students was Hispanic. By 2025, it was one in five. That shift, from 21,480 to 31,113 students, represents a 44.8% increase and the addition of 9,633 students to the state's rolls. The gain exceeds the total enrollment of 33 of Delaware's 39 districts.
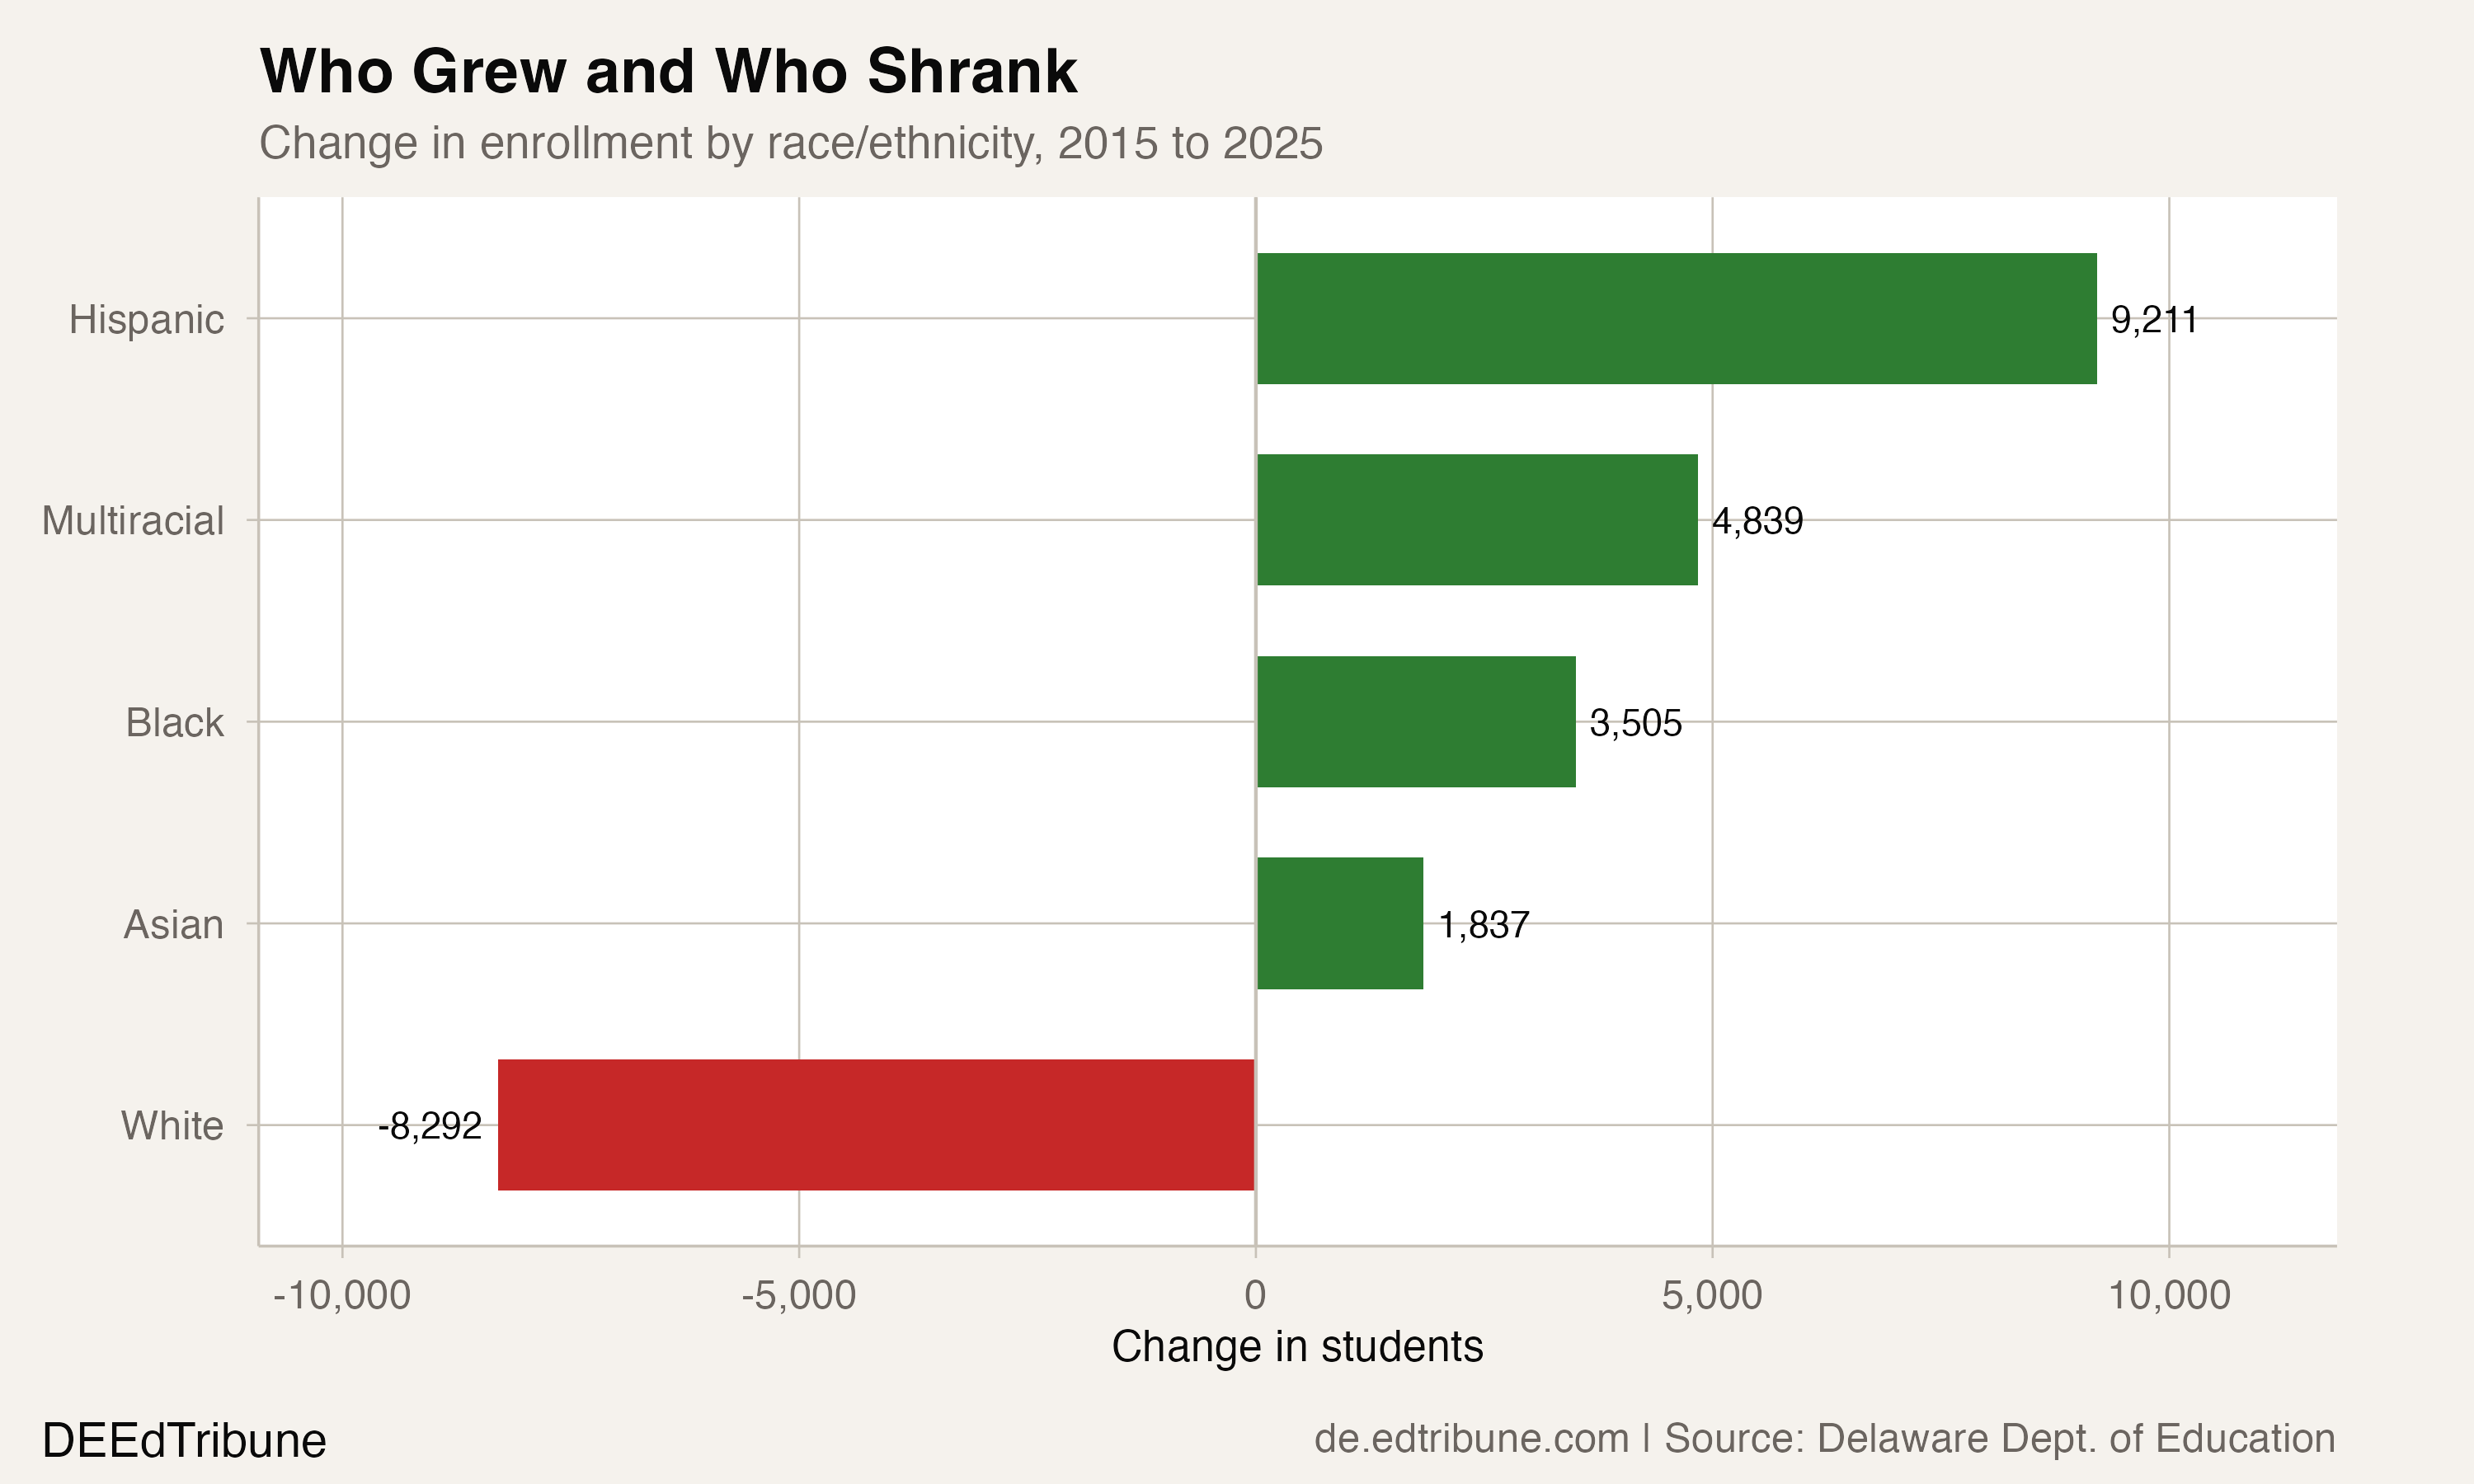
More striking: Hispanic students accounted for 83.4% of Delaware's net enrollment growth over the decade. Without them, the state would have added just 1,913 students instead of 11,546. White enrollment fell by 7,217 over the same period. Hispanic growth did not merely contribute to Delaware's enrollment trajectory. It is the trajectory.
A state remade from the bottom of the map
The growth is statewide, but the epicenter is Sussex County. In the rural districts of southern Delaware, where poultry processing plants and agricultural operations have drawn immigrant families for three decades, the demographic transformation of the student body has accelerated.
Laurel↗ET went from 10.6% Hispanic in 2015 to 30.5% in 2025. Seaford↗ET made a nearly identical leap, from 15.3% to 30.8%. Indian River↗ET, the largest Sussex County district with nearly 11,900 students, is now 38.5% Hispanic, up from 29.6% a decade ago. These are not suburban districts absorbing spillover from a growing city. They are small-town school systems where the student body has fundamentally changed composition within a single generation of students.
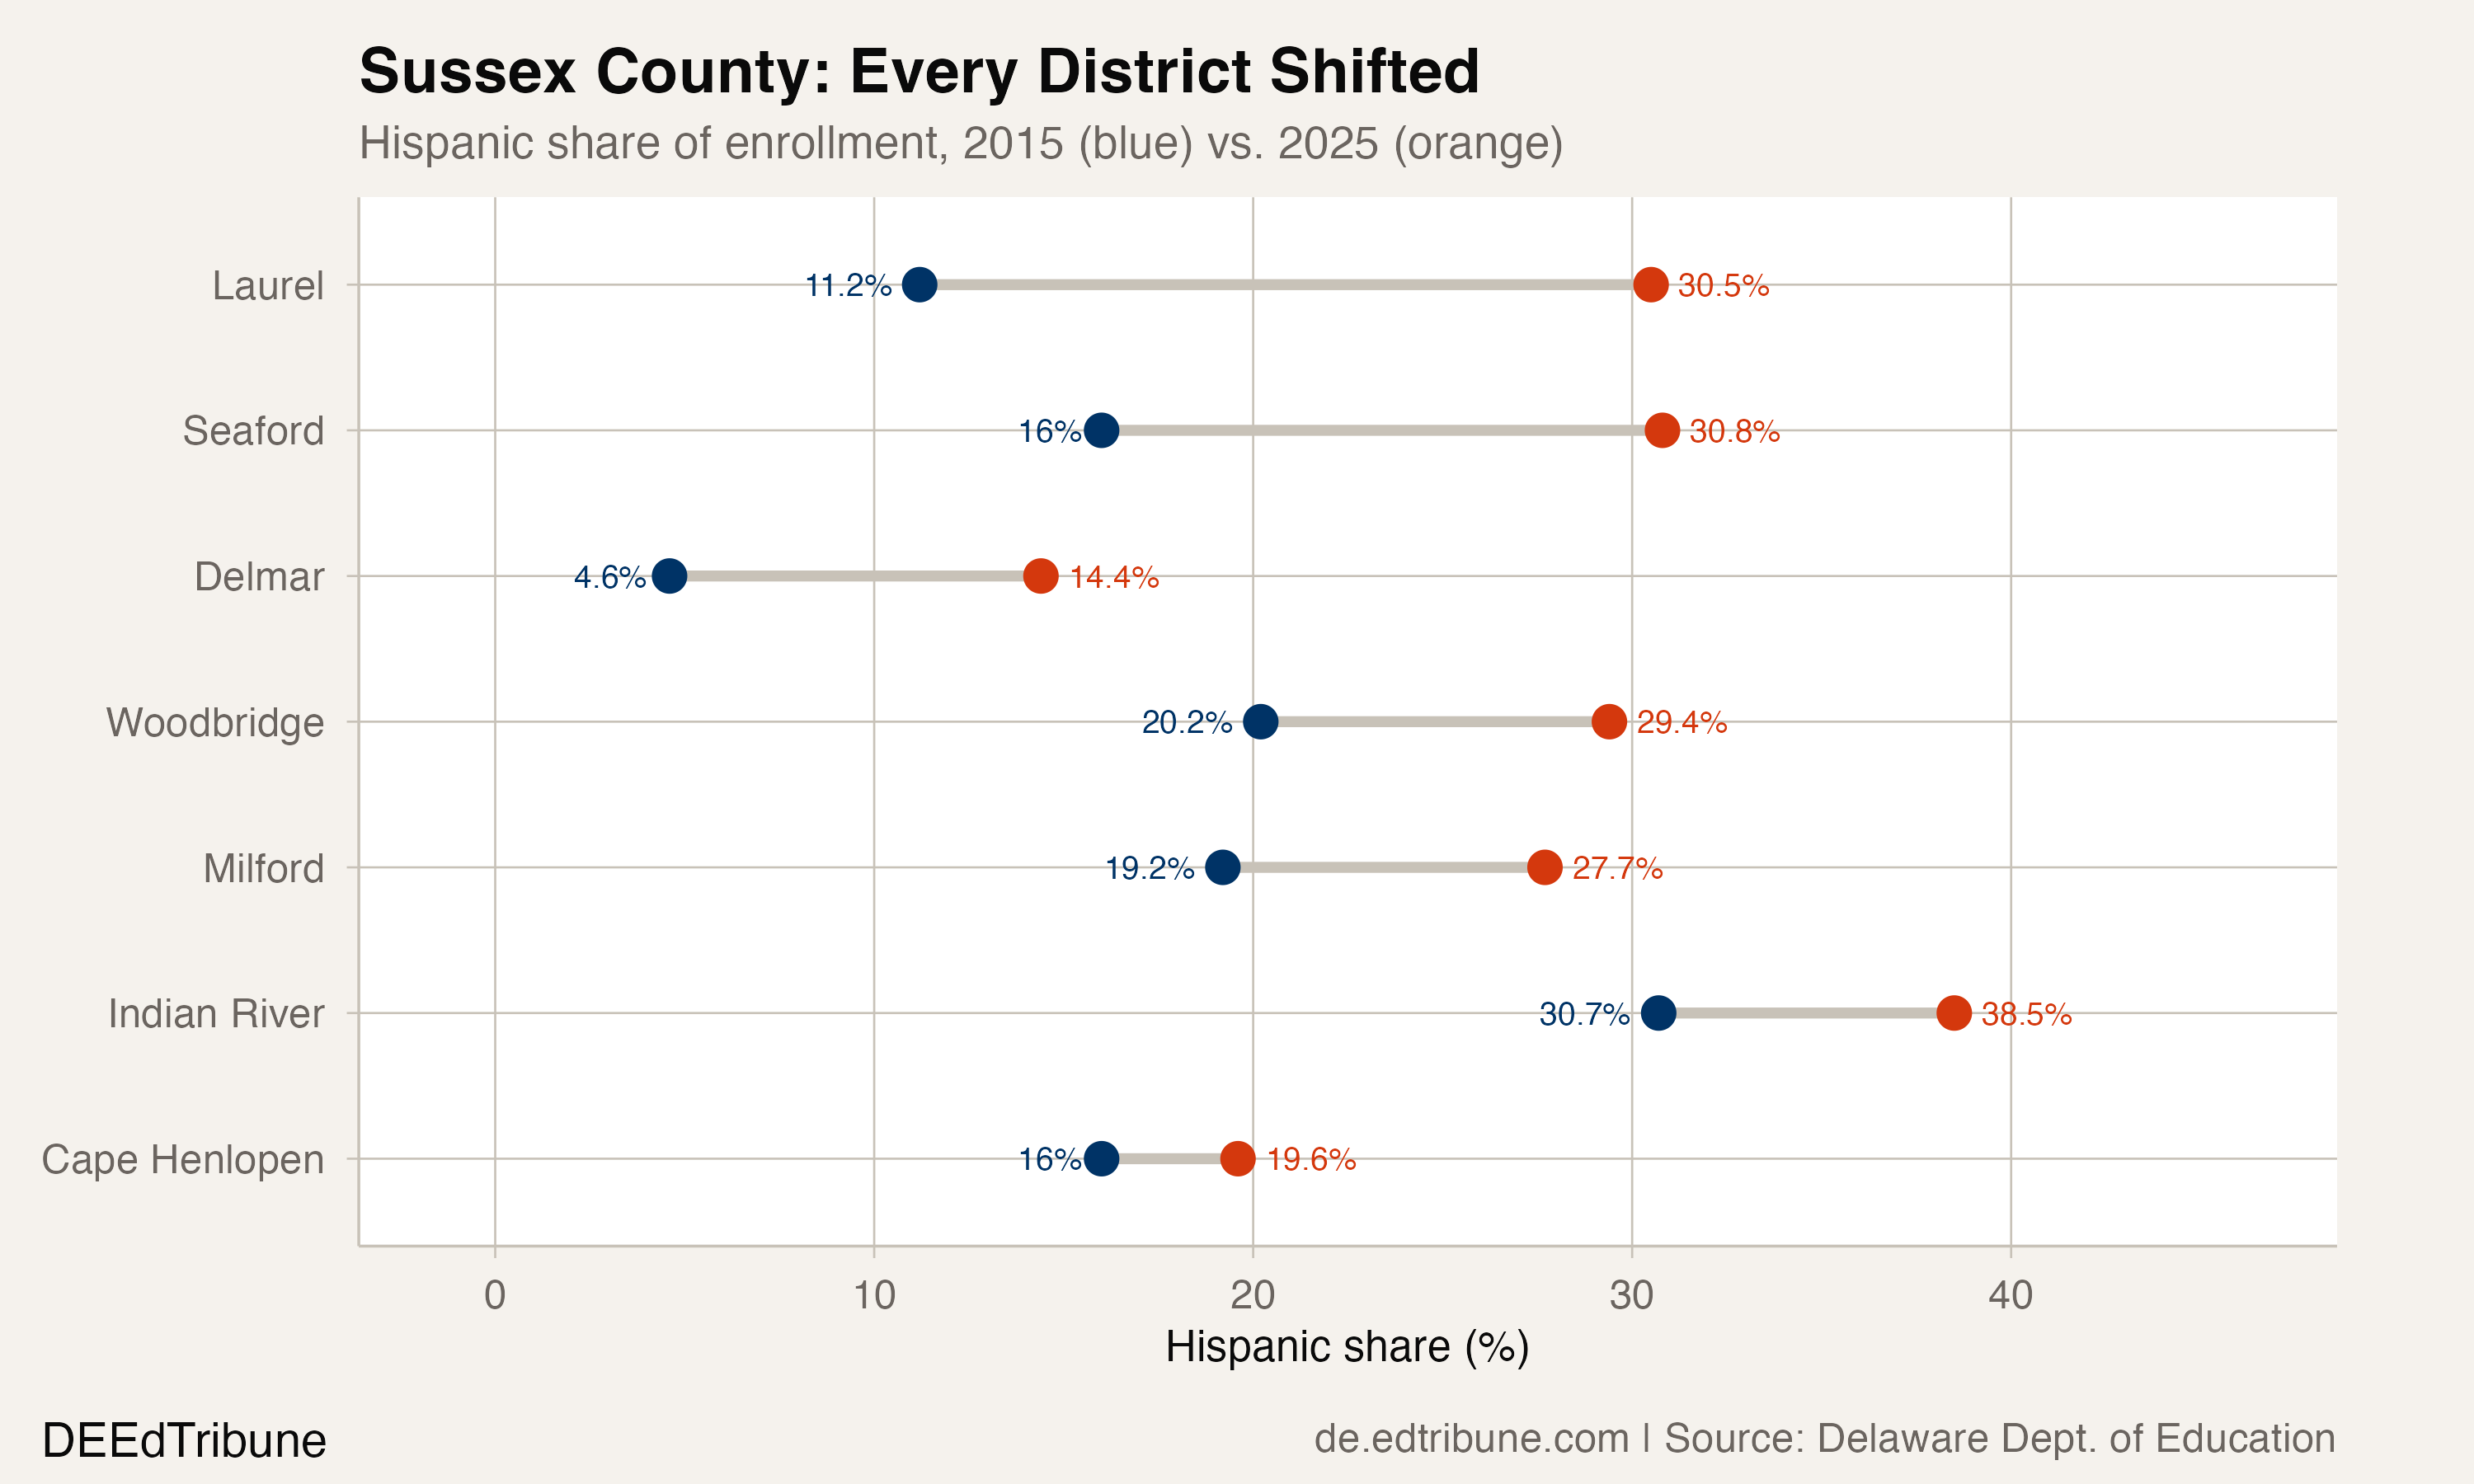
Woodbridge↗ET crossed from 19.9% to 29.4%. Milford↗ET went from 18.3% to 27.7%. Even Delmar↗ET, a tiny district straddling the Maryland border, nearly quadrupled its Hispanic share from 3.7% to 14.4%. Every traditional district in Sussex County saw its Hispanic enrollment share rise by at least 3.6 percentage points.
The pattern is different in New Castle County, where growth has been more incremental. Appoquinimink↗ET, a fast-growing suburban district, more than doubled its Hispanic enrollment from 595 to 1,396, but the share rose only from 6.1% to 10.3% because overall enrollment also expanded. Christina↗ET, once among the state's largest Hispanic-serving districts, is the only traditional district in the state where Hispanic enrollment actually fell, dropping by 7 students over the decade.
Who grew and who shrank
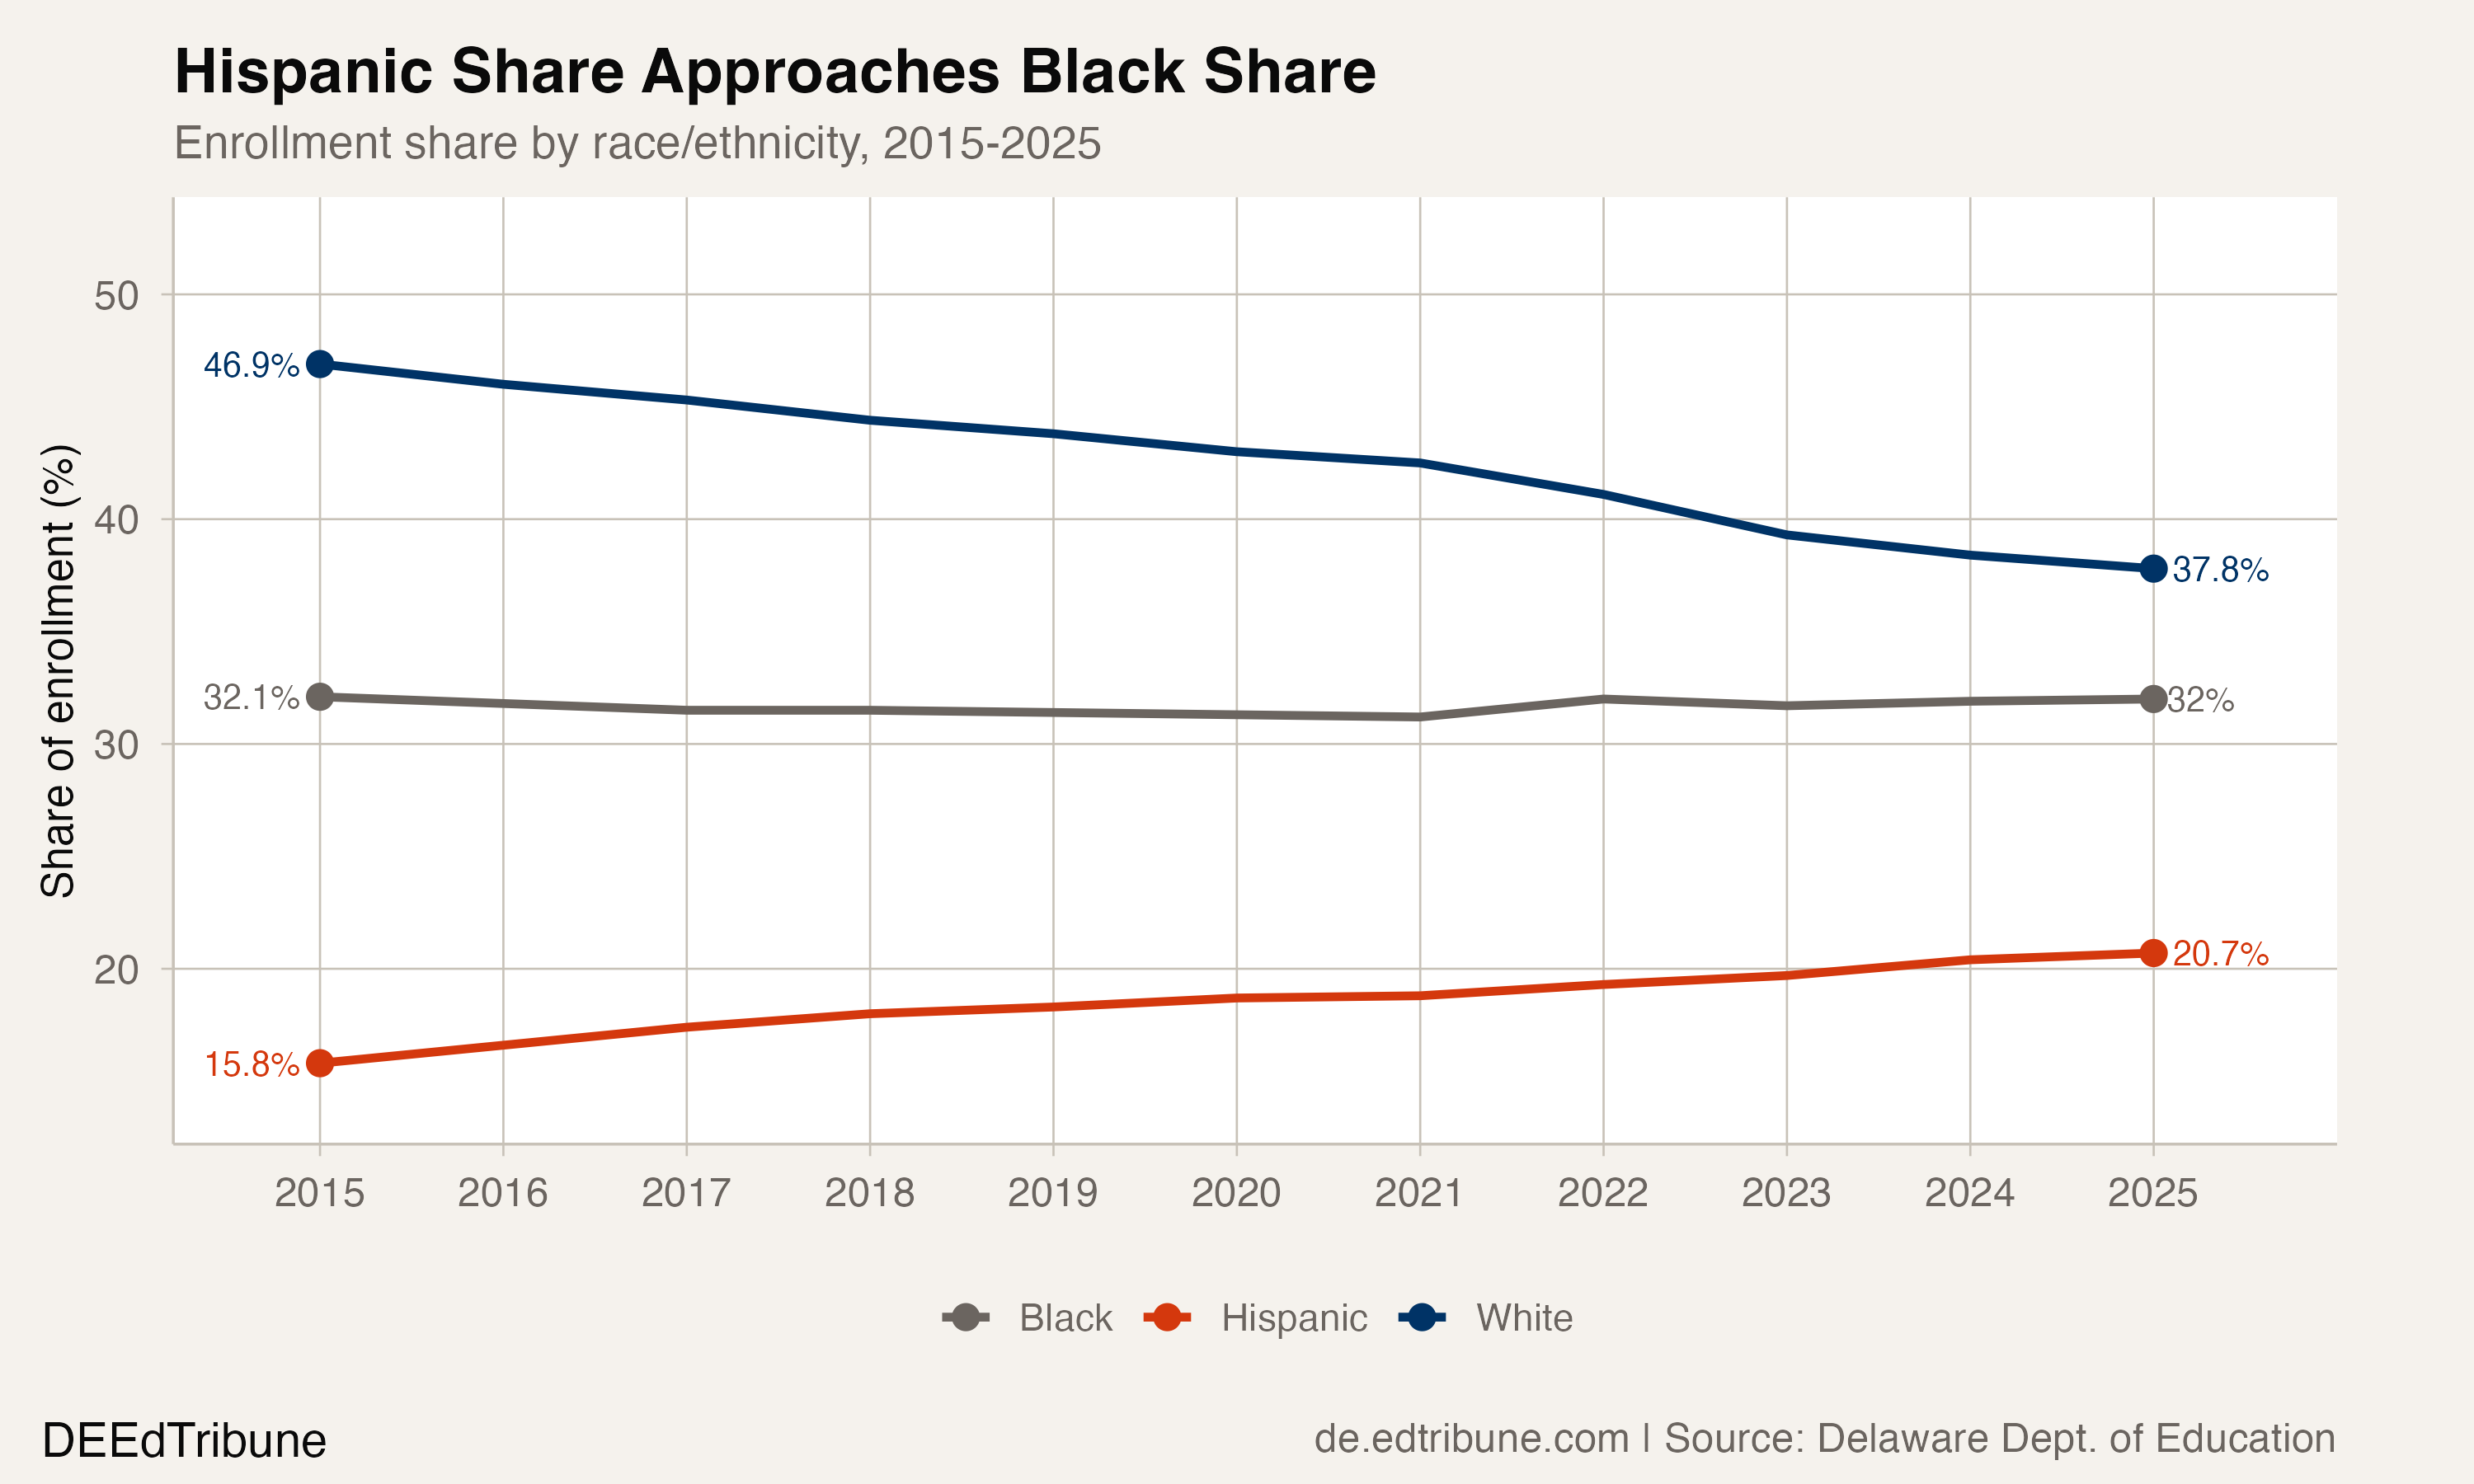
The racial composition of Delaware's schools has shifted on every axis since 2015. White enrollment declined by 7,217 students, an 11.3% drop that pulled the white share from 46.1% to 37.8%. Black enrollment grew modestly, adding 4,139 students while holding nearly flat at 32.0% of the total. Multiracial students more than doubled, from 4,010 to 8,916. Asian enrollment rose by 1,948.
The Hispanic share, at 20.7%, is now closer to the Black share than it has ever been. The gap between the two groups narrowed from 16.3 percentage points in 2015 to 11.3 in 2025. If Hispanic enrollment continues growing at its current pace while Black enrollment holds steady, the gap would close further within the next decade.
The poultry corridor and beyond
The geographic concentration of Hispanic growth in Sussex County reflects employment patterns that began in the 1990s. Poultry processing plants operated by firms like Perdue and Mountaire drew Guatemalan and Mexican workers to Georgetown, Seaford, and surrounding towns. The American Immigration Council reports that 118,900 immigrants now live in Delaware, 11.5% of the state's population, with Mexico and Guatemala among the top countries of origin.
The connection between industry and enrollment is visible in the data. The five traditional districts with the highest Hispanic enrollment shares in 2025, Indian River↗ET (38.5%), Seaford↗ET (30.8%), Laurel↗ET (30.5%), Woodbridge↗ET (29.4%), and Milford↗ET (27.7%), are all in or adjacent to Sussex County's poultry belt. Workers commute from these affordable inland towns to coastal hospitality jobs as well; a 2024 survey of 433 Sussex County immigrant residents found that many work in eastern Sussex's beach communities but live in western towns like Georgetown and Seaford where housing costs are lower.
Whether the growth in Hispanic enrollment reflects primarily new arrivals or families already present whose children are aging into the school system is not fully distinguishable from enrollment data alone. Both forces are likely at work. Census data shows Delaware's Hispanic population grew from 73,221 in 2010 to 104,290 in 2020, a 42.4% increase, and the average age of the Hispanic population, approximately 26, is well within child-bearing years.
English learners and a funding gap
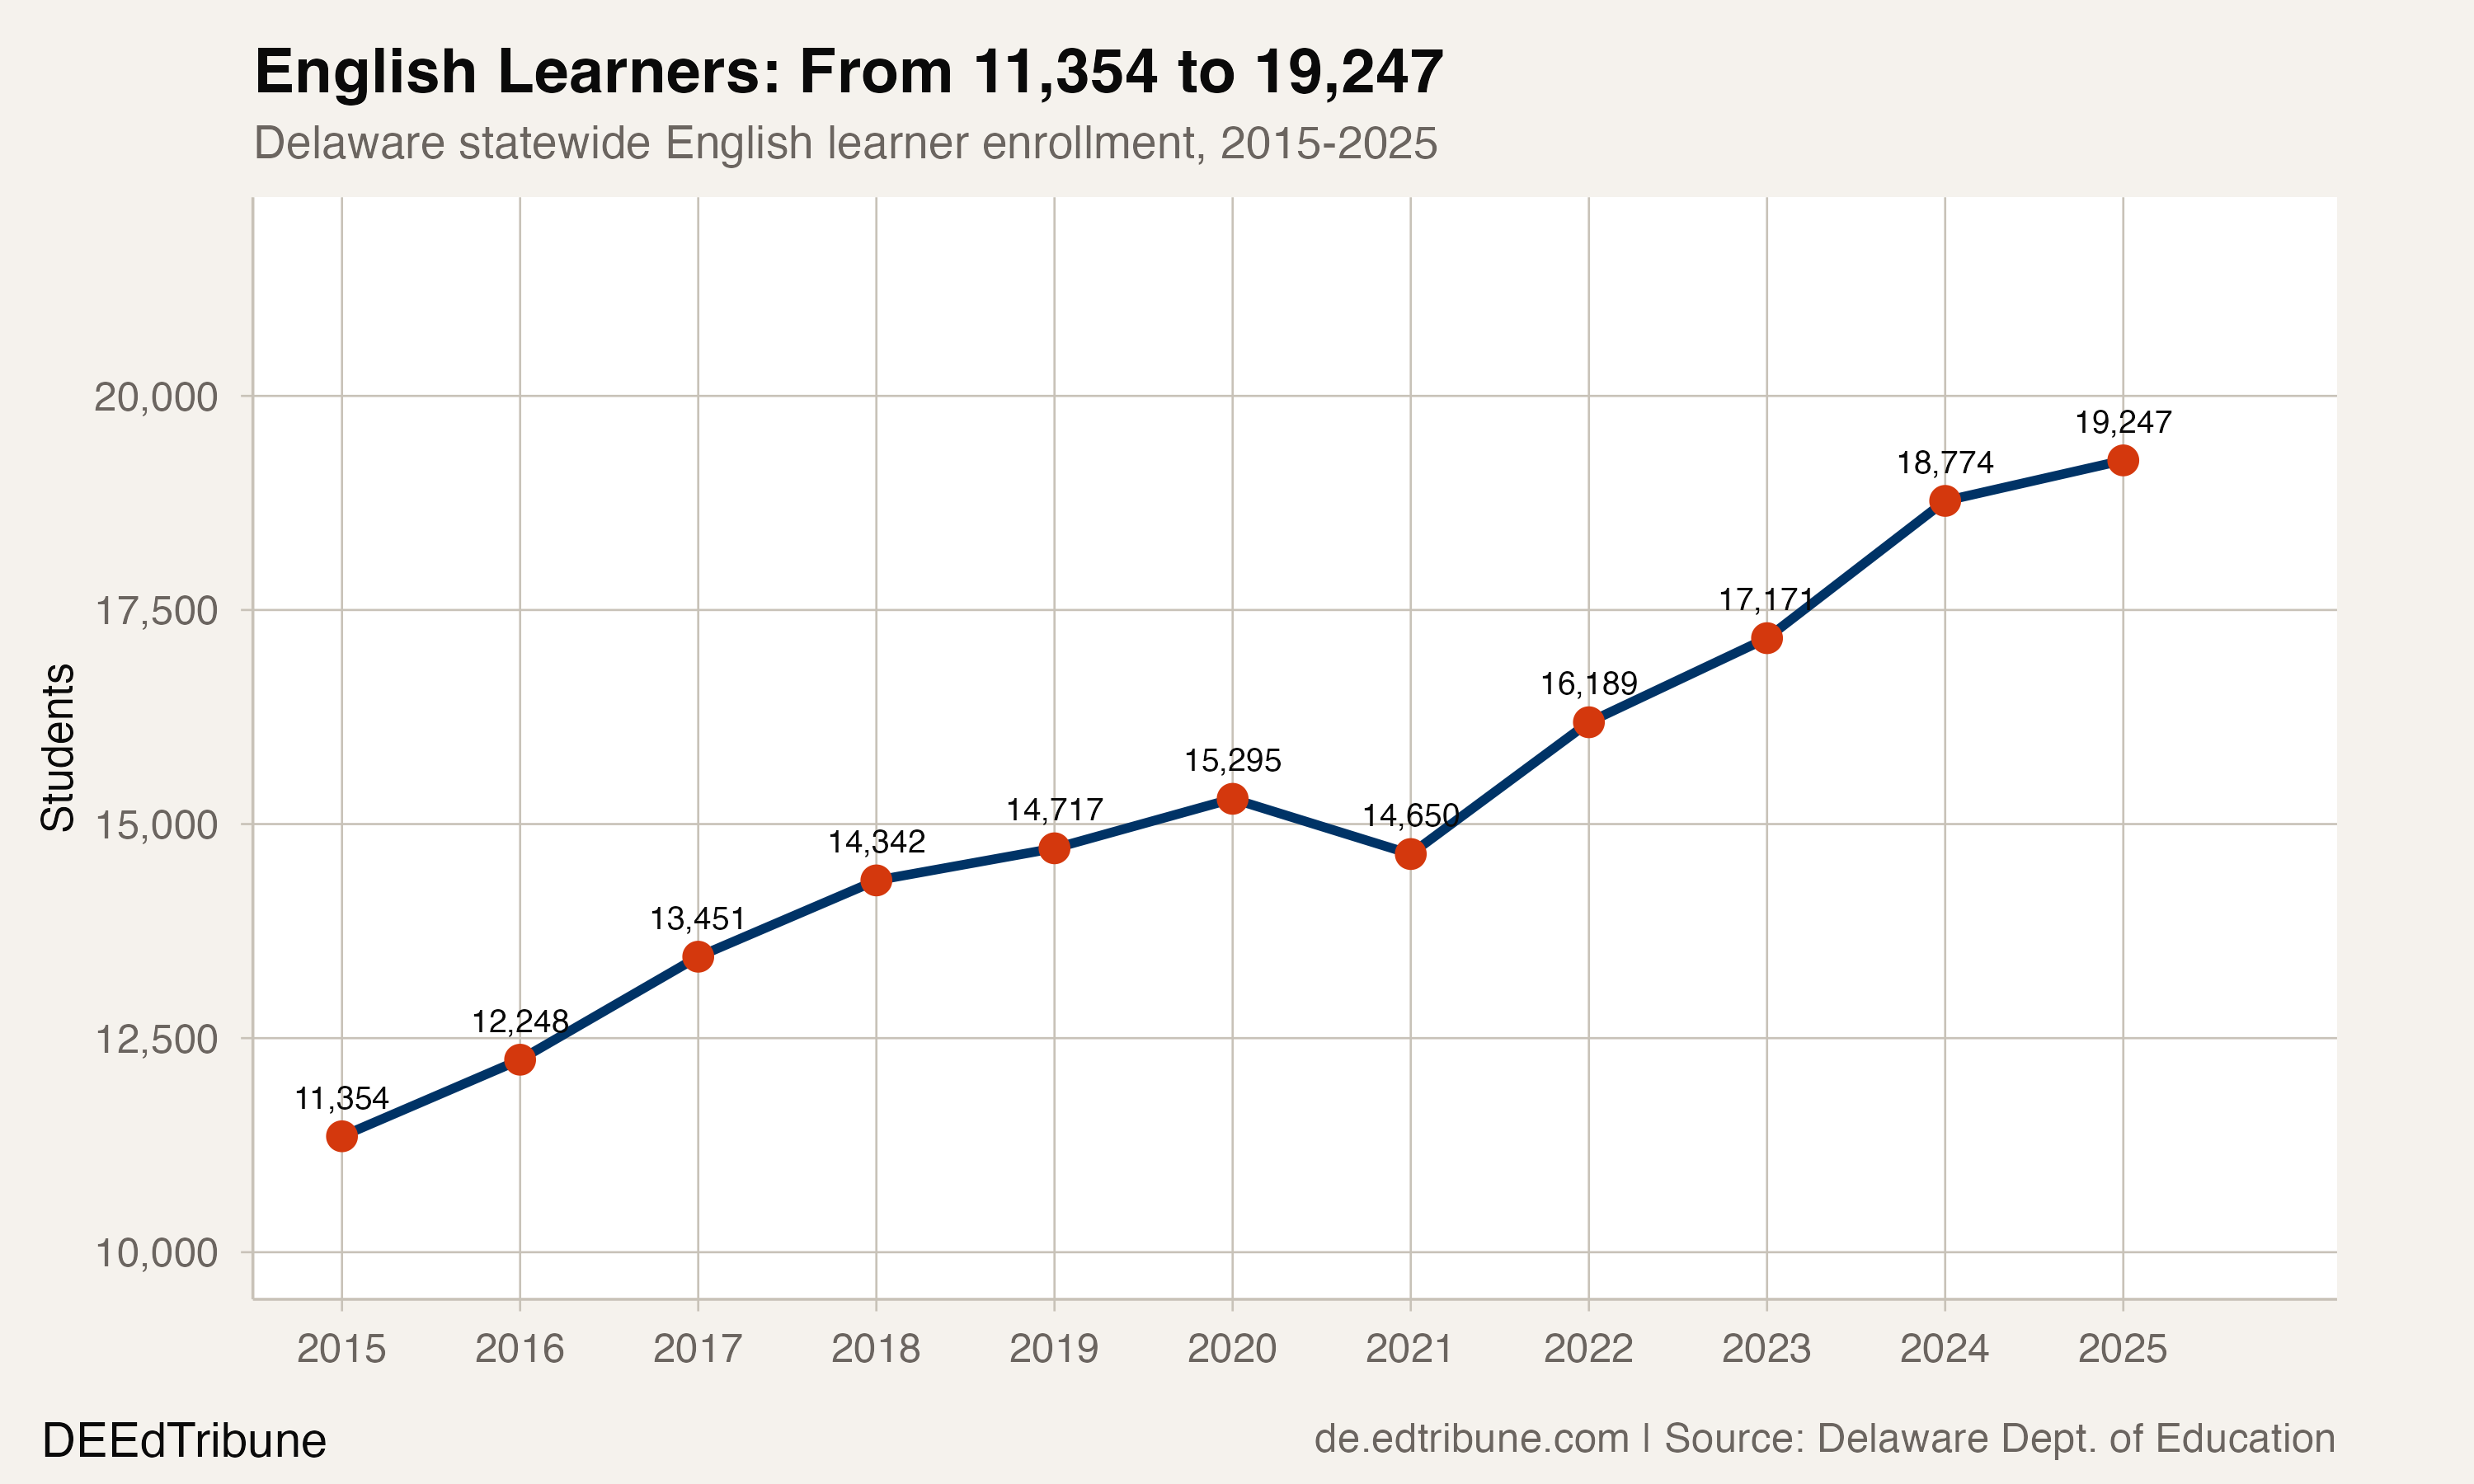
Separately, English learner enrollment, which overlaps heavily with the Hispanic student population, rose 69.5% over the decade, from 11,354 to 19,247 students. Nearly 12.8% of Delaware students are now classified as English learners, up from 8.2% in 2015.
The concentration in Sussex County is stark. In Seaford, 30.1% of students are English learners. In Milford, 26.9%. In Indian River, 26.3%. In Laurel↗ET, 25.6%. Fourteen districts now have English learner shares above 10%, up from a time when that threshold was unusual outside Wilmington-area districts.
The state's capacity to serve these students has not kept pace. Delaware allocates roughly $1,100 per multilingual learner in opportunity funding, compared to $6,000 to $9,000 in neighboring New Jersey and Maryland. Only 34 of 227 Delaware schools have a bilingual or ESL-certified teacher on staff, meaning just 40% of multilingual students have potential access to one within their building.
"Strong public education is the foundation for a strong economy and strong communities. If we're not putting the resources in the fastest growing population of students, that's a problem because we're eroding our communities and our economy and overall health of our state." -- Paul Herdman, Rodel President and CEO, WHYY, 2025
Delaware is one of four states that does not provide additional state resources specifically designated for multilingual learners beyond the opportunity funding supplement. The state's unit-based funding formula dates to 1940, and a Public Education Funding Commission approved a hybrid funding framework in 2025 that would increase weighted funding for English learners and low-income students, but specific formula details remain under development and legislative action is not expected before the 2026 session.
What the enrollment data does not show
The 45% growth figure captures students classified as Hispanic on enrollment forms, but it cannot distinguish between families who arrived in Delaware last year and families who have been in the state for a generation. It cannot separate the effect of immigration from the effect of higher birth rates among younger Hispanic populations already established in Sussex County communities.
The English learner data carries a separate ambiguity: a rising EL count can reflect new arrivals who speak limited English, or it can reflect improved identification of students already enrolled. Delaware adopted updated EL identification guidance in recent years, and some portion of the growth likely reflects better screening rather than new enrollment.
Next school year and the funding question
The 2024-25 data shows no sign that Hispanic enrollment growth is decelerating. The state added 718 Hispanic students in the most recent year, 1,150 the year before, and 1,417 in 2022. The only year in the decade when Hispanic enrollment dipped was 2021, during the pandemic, and that decline was just 65 students.
The structural question for Delaware is whether the funding model will adapt before the gap between student needs and available resources widens further. When nearly one in five students is Hispanic and nearly one in eight is an English learner, and only 34 schools in the state have a certified bilingual or ESL teacher, the math is not abstract. It is a staffing problem in Seaford, a budget problem in Indian River, and a question of whether a 1940s funding formula can serve a 2025 student body.
Detailed code that reproduces the analysis and figures in this article is available exclusively to EdTribune subscribers.
Discussion
Sign in to join the discussion.
Loading comments...