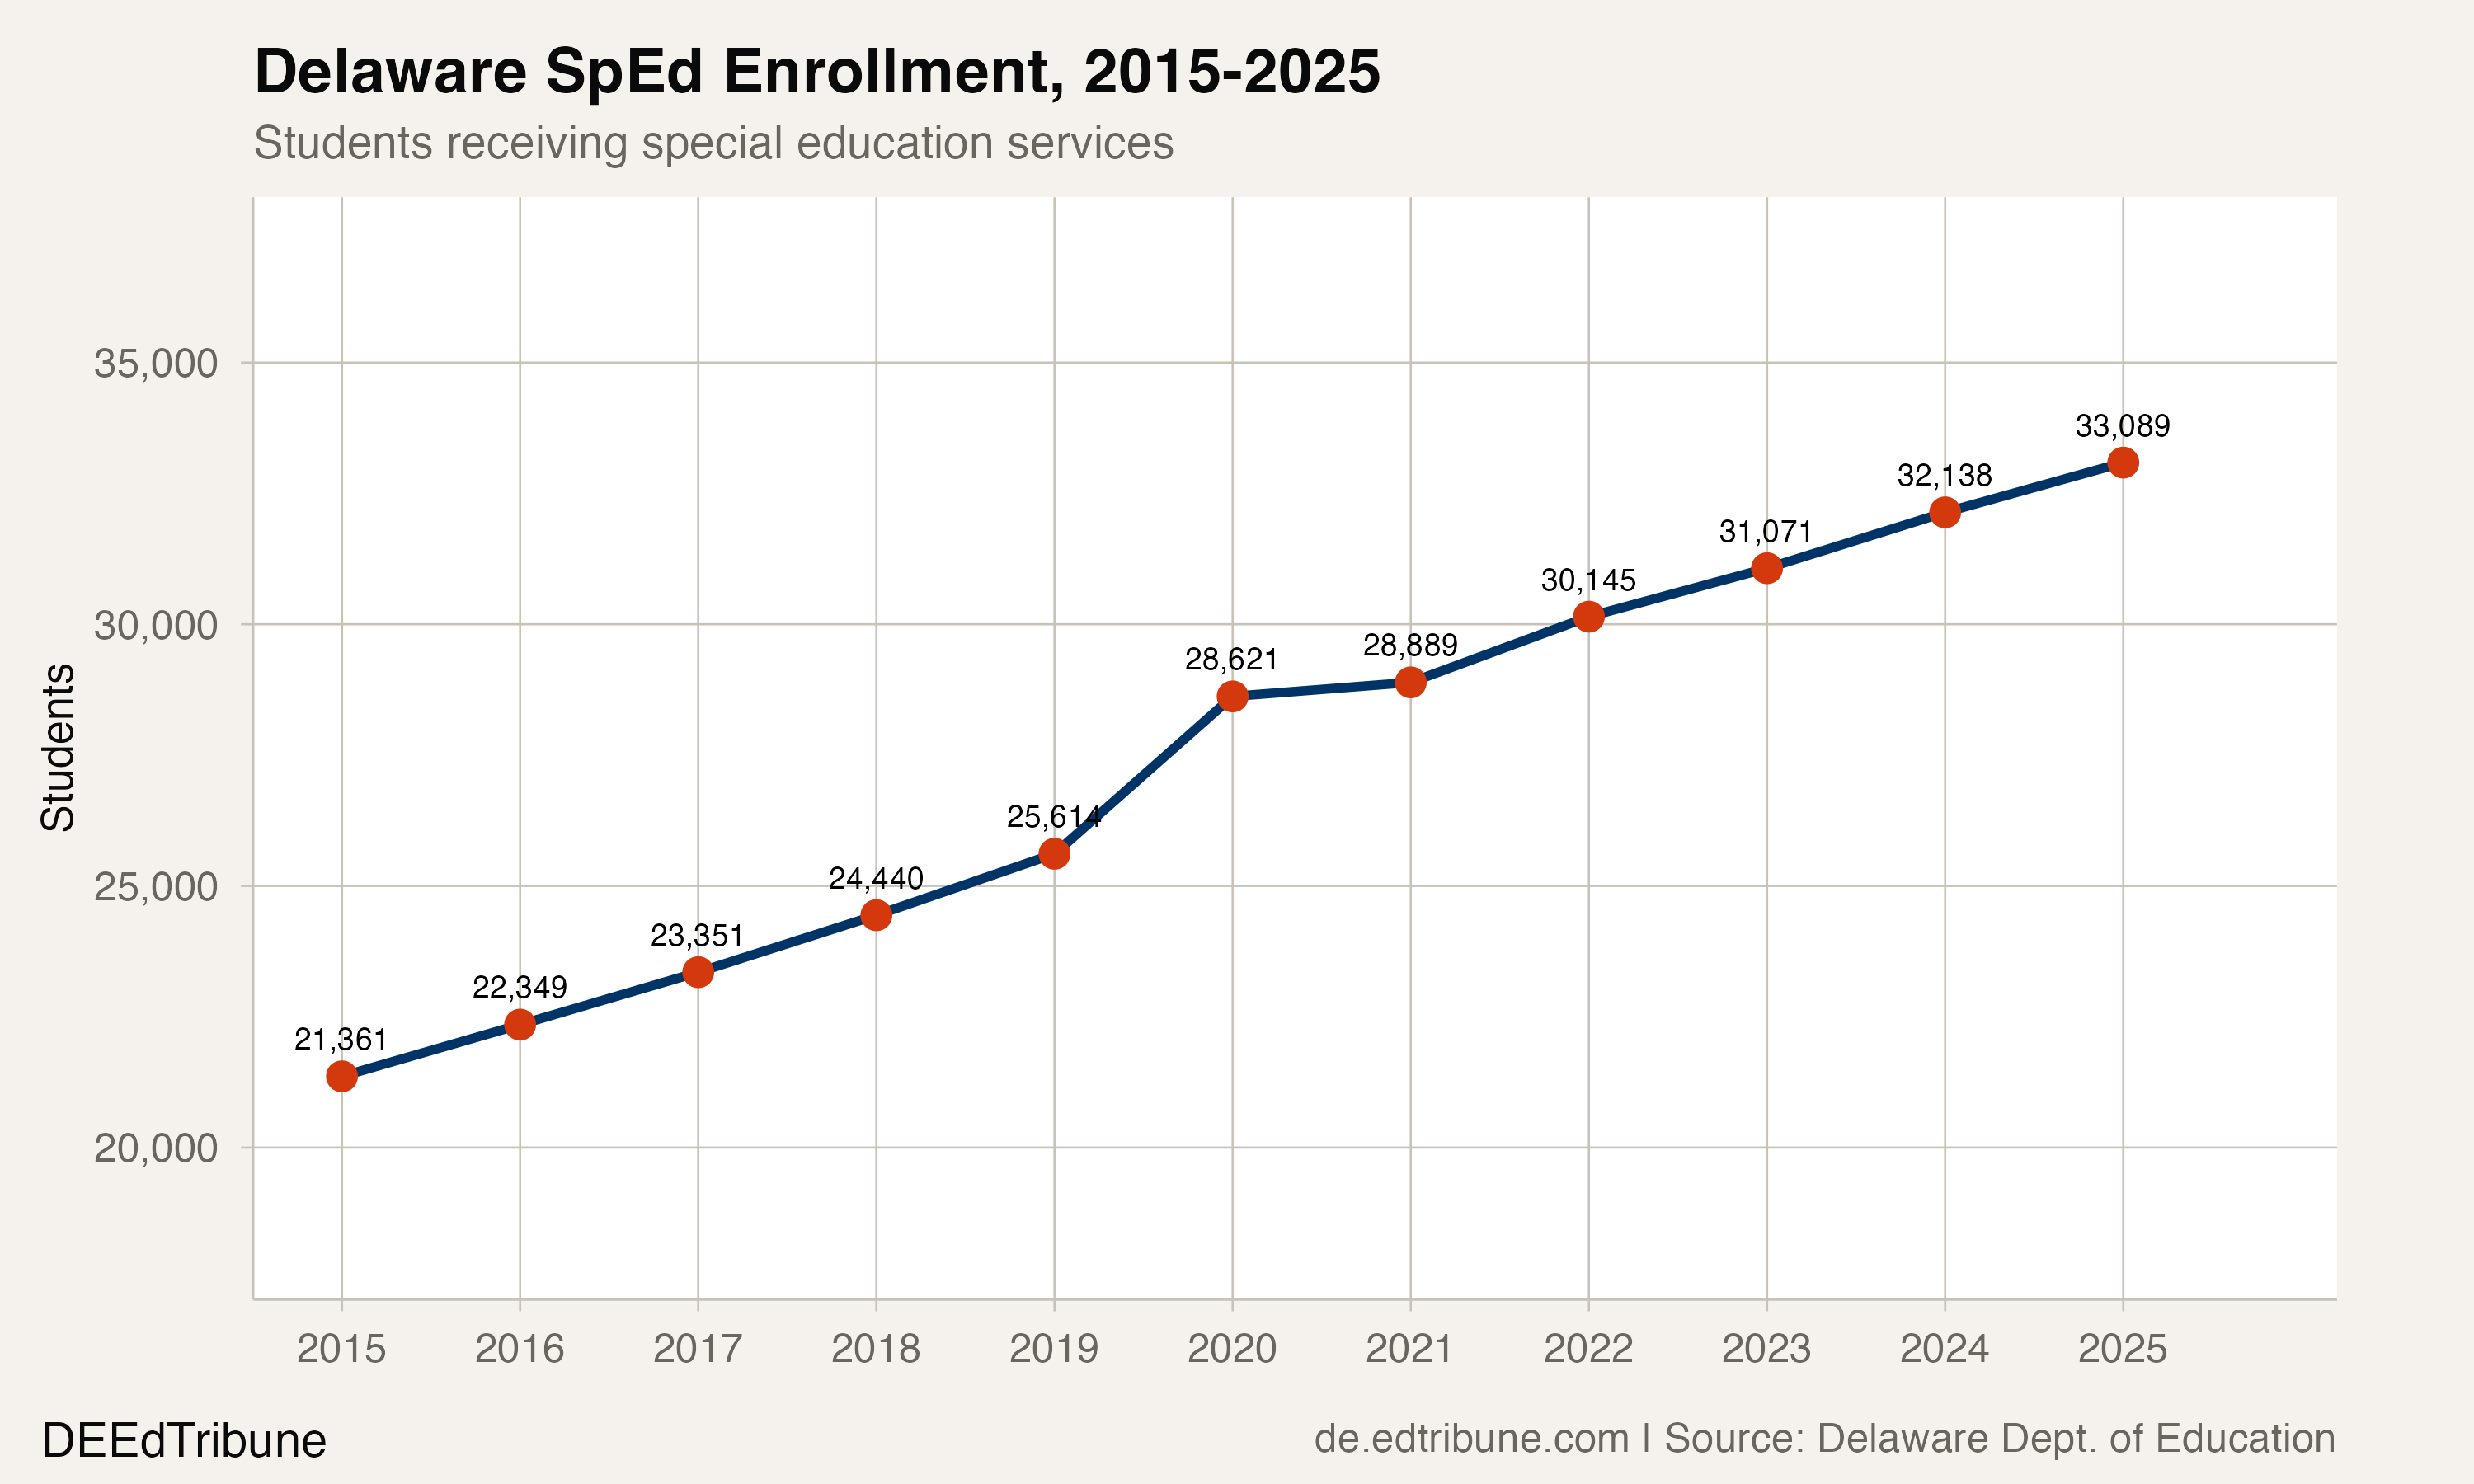
Delaware added 11,546 public school students over the past decade. It added 11,728 students with Individualized Education Programs. The entire net enrollment gain, and then some, came from special education.
That arithmetic produces a state where 22.0% of students now receive special education services, up from 15.4% in 2014-15. The national average, according to the most recent federal data, is 15%. Delaware's rate exceeds it by seven percentage points. Non-special-education enrollment, meanwhile, barely moved: 117,684 students in 2015, 117,502 in 2025. A net loss of 182.
The steadiest line in Delaware education
What stands out in the data is not a single shock but a decade of relentless, almost metronomic growth. Delaware added roughly 1,000 special education students every year from 2015 through 2019. The pandemic year of 2019-20 produced a single anomalous spike of 3,007 new identifications, followed by the slowest year on record (268 in 2020-21), then a return to the long-run pace: 1,256, 926, 1,067, and 951 in the four years since.
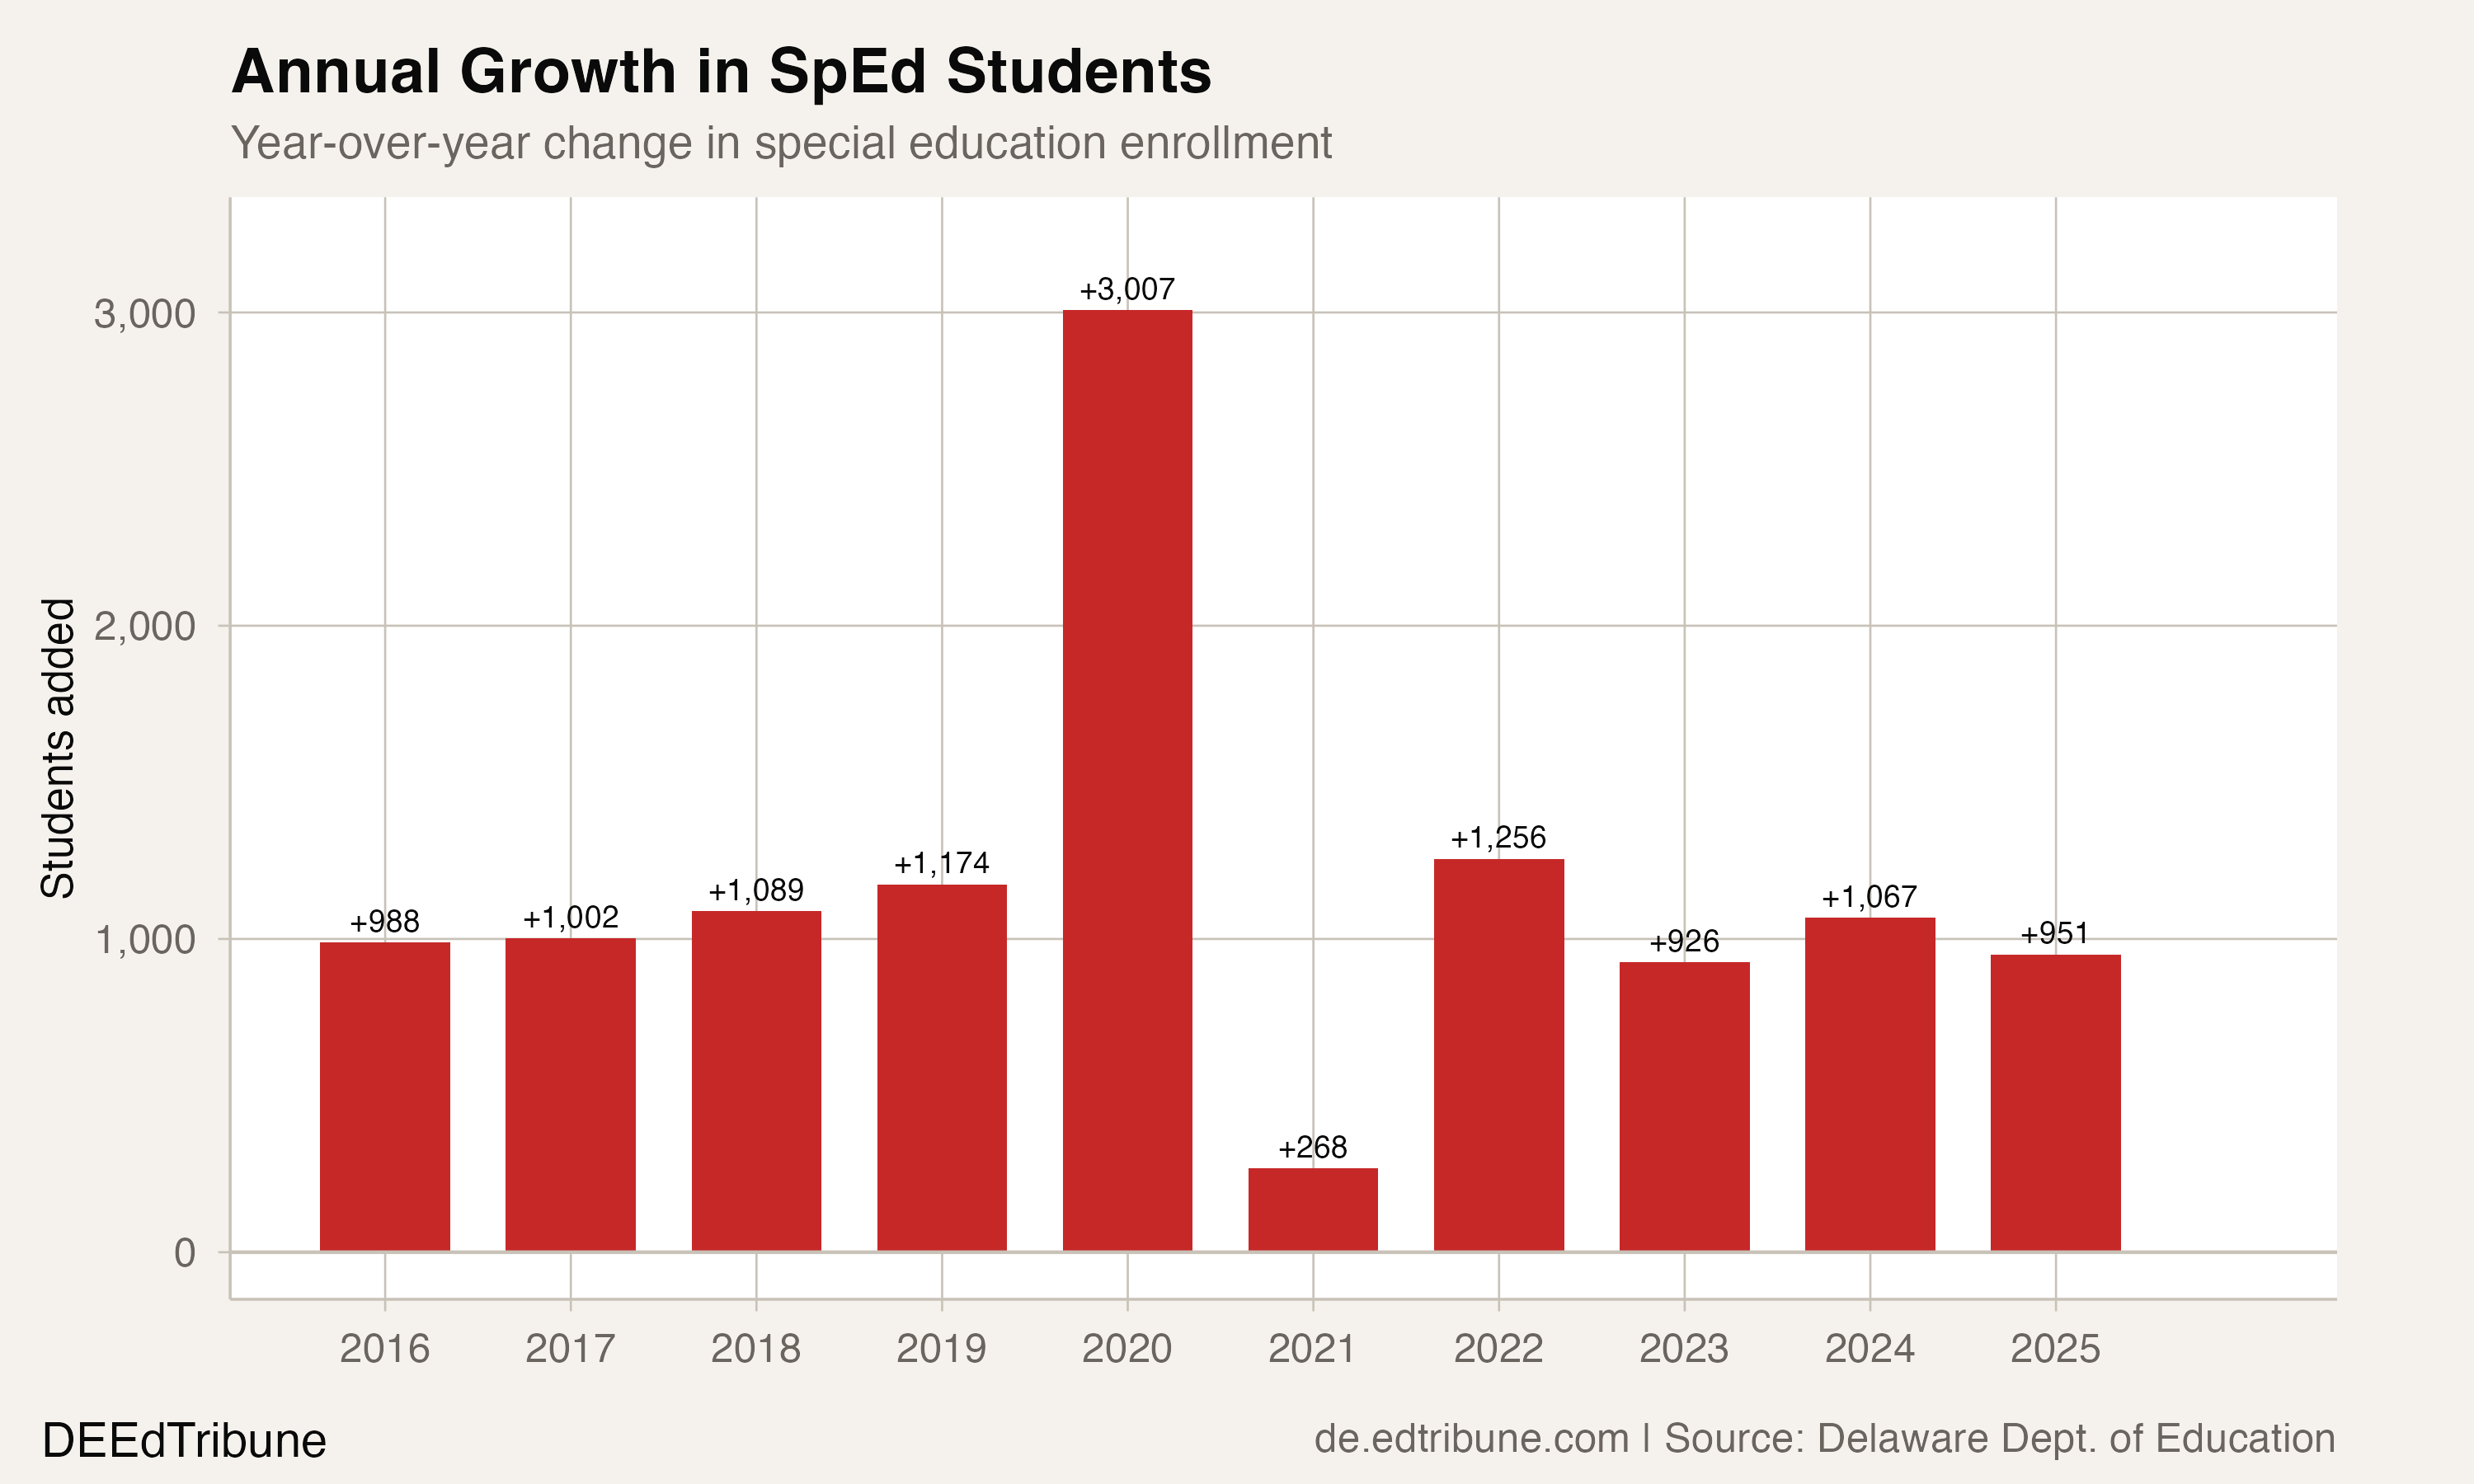
Strip out the 2020 spike and the 2021 rebound, and the pre-pandemic average (1,063 per year) is nearly identical to the post-pandemic average (1,050 per year). COVID did not cause this growth. COVID interrupted it for one year, created a surge the next, and then the underlying trend resumed as if nothing had happened.
That underlying trend is what matters. At roughly 1,000 additional IEPs per year on a base of 150,000 students, the rate climbs by about half a percentage point annually. If the pace holds, Delaware will cross 25% before the end of the decade.
The Wilmington corridor
The highest special education rates in Delaware cluster in the Wilmington-area districts now at the center of a proposed consolidation. Christina↗ET leads at 29.5%, meaning nearly three in 10 of its students have IEPs. Colonial↗ET is at 29.4%. Capital↗ET, in Dover, reaches 26.4%.
The increases over the decade are substantial. Colonial climbed 11.3 percentage points, from 18.1% to 29.4%. Red Clay↗ET jumped 10.6 points, from 12.3% to 22.9%. Brandywine↗ET rose from 15.2% to 25.1%. Christina, which started high, added another 10.6 points.
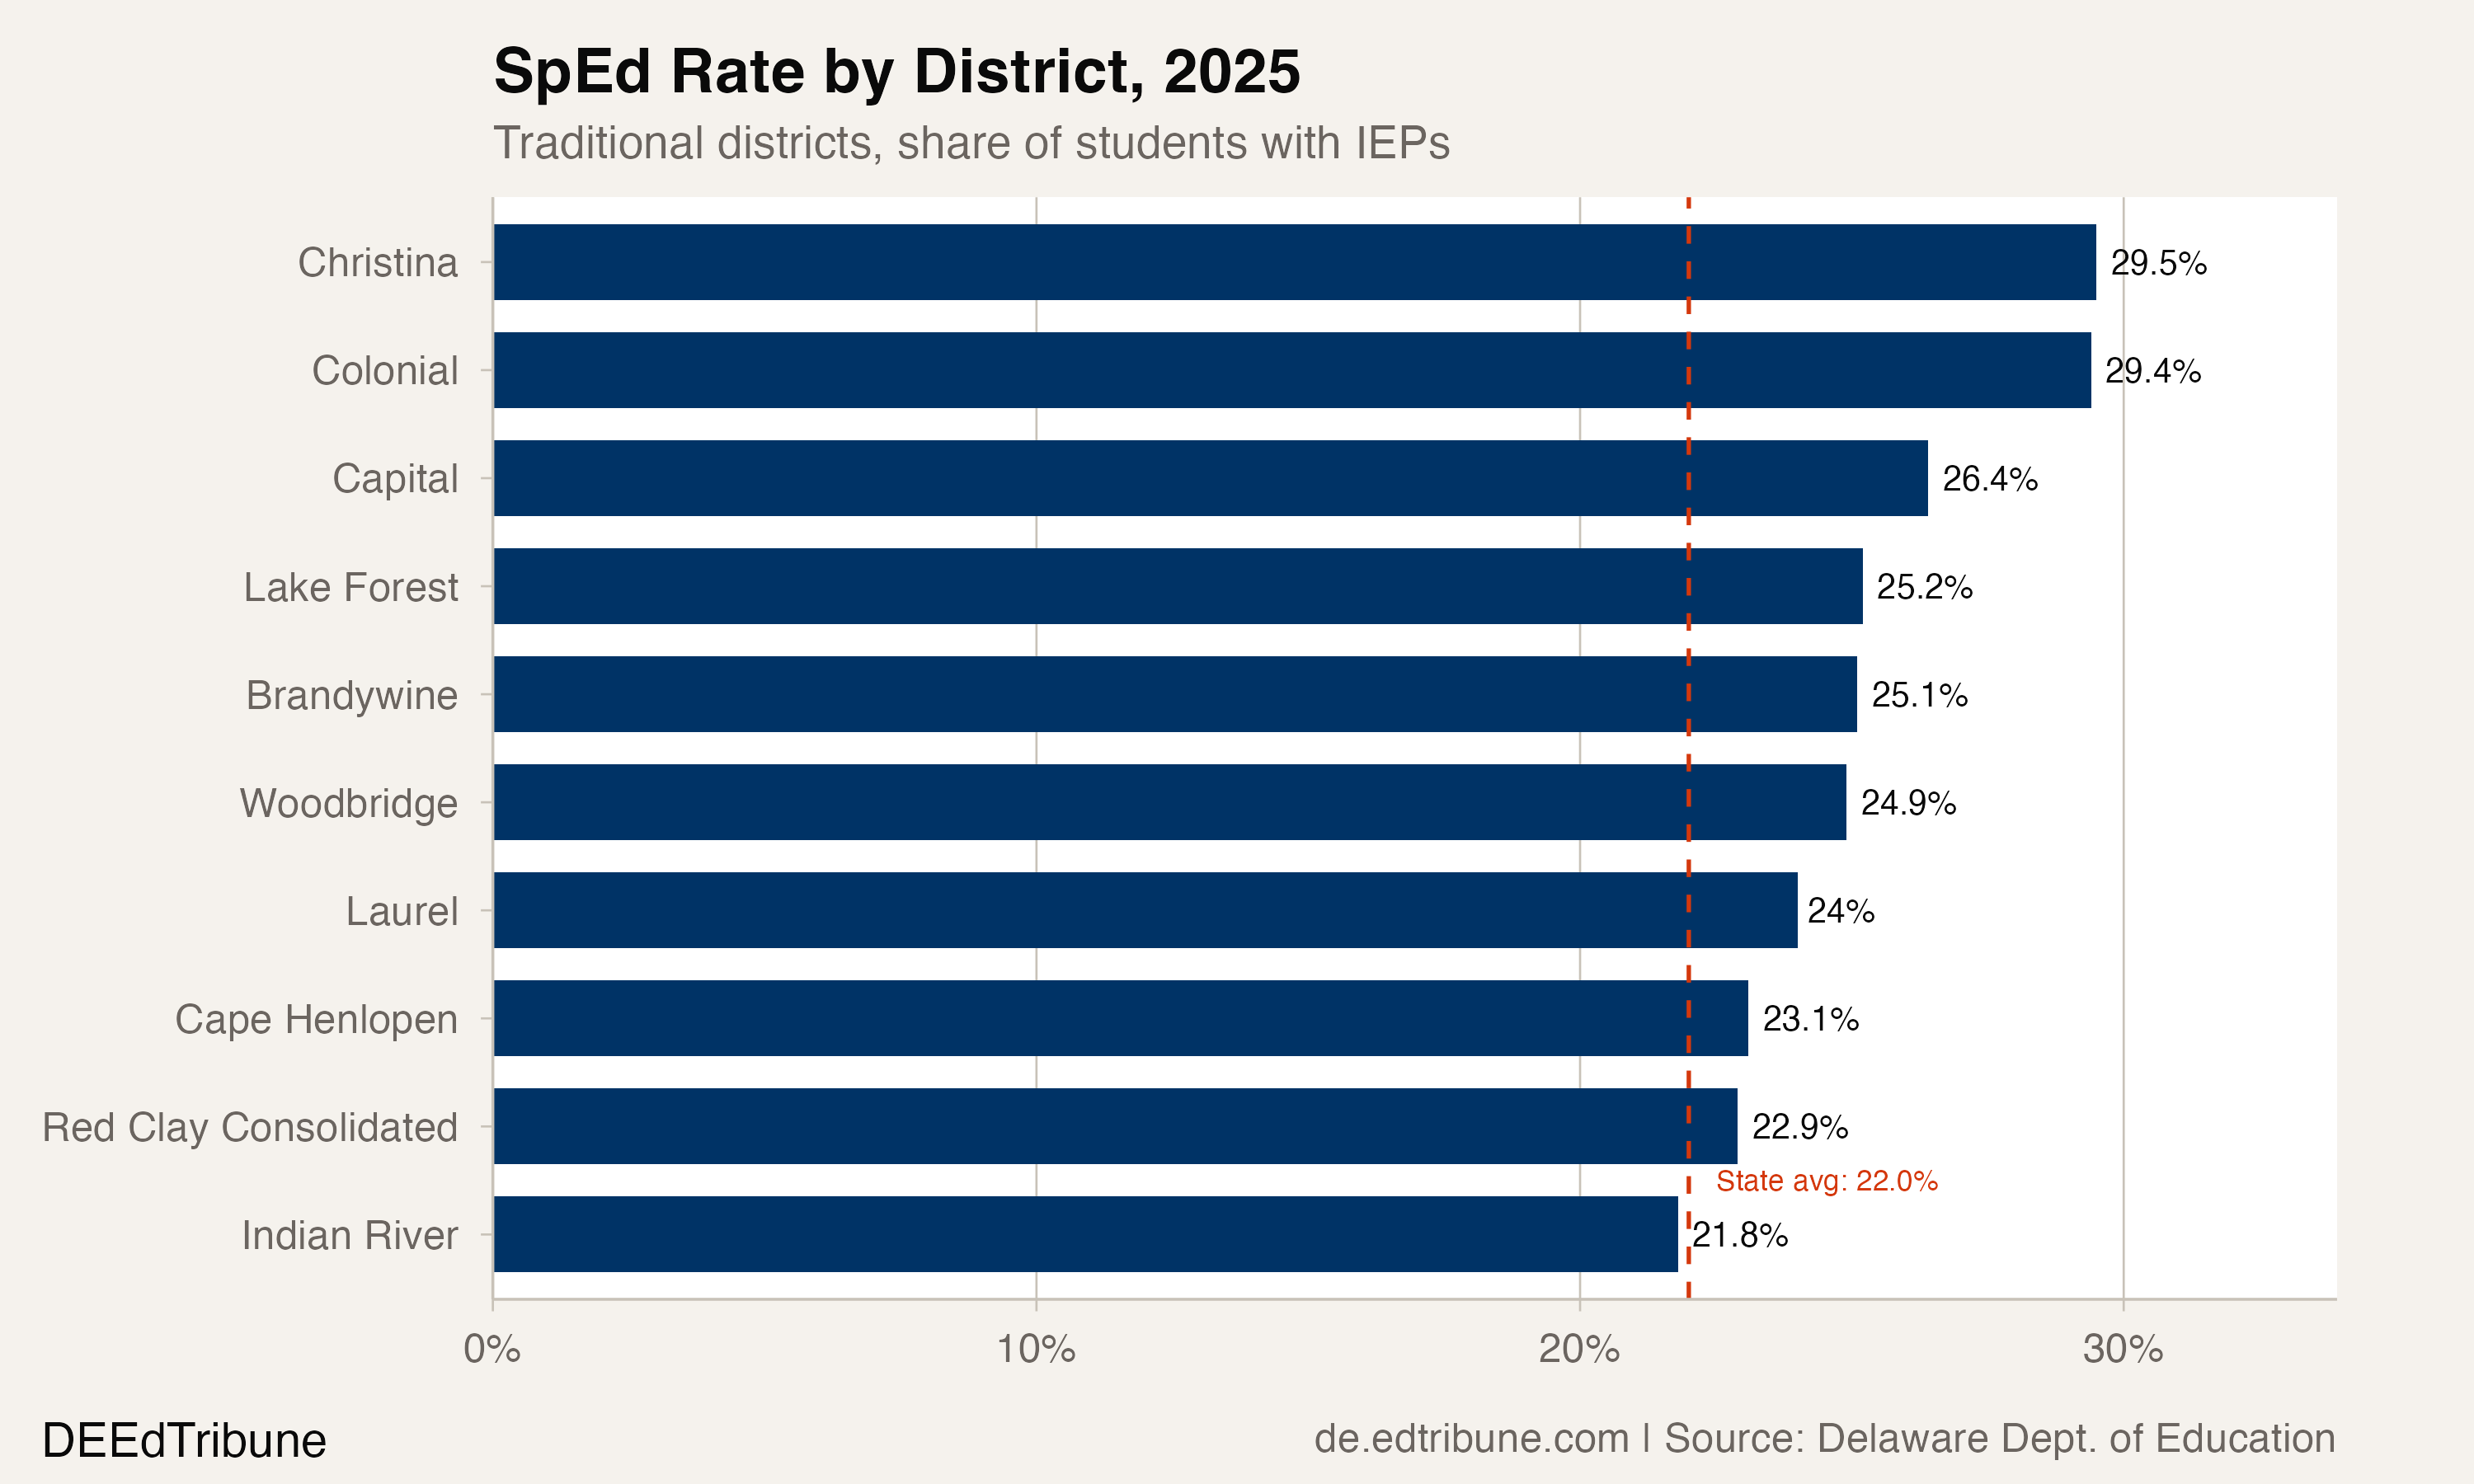
The pattern is not confined to struggling urban districts. Appoquinimink↗ET, a fast-growing suburban district in the Middletown corridor, added 1,587 special education students since 2015, more in absolute terms than any other district except Red Clay. Its rate rose from 13.7% to 21.5%. Lake Forest↗ET, a rural district in Kent County, went from 16.3% to 25.2%. Woodbridge↗ET, also rural, jumped from 14.5% to 24.9%.
Every traditional district in the state saw its special education rate increase. Not one declined.
A gap between sectors
Charter schools in Delaware serve a growing but still markedly lower share of students with disabilities. Traditional districts collectively report a 23.1% special education rate. Charter schools report 16.4%.
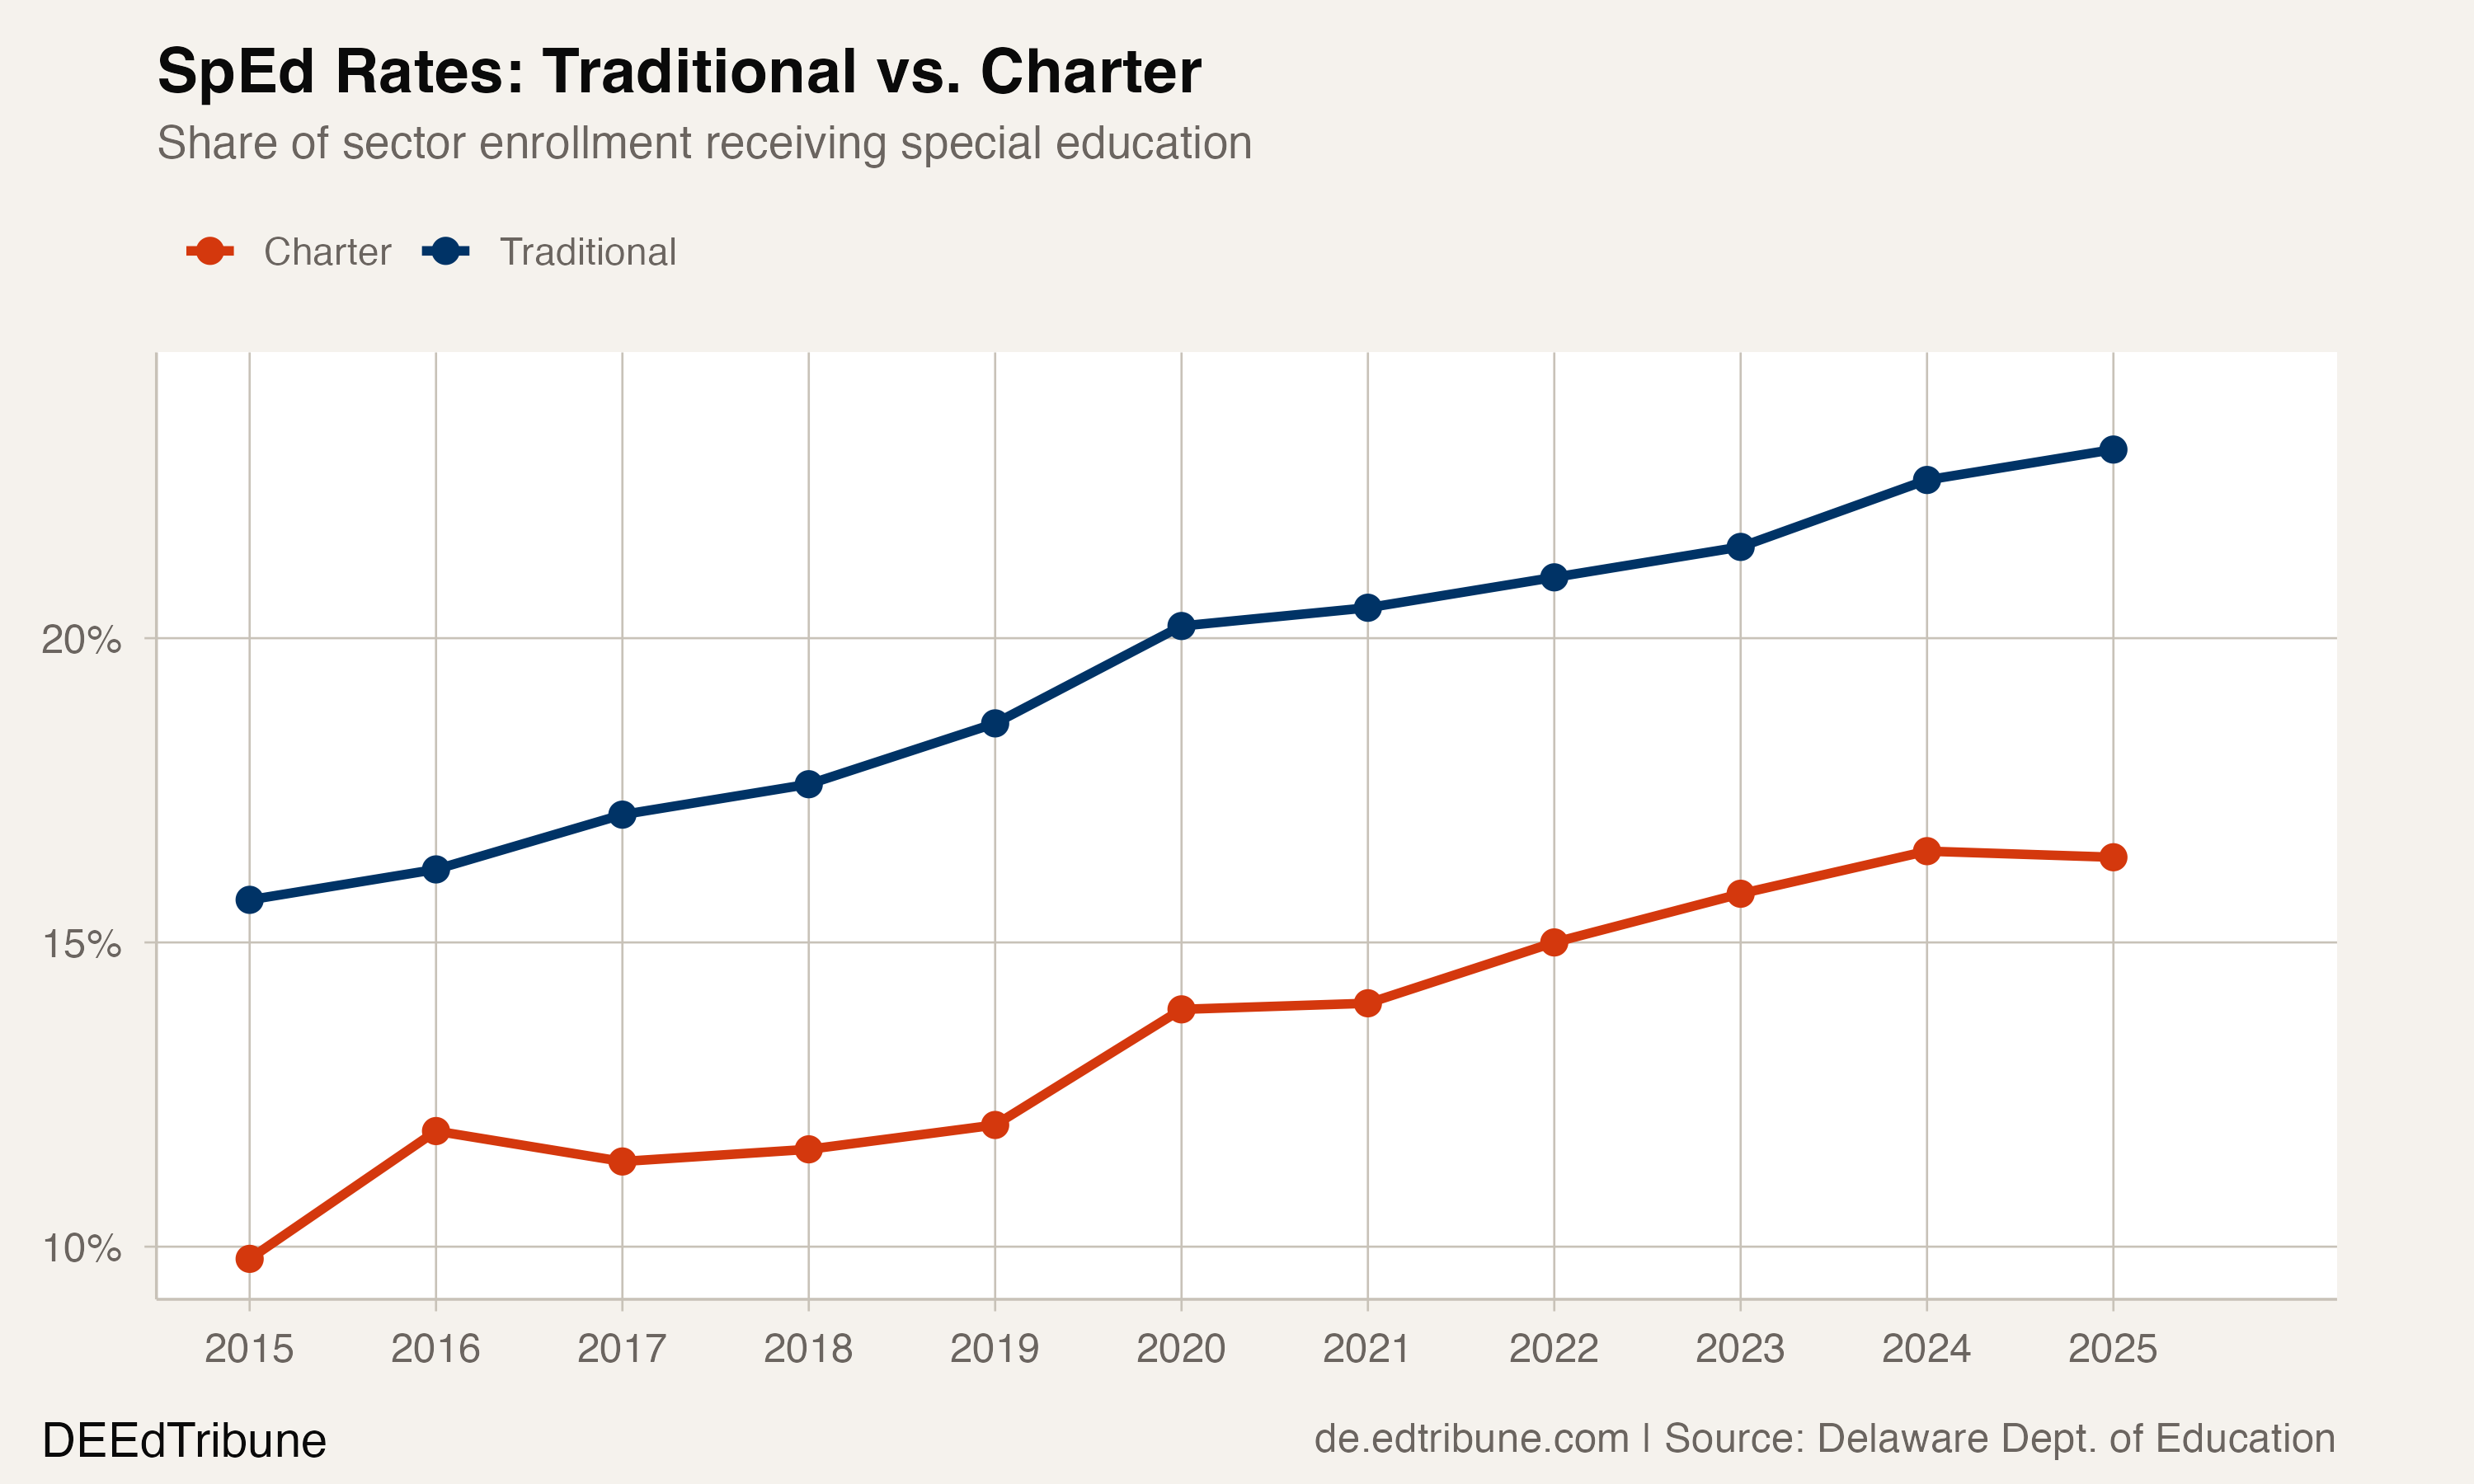
Both sectors are rising. Charters climbed from 9.8% in 2015 to 16.4% in 2025, a 6.6 percentage-point increase. Traditional districts climbed from 15.7% to 23.1%, a 7.4-point gain. The absolute gap between the two sectors has widened slightly, from 5.9 points to 6.7 points.
In a school choice state like Delaware, where students can cross district lines and enroll in charters, this differential is not neutral. It creates a structural dynamic: traditional districts absorb a disproportionate share of students whose instructional programs carry higher per-pupil costs. Whether this reflects selection effects (families of students with complex IEPs choosing traditional schools for established services) or differences in identification practice is not answerable from enrollment data alone.
What is driving the count upward
The most likely explanation for a sustained, steady increase in identification rates is a broadening of who gets identified, not a sudden change in the underlying prevalence of disabilities. Nationally, special education enrollment hit an all-time high of 7.5 million in 2022-23, and the fastest-growing categories are autism, developmental delay, and other health impairments, conditions where identification depends heavily on screening practices and clinical thresholds.
Delaware's growth fits this national pattern but far outpaces it. The national rate has moved from roughly 13.8% to 15% over the same decade, a 1.2-point shift. Delaware gained 6.6 points. Something beyond the national trend is at work.
One contributing factor is Delaware's unit-based funding system, which allocates state funding based in part on how many special education "units" a district generates. Each unit is defined as one certified position per 8.4 preschool special education students, with similar ratios for other categories. Identifying more students generates more funded positions. This is not to suggest that districts are fabricating IEPs, but it means the system does not create a financial disincentive to identify. Education policy expert Kenneth Shores, reviewing Delaware's funding structure for the state's Public Education Funding Commission, noted that "Delaware is pretty unusually needy, not so much with poverty, but with its special needs population and the ELL population."
A competing explanation is that Delaware genuinely does have higher rates of students who need services, and the growing identification reflects a state that is getting closer to finding them all. The NCES estimates Delaware's IDEA rate at 19% for 2022-23, already ranking among the highest in the country. States like Pennsylvania (21.1%), New York (20.7%), and Maine (20.6%) operate at comparable levels. Delaware may simply be a state where the actual need is high and the identification system is responsive.
The staffing equation
Growth of this magnitude carries direct operational consequences. Research by Rachel Juergensen of Delaware State University found 165 vacant special education teaching positions during the summer of 2023.
"The need for special education teachers in Delaware is critical, and without intervention, the severe shortages and subsequent negative impact on students with disabilities will continue to prevail." -- Rachel Juergensen, WHYY, Nov. 2023
A $1 million federal grant created the Delaware Special Educator Certificate (DE-SPEC) program to address the shortage, targeting 60 teachers over three cohorts. At the current growth rate of roughly 1,000 new IEPs per year, the program's capacity does not match the scale of the demand.
The broader funding picture is equally strained. A 2023 study by the American Institutes for Research, commissioned as part of a funding litigation settlement, found that Delaware underfunds its schools by $600 million to $1 billion relative to what would be needed to meet state educational goals. Special education students are a central part of that gap.
What to watch next
The Redding Consortium voted in December 2025 to recommend merging Christina, Colonial, Brandywine, and Red Clay into a single Northern New Castle County district of more than 45,000 students. If the legislature approves, the merged district would inherit a combined special education population of 13,854 students, 26.3% of its enrollment. Senator Tizzy Lockman, co-chair of the Redding Consortium, has argued that consolidation "meaningfully and fully addresses structural fragmentation" that determines what resources students can access. Whether a larger district can serve 13,000-plus IEPs more efficiently than four smaller ones is the operational question the merger must eventually answer.
In the meantime, the count keeps climbing. Delaware added 951 special education students last year, 1,067 the year before, 926 the year before that. The line has not bent in a decade.
Detailed code that reproduces the analysis and figures in this article is available exclusively to EdTribune subscribers.
Discussion
Sign in to join the discussion.
Loading comments...