In Sussex County, where poultry processing plants and agricultural operations line the coastal plain, the Laurel↗ET School District enrolled 199 English learners in 2014-15. One in 12 students. A decade later, that number is 640, one in four, and the share has tripled.
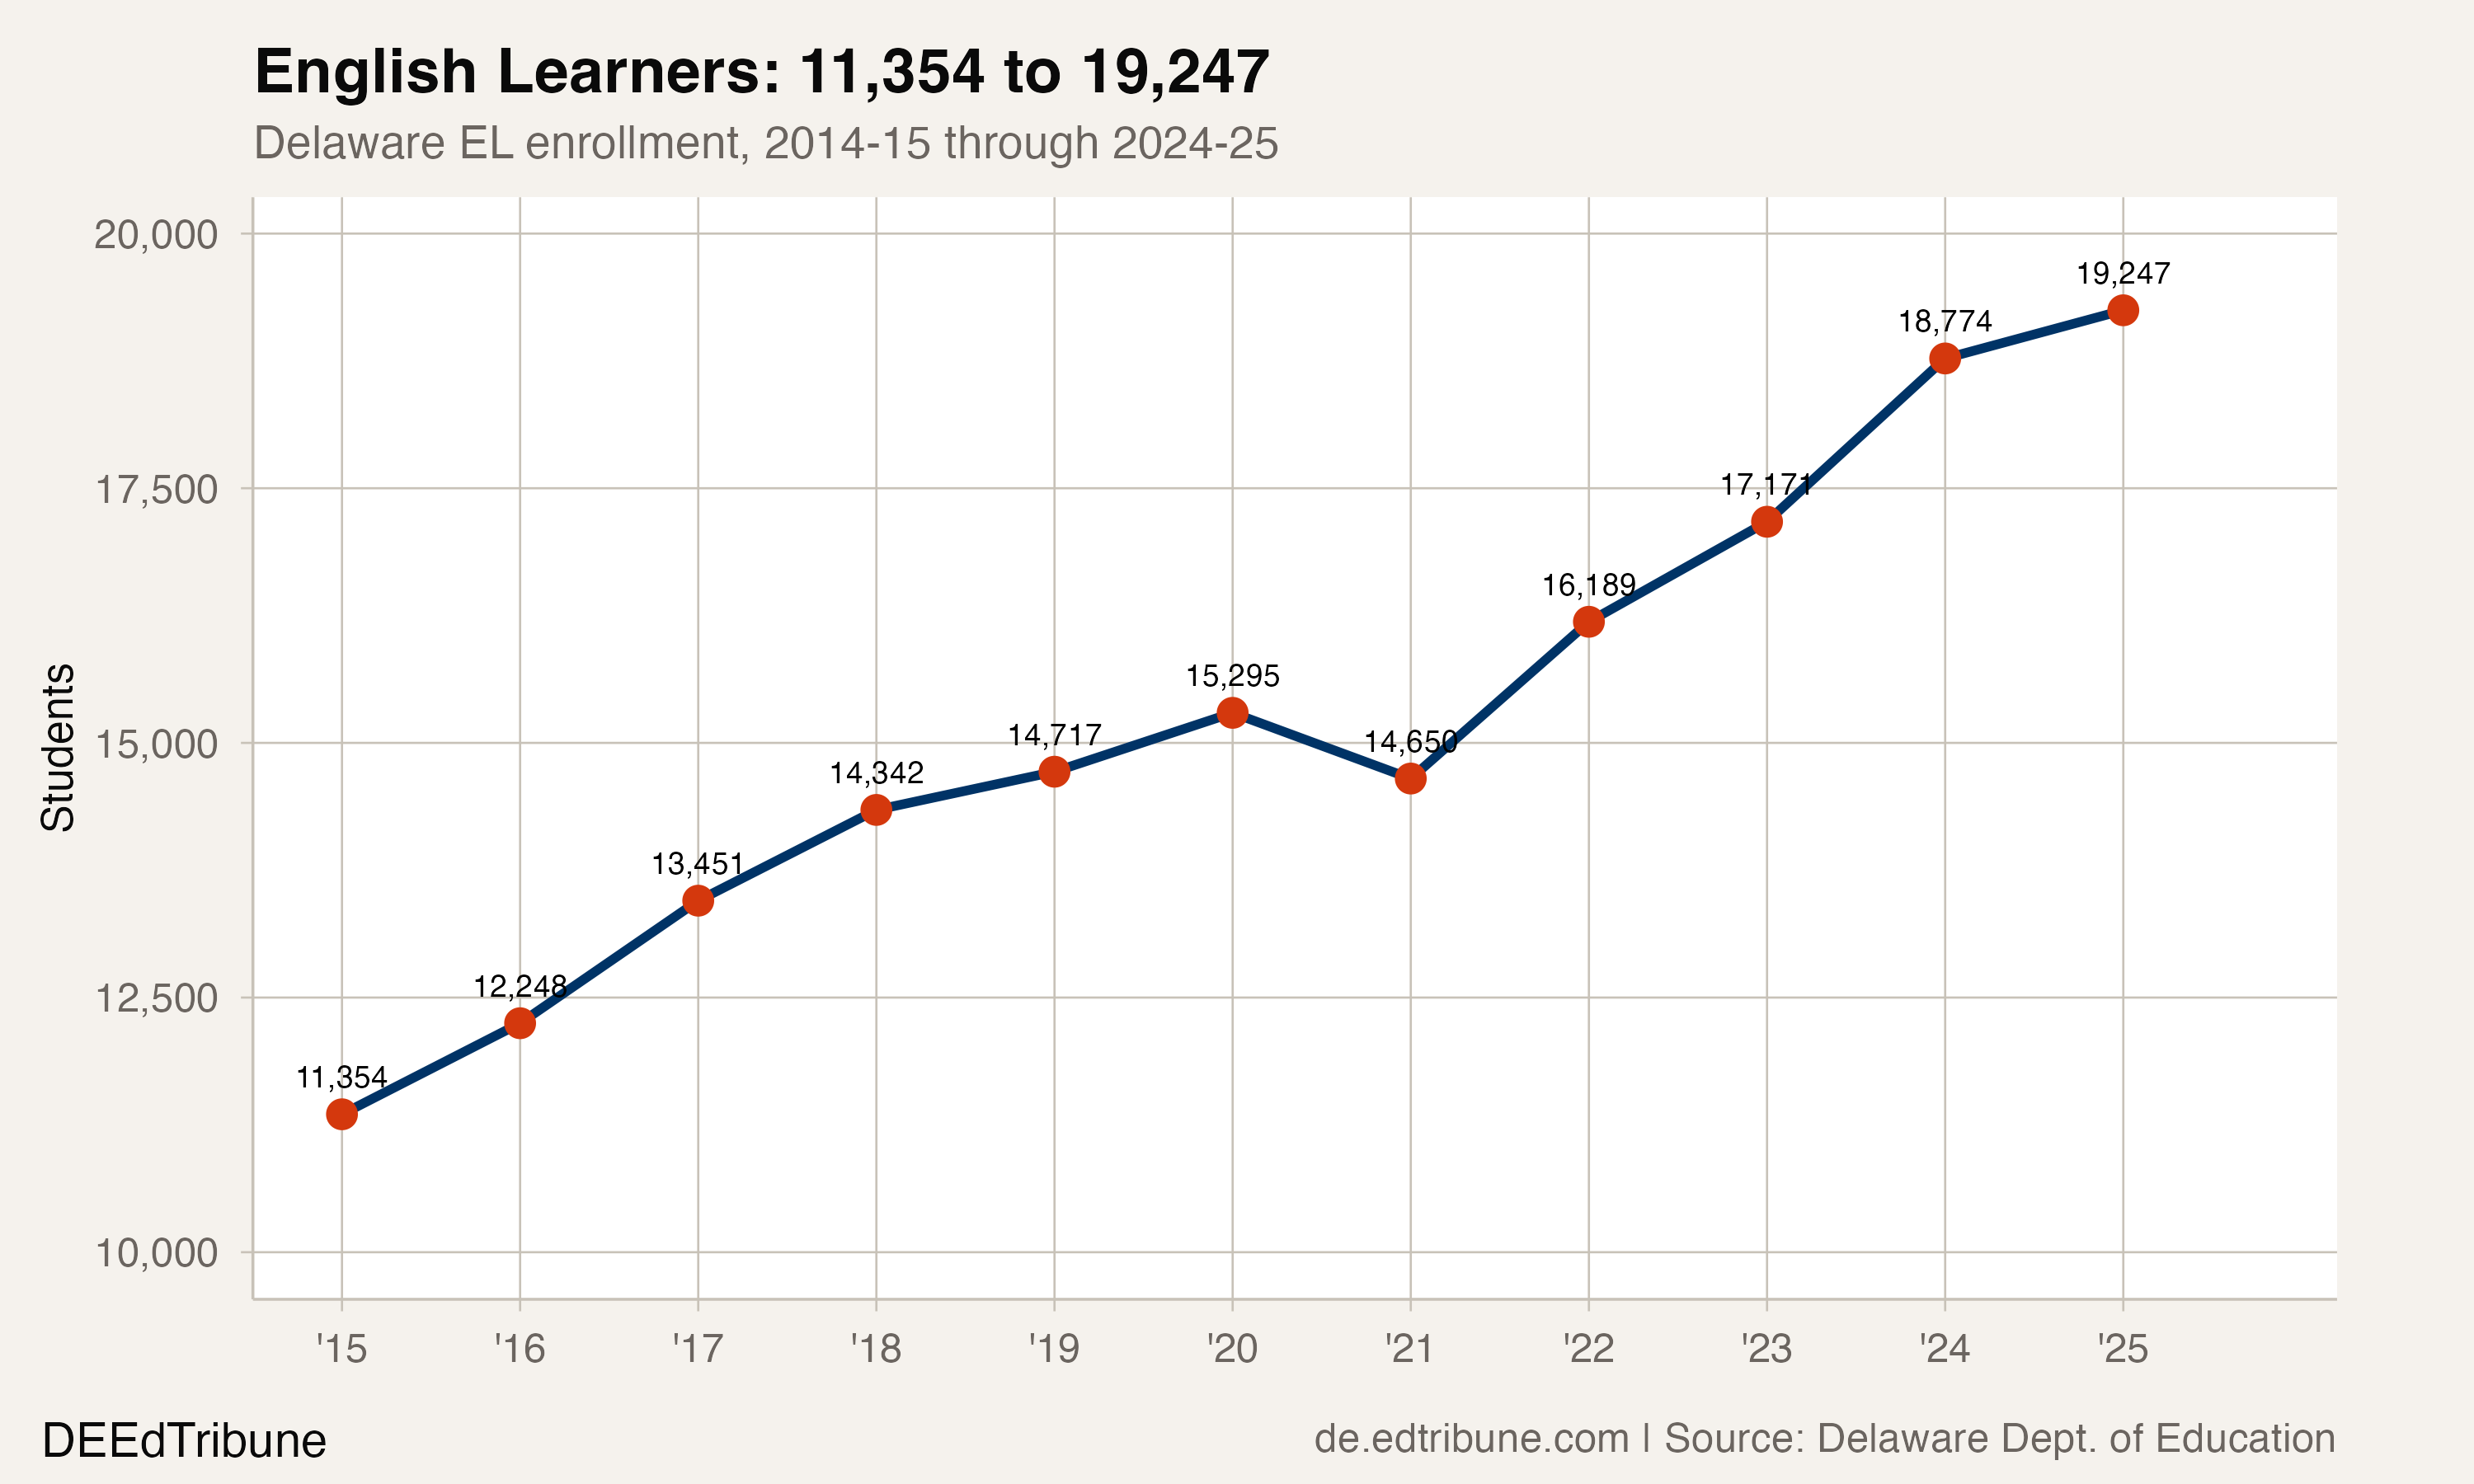
Laurel is not an outlier. It is a microcosm of a transformation that has reshaped Delaware's public schools from top to bottom. Statewide, English learner enrollment rose from 11,354 to 19,247 over the past decade, a 69.5% increase that added 7,893 students to a system that grew by only 11,546 total. English learners account for 68.4% of all enrollment growth in the state since 2014-15.
The growth engine hiding inside flat totals
Delaware's total enrollment rose 8.3% over the decade, from 139,045 to 150,591. Steady but unremarkable. Strip out English learner growth and the picture changes: the remaining student population grew by just 3,653, barely 2.9%. Without the influx of multilingual families, Delaware would look more like the declining-enrollment states on its borders.
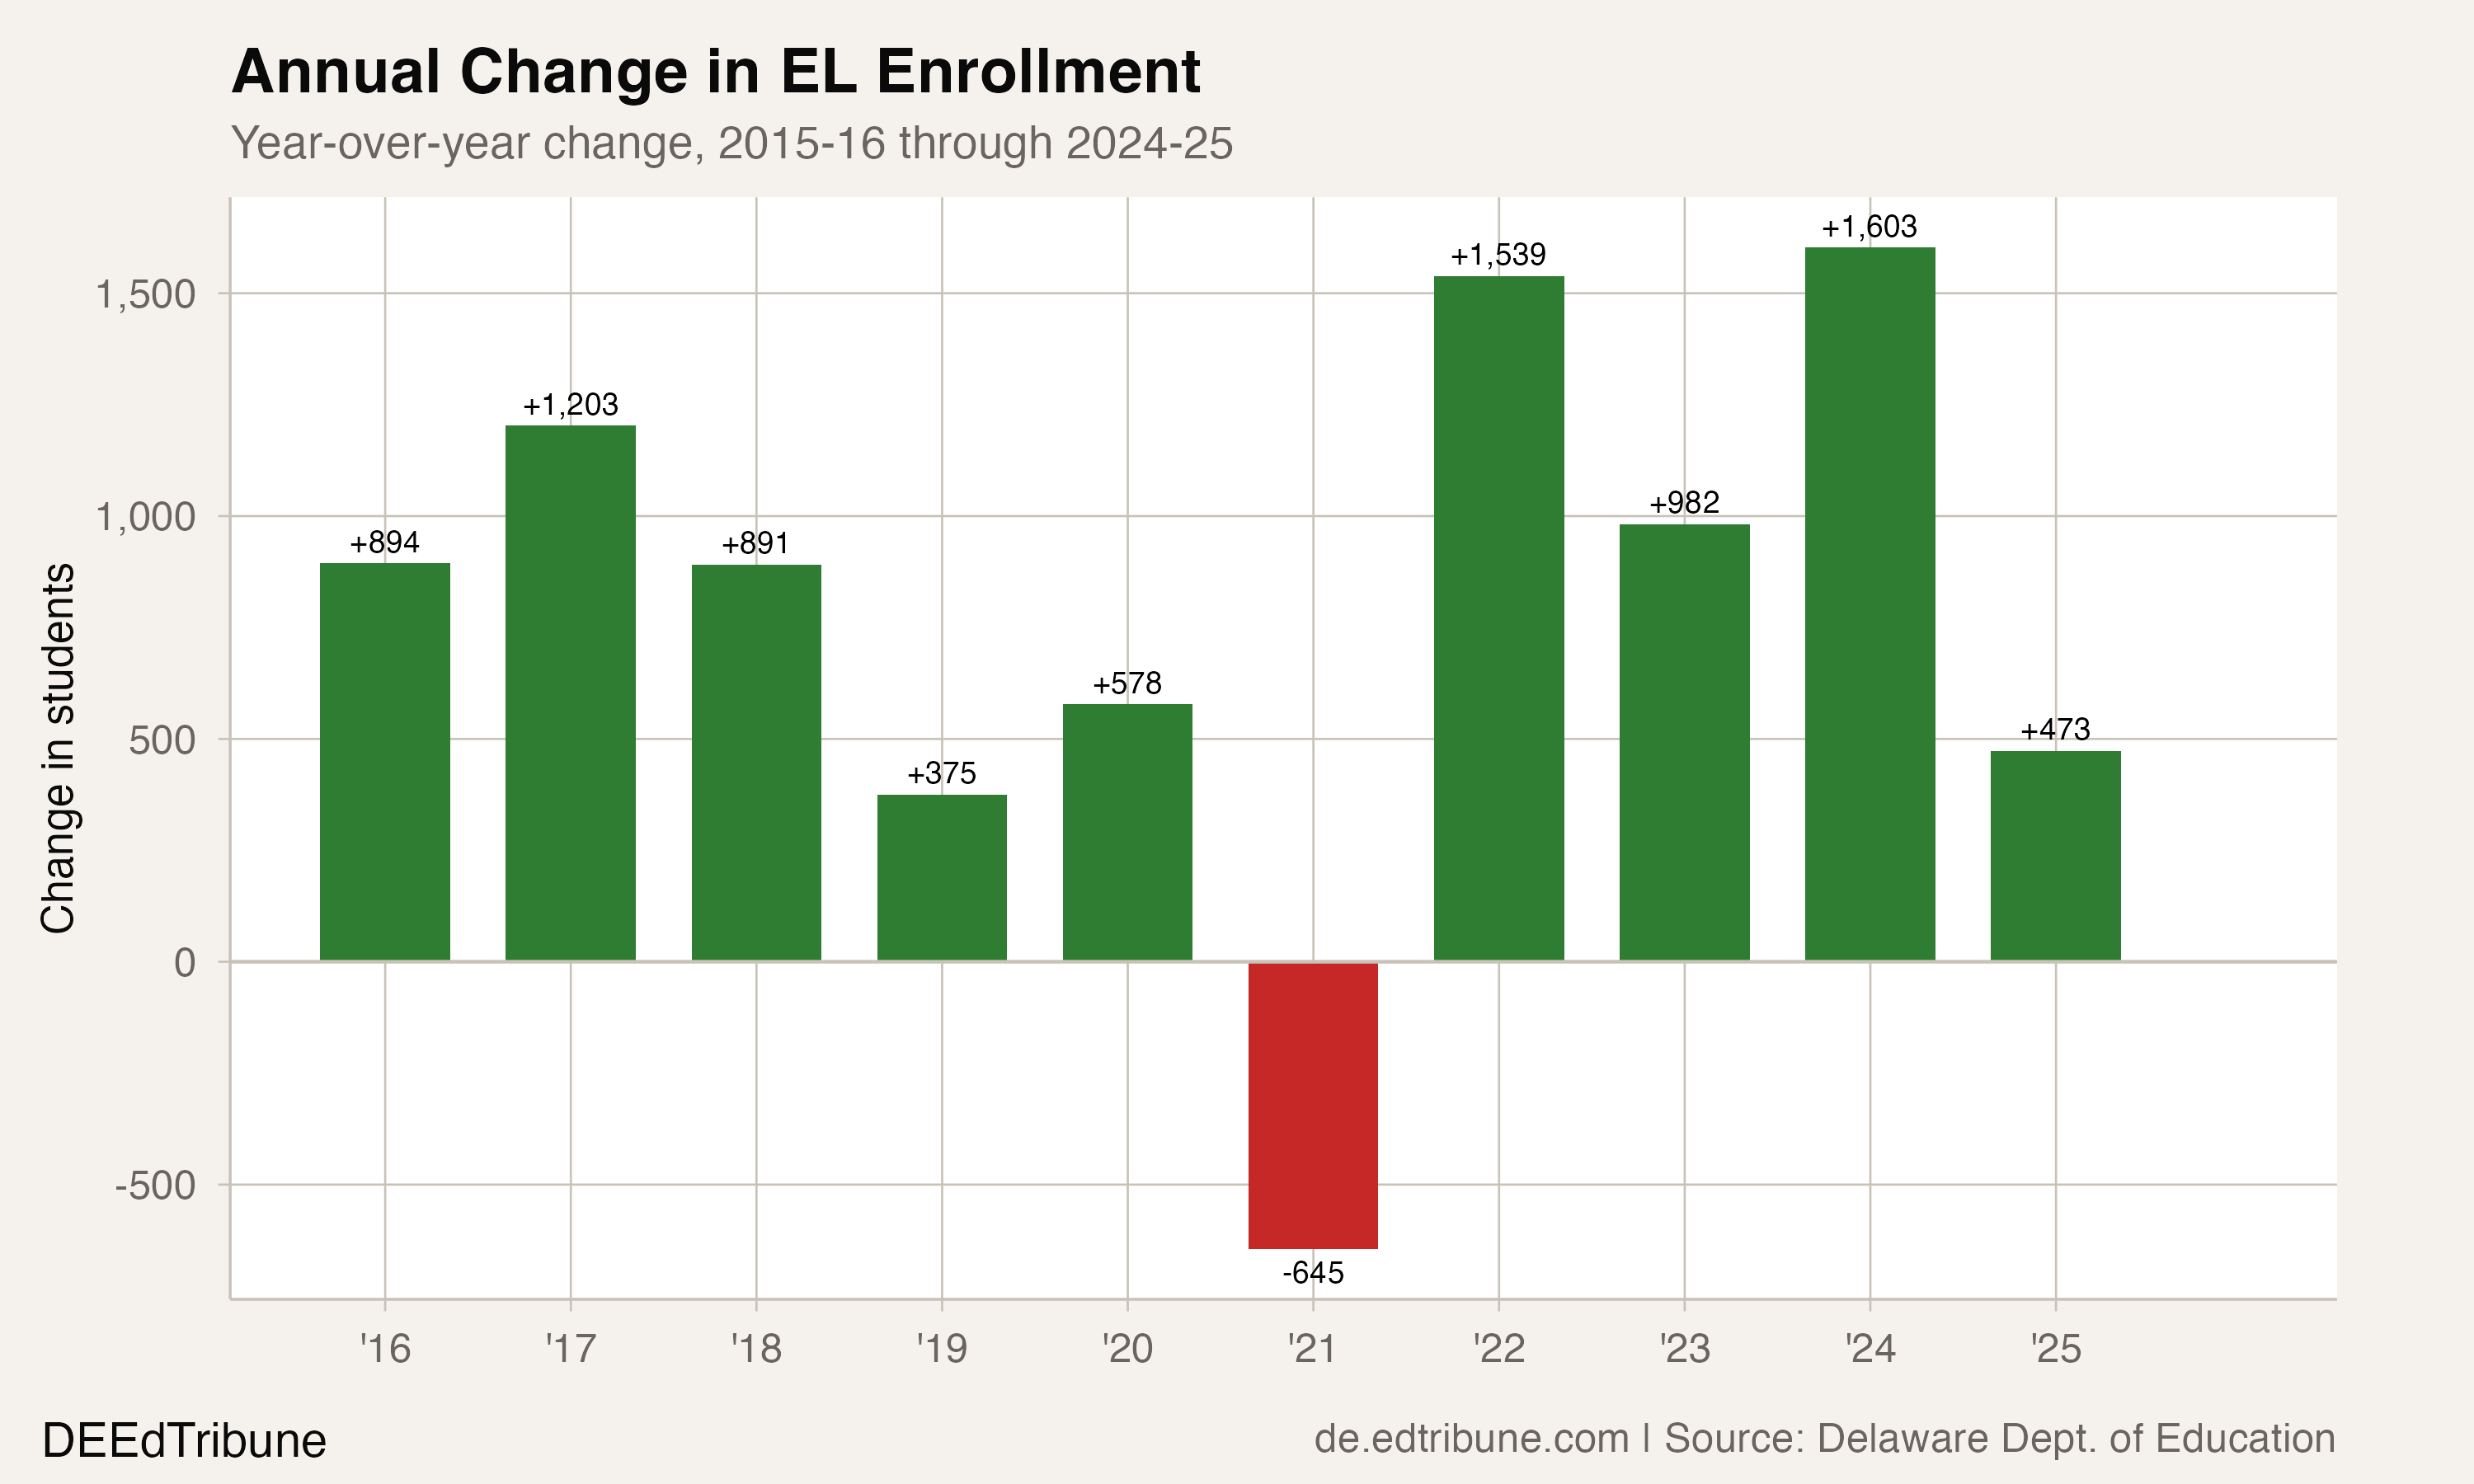
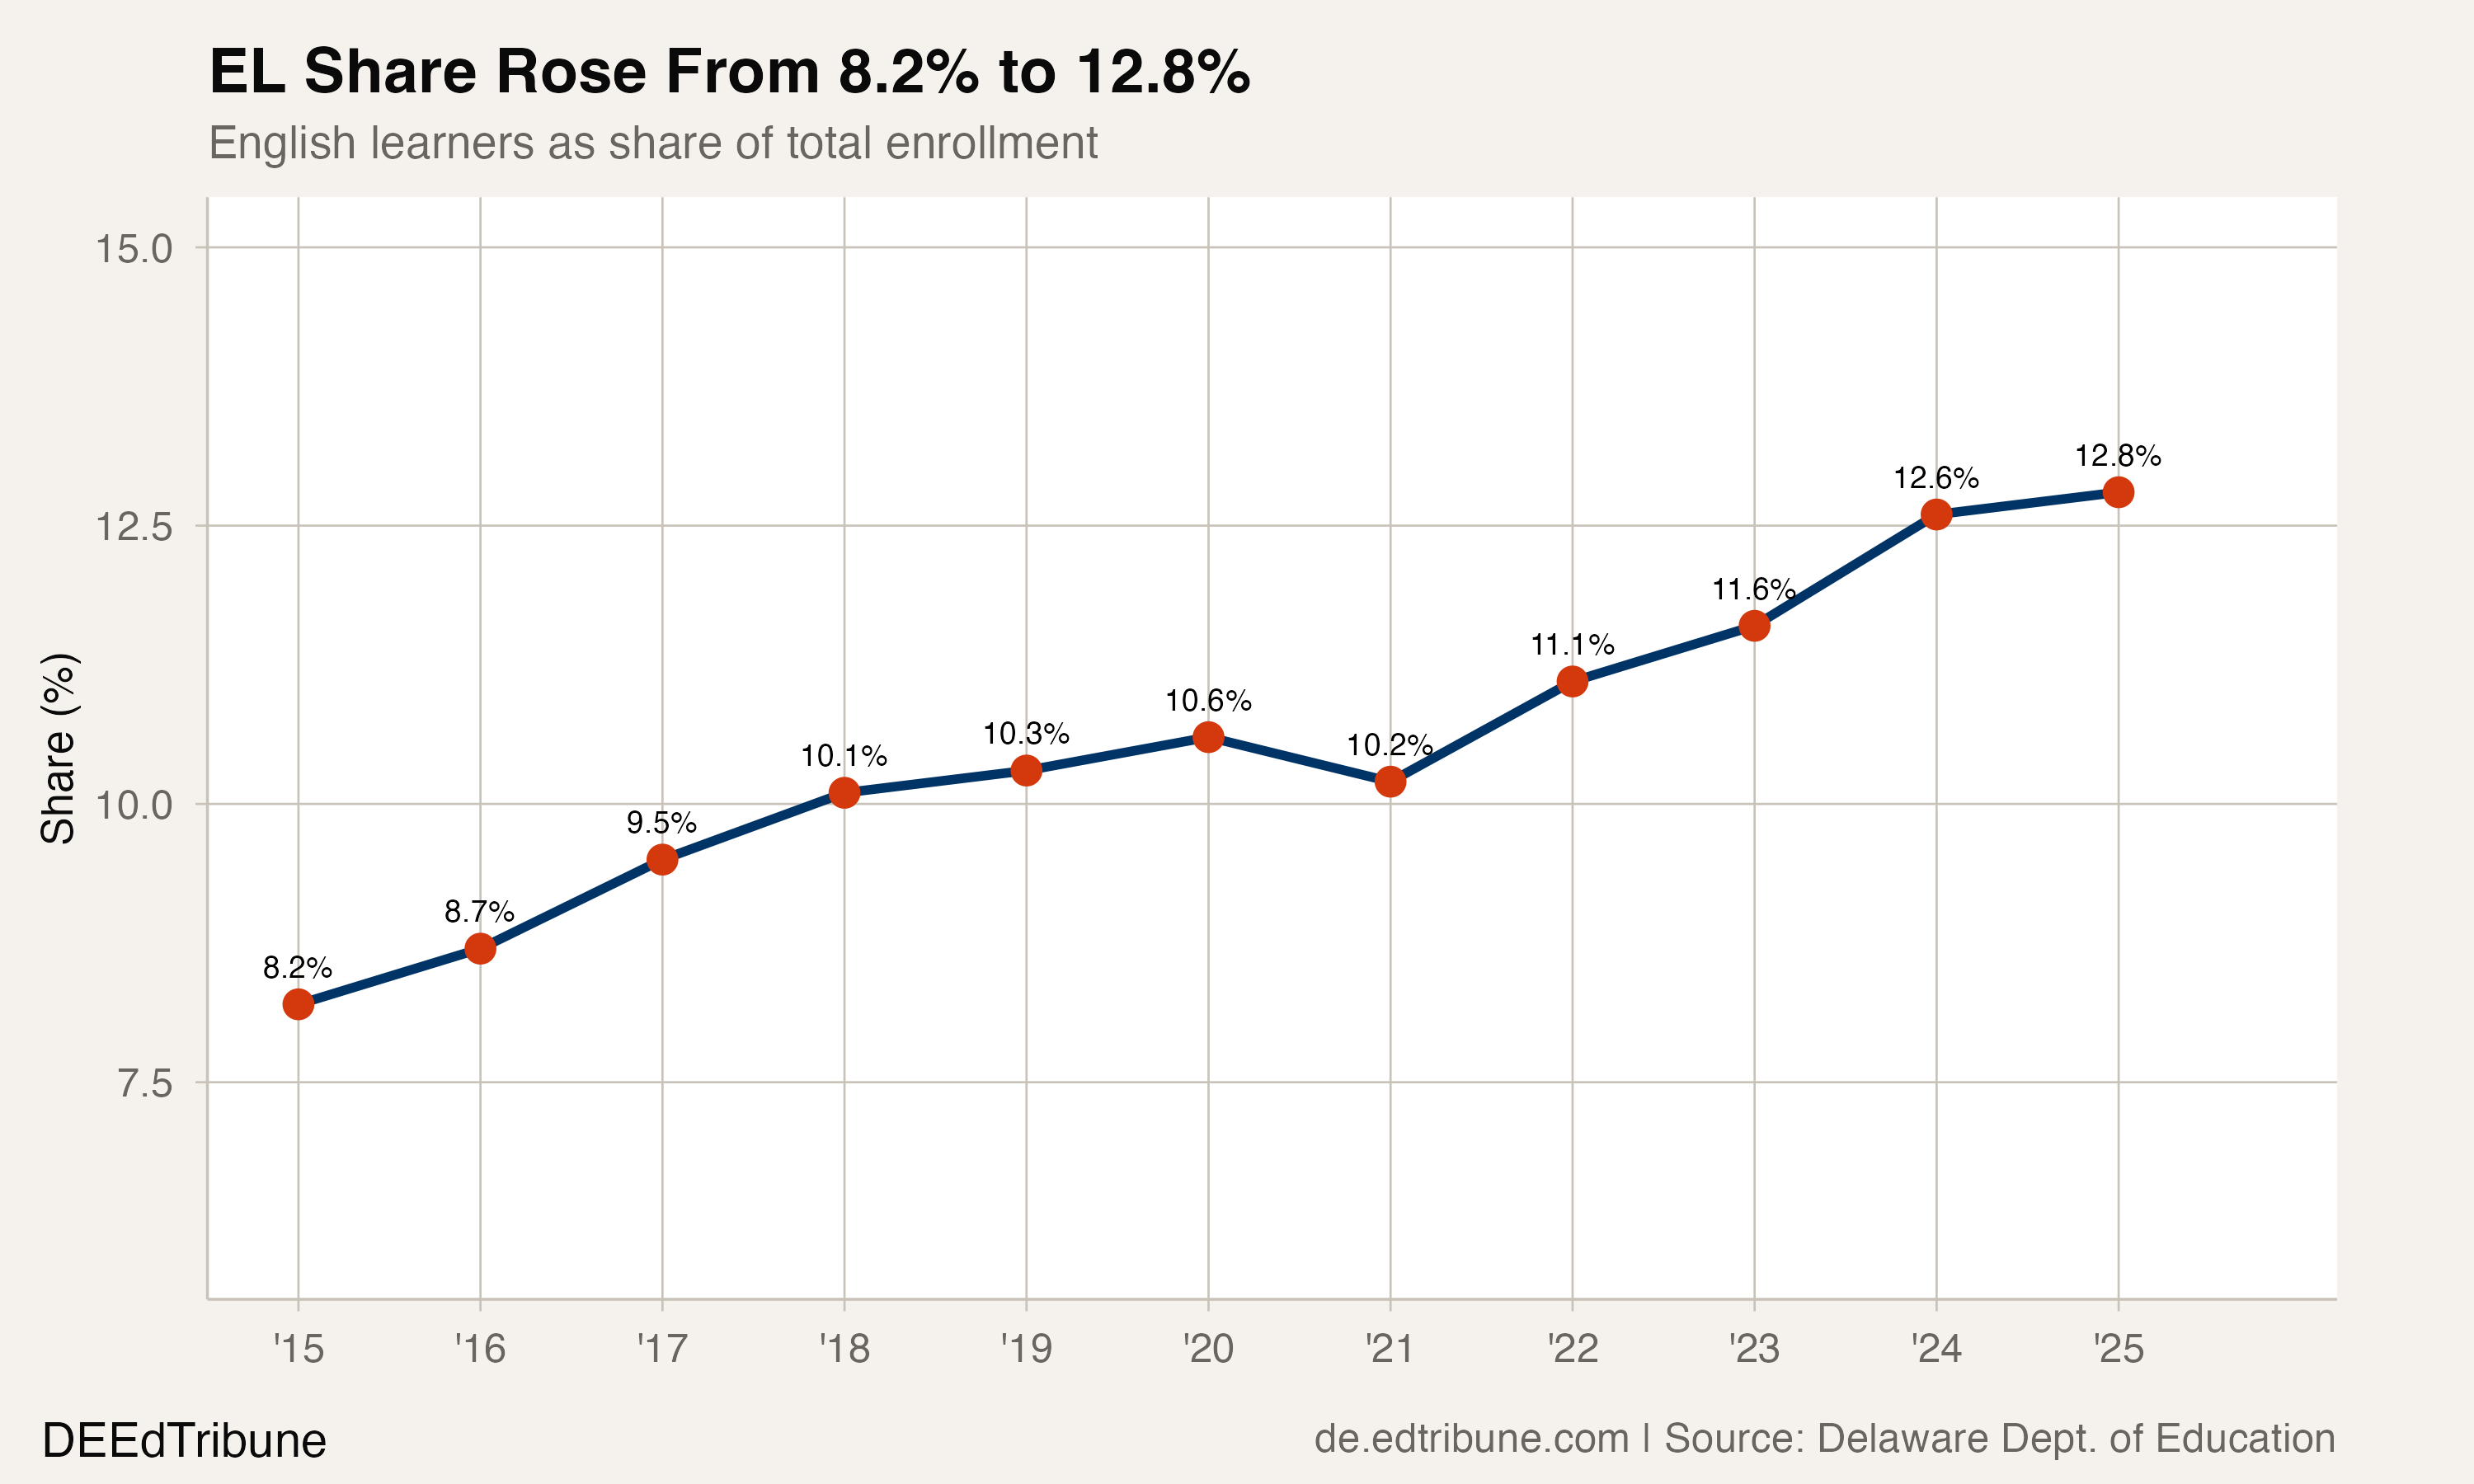
The EL share climbed from 8.2% to 12.8%, a gain of 4.6 percentage points. That acceleration has been uneven. The pre-COVID years saw strong but gradually decelerating growth: +1,203 in 2016-17, then +891, +375, +578. The pandemic dipped enrollment by 645 in 2020-21. The recovery was immediate and fierce: +1,539 the following year, then +982, +1,603, and +473 in 2024-25.
Southern Delaware's transformation
The growth is statewide, but Sussex County is the epicenter. Across seven Sussex County traditional districts, EL enrollment doubled from 3,751 to 7,538, and the aggregate EL share jumped from 12.6% to 22.0%. One in five students in Sussex County's public schools is now classified as an English learner.
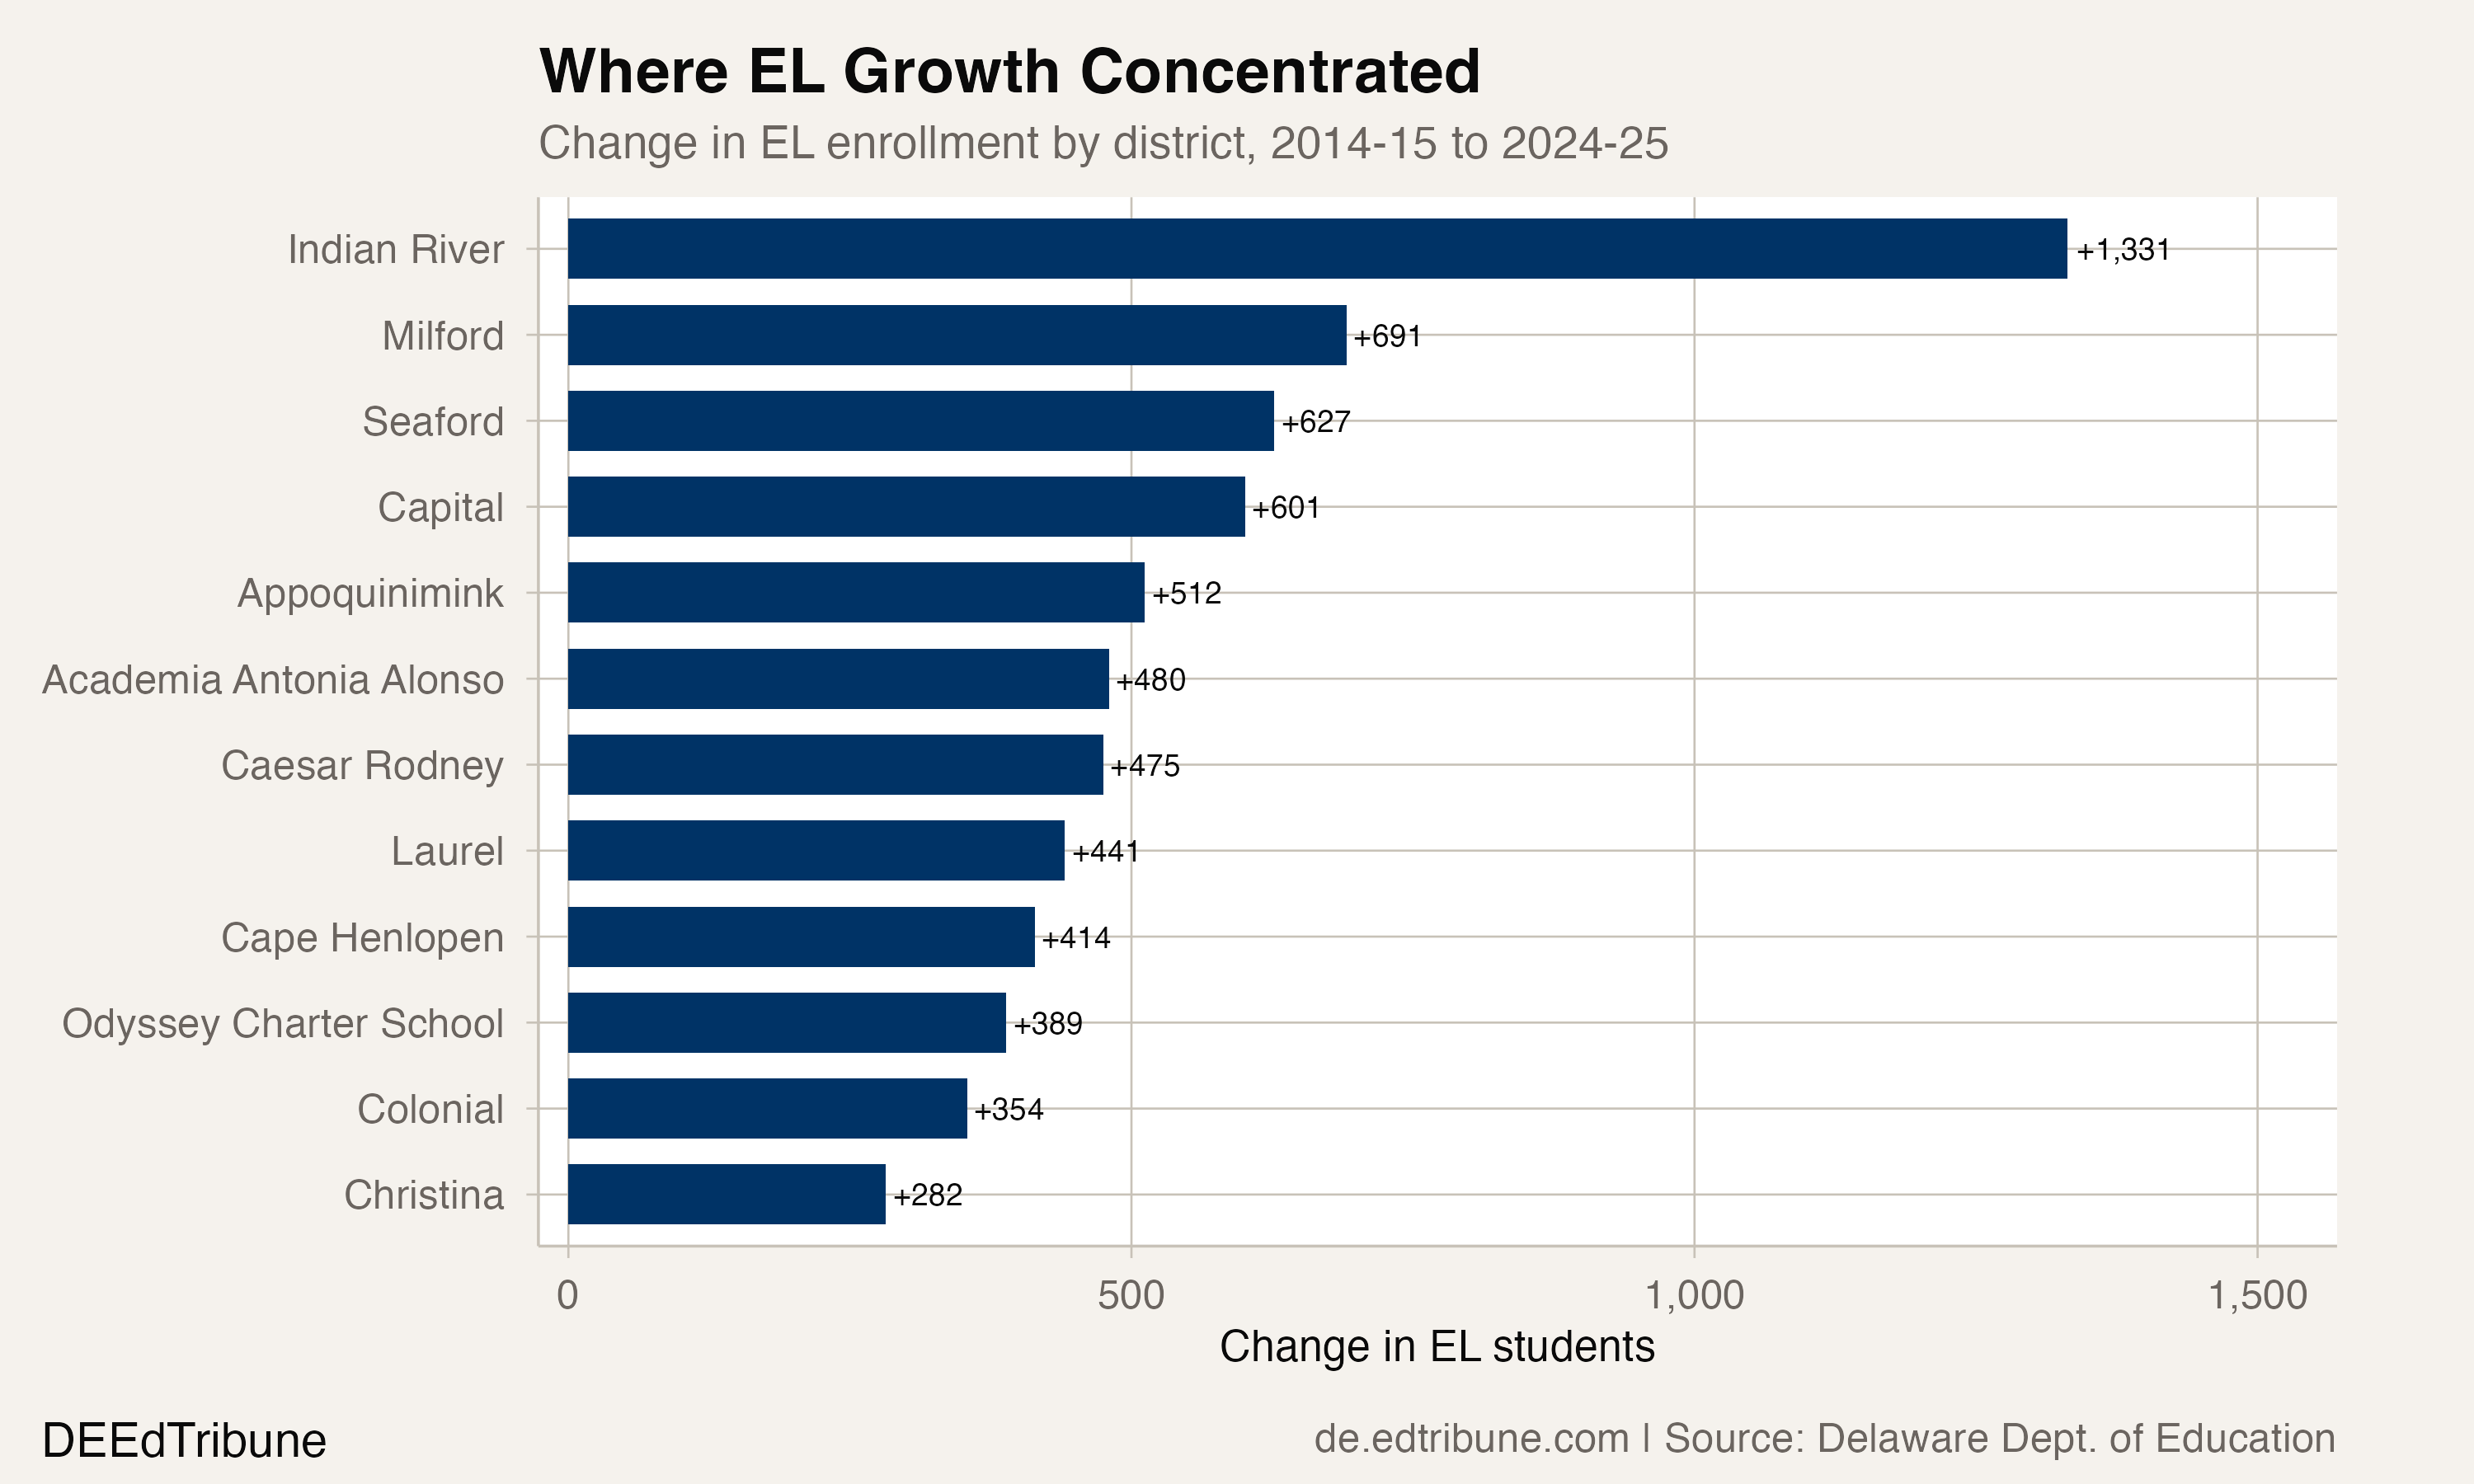
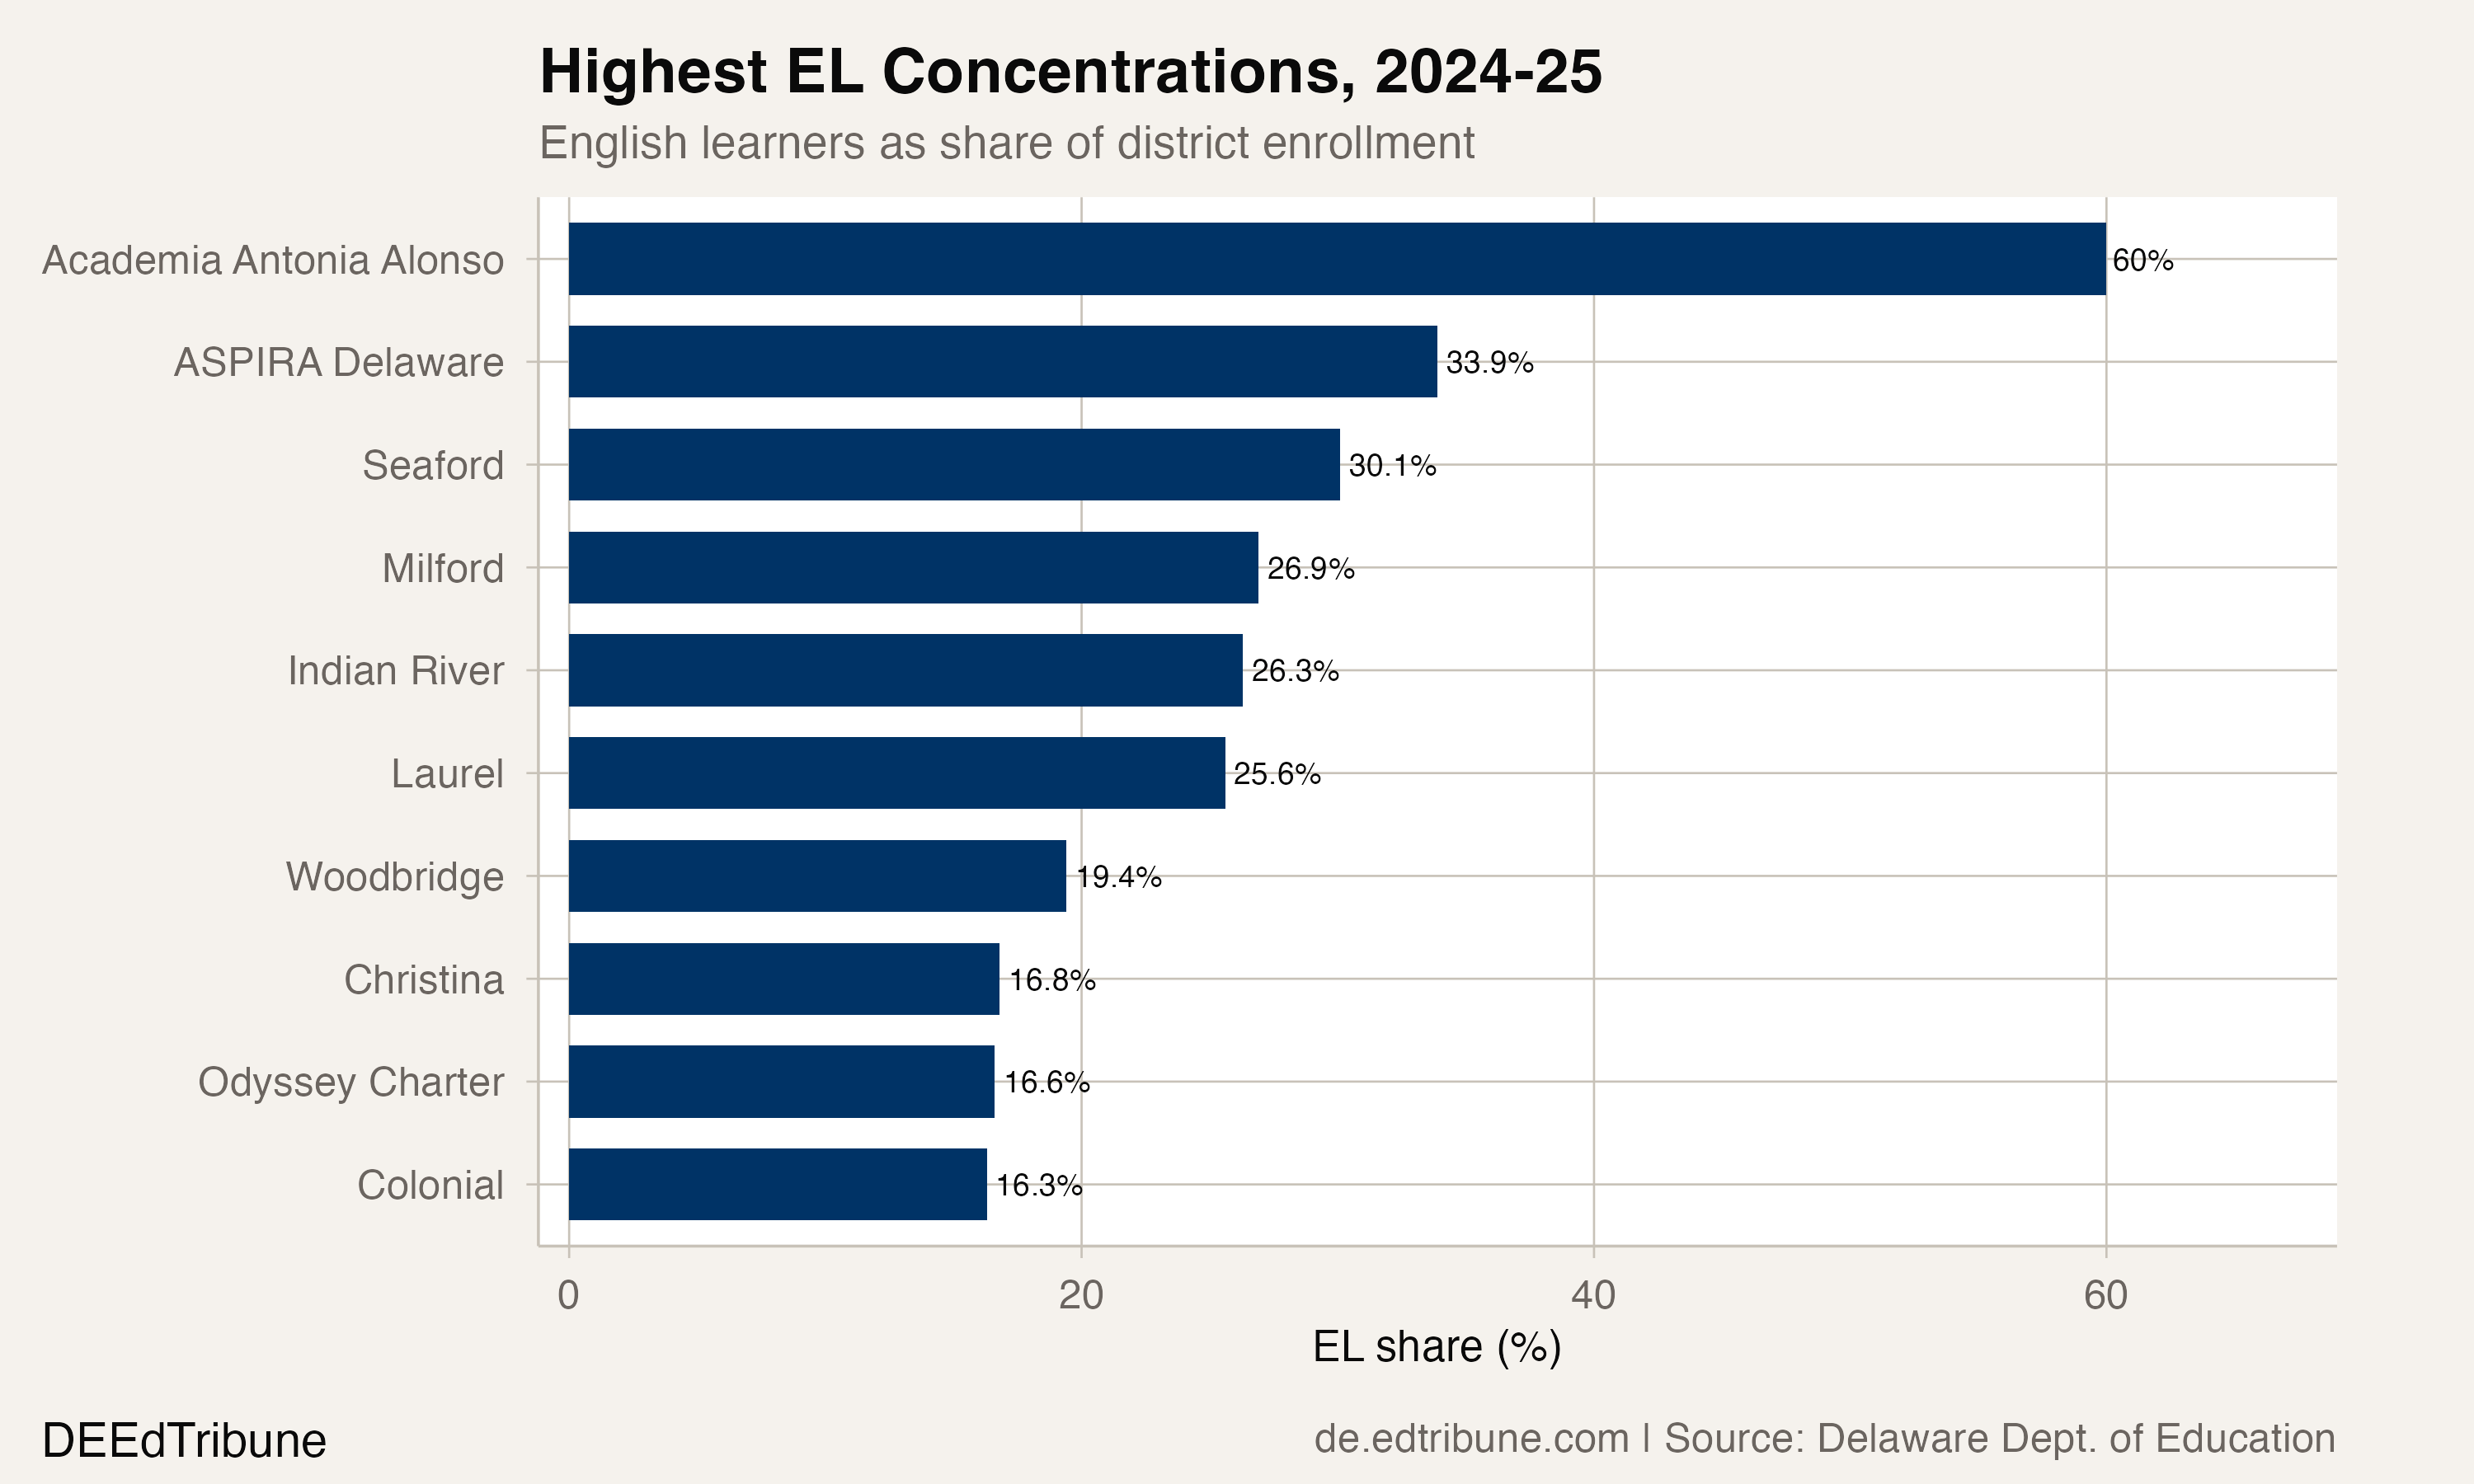
Indian River↗ET added the most English learners of any district in the state: 1,331, bringing its EL population from 1,790 (17.8%) to 3,121 (26.3%). Seaford↗ET went from 559 (14.6%) to 1,186 (30.1%), meaning nearly one in three Seaford students is an English learner. Milford↗ET, straddling the Kent-Sussex border, grew from 524 (11.6%) to 1,215 (26.9%).
The pattern extends well beyond Sussex. Capital School District↗ET in Dover added 601 English learners and saw its share jump from 5.2% to 13.6%. Appoquinimink↗ET, a suburban district in southern New Castle County, went from 169 (1.7%) to 681 (5.0%), a 303% increase off a small base.
Immigration and identification
Two mechanisms produce rising EL counts, and distinguishing them matters. The first is new arrivals: immigrant families settling in communities where jobs are available. The second is improved identification: districts getting better at screening students who were already enrolled but not previously classified as English learners.
Delaware's immigrant population grew 65% from 2000 to 2010, then another 53% from 2010 to 2019, according to Census data cited in a RAND study of Delaware schools. The state's EL population grew sevenfold over two decades, from 2% of enrollment in 2000 to more than 10% by 2019. That trajectory is consistent with actual new arrivals rather than reclassification alone: Sussex County's poultry and agricultural industries have drawn immigrant workers for decades, and the geographic concentration of EL growth in those communities supports this interpretation.
The Delaware Department of Education's Multilingual Learners Strategic Plan notes that EL students now represent more than 100 native languages beyond the most commonly discussed Spanish and Haitian Creole. That linguistic diversity suggests immigration from a broadening set of origin countries, not a single wave.
Whether some portion of the growth reflects improved screening practices is harder to quantify. Delaware expanded its EL identification framework during this period, and districts that previously under-identified students may be catching up. The data cannot separate these two channels.
What research found in Delaware's classrooms
The RAND Corporation studied this exact transformation, using student-level data from 125,500 fourth through eighth graders in Delaware public schools between 2015-16 and 2018-19. The finding ran counter to the common anxiety about newcomer students straining school resources.
"While new ELs may require additional educational resources initially, they do not harm the academic achievement of existing students." -- Umut Ozek, RAND, via Phys.org, Oct. 2024
The study found positive spillover effects on the test scores of current and former English learners, particularly in reading. Three plausible mechanisms: increased EL enrollment triggers additional funding that pays for support staff, teachers adopt more effective instructional strategies to serve linguistically diverse classrooms, and newcomer students bring academic motivation that benefits peers. The effects on non-EL students were negligible, neither positive nor negative.
A funding system built before Brown v. Board
The growth has outpaced Delaware's investment. Only 34 of the state's 227 schools have a bilingual or ESL-certified teacher on staff, according to WHYY. That means roughly 60% of English learners attend a school with no certified specialist in their building.
Delaware provides $1,100 per multilingual learner through its Opportunity Funding program. New Jersey and Maryland spend $6,000 to $9,000 per student on comparable supplemental services.
"We have a system that funds our schools that was established in 1940, before any of the civil rights laws, before Brown v. Board of Education." -- Paul Herdman, president and CEO of Rodel, via WHYY
The American Institutes for Research recommended in 2024 that Delaware increase overall education spending by $500 million to $1 billion annually. Kenneth Shores, one of the report's researchers, described the state as "pretty unusually needy, not so much with poverty, but with its special needs population and the ELL population."
The state legislature has taken incremental steps. Opportunity Funding rose to $60 million in FY2025, more than double its original level. A Public Education Funding Commission continues to evaluate whether to overhaul the state's unit-based funding formula entirely. No legislation has moved yet.
What $1,100 buys and what it does not
The gap between Delaware's EL investment and its neighbors' is not abstract. Christina School District↗ET, the state's third-largest traditional district, enrolls 2,409 English learners at a 16.8% share. Academia Antonia Alonso↗ET, a dual-language charter school in Wilmington, operates at 60.0% EL, the highest concentration in the state. Both serve linguistically diverse populations. Neither has the per-student resources that a comparable school in Maryland or New Jersey would receive.
The mismatch between need and investment is most acute in the small Sussex districts where growth has been fastest. Seaford's EL share more than doubled from 14.6% to 30.1% while the district's overall enrollment grew only modestly. The instructional programs these students receive carry higher per-pupil costs, from translation services to specialized curricula. At $1,100 per student, the Opportunity Funding supplement covers a fraction of that.
Watching the pipeline
The 2024-25 slowdown to +473 new English learners, after two years of adding 1,000 to 1,600, could signal a deceleration. Or it could be a single-year pause before the trend resumes. The underlying drivers, Sussex County's labor market, Delaware's position as a new-destination state, continued immigration to the Delmarva Peninsula, have not reversed.
The question for Delaware is whether the funding and staffing infrastructure will catch up before the population doubles again. At the growth rate of the past four years, the state would reach 25,000 English learners before the end of the decade. The 1940 funding formula was not designed for this, and the incremental adjustments since have not closed the gap.
Detailed code that reproduces the analysis and figures in this article is available exclusively to EdTribune subscribers.
Discussion
Sign in to join the discussion.
Loading comments...